Dynamic stability in random and scale-free B-lymphocyte networks
Leonardo C. Ribeiro and Ronald Dickman
Departamento de Física, ICEx, Universidade Federal de Minas Gerais, 30161-970, Belo Horizonte–MG, Brazil
Américo T. Bernardes
Departamento de Física, ICEB, Universidade Federal de Ouro Preto, 35400-000, Ouro Preto–MG, Brazil
Nelson M. Vaz
Departamento de Bioquímica-Imunologia, ICB, Universidade Federal de Minas Gerais, 30161-970, Belo Horizonte, Brazil 共Received 8 July 2006; published 22 March 2007兲
One of the most intriguing features of the immune system is regulation: a limited response when perturbed repeatedly. We propose a minimal network model for immune regulation in a lymphocyte network containing two types of elements: B lymphocytes and ligands that bind to their receptors. Effective interactions between B cells, mediated by other components of the immune system can be excitatory or inhibitory. In our model, B cell clones and ligand species are represented by nodes, and interactions by links. We expect that, as in many complex systems, the connectivity distribution is broad, motivating study of the model on a scale-free network; for comparison we study the same dynamics on a random graph. We characterize the dynamics of the model and its response to perturbations. Our model reproduces several key features of immune system dynamics: regulation共saturation of response兲, and more rapid response upon repeated perturbation with the same agents. Our results suggest that a scale-free network of interactions contributes to the regulation and dynamics of the immune system.
DOI:10.1103/PhysRevE.75.031911 PACS number共s兲: 87.10.⫹e, 87.16.Yc, 87.16.Ac, 05.10.⫺a
I. INTRODUCTION
Lymphocyte-mediated immunity is a remarkable charac-teristic of jawed vertebrate organisms. Immunology has made spectacular advances in the last decades in terms of defining the genetic, molecular, and cellular components in-volved in these phenomena. In this work we propose a mini-mal model for immune regulation in a lymphocyte network. Immunological activity is based on the activation of T and B lymphocytes generated by special 共“combinatorial”兲 so-matic processes of gene rearrangement in which each lym-phocyte acquires a unique membrane receptor. If activated, a lymphocyte may multiply and form cell clones with a vari-able number of cells; if it is not activated, it will likely die by apoptosis without ever dividing. Binding of the specific re-ceptor共BCR or TCR兲is important for cell activation and in determining whether or not the lymphocyte will survive and expand. B lymphocytes may further turn into plasma cells, which are short-lived cells that secrete soluble forms of the BCR to the extracellular space, where they are known as immunoglobulins共Ig兲.
Immunological memory, or the ability to generate second-ary immune responses 共more sensitive, intense, and pro-longed兲 upon contact with previously encountered antigens, is believed to play an important role in anti-infectious immu-nity and to be the basis of the efficacy of some vaccines. T lymphocytes are involved in the generation of immunologi-cal memory. This memory, however, must be limited to avoid progressively higher responses upon repeated contacts with the same or similar antigens, as this would trigger damaging inflammatory reactions. Secondary responsiveness, therefore, must be submitted to some form of regulation, currently a subject of intensive investigation关1,2兴. Regulation must also account for the absence共in normal organisms兲of progressive
immune responses to dietary proteins关3兴and products of the autochthonous microbiota 关4兴, which together represent by far the largest collection of foreign macromolecules to which the organism is daily exposed.
Above all, lymphocytes must be prevented from making progressive immune responses to the organism itself, includ-ing to other lymphocytes durinclud-ing their mutual interactions. Explanation of this kind of regulation, also known as natural tolerance, is a prime objective of any theory aiming to elu-cidate immunological activity关5兴. Natural tolerance does not imply the absence of reactivity to body components, as de-manded by initial versions of the clonal selection theory关6兴. Self-reactivity, in the form of abundant autoantibody forma-tion关7兴and autoreactive T cells关8兴, is now accepted as part of healthy immunological physiology.共The transformation of these dynamically stable forms of autoreactivity into pro-gressive, secondary immune responses characterizes a vari-ety of autoimmune diseases关9,10兴兲. These observations dem-onstrate the need to study the global dynamics of interactions within the immune system.
Diverse mechanisms mediate the interactions between B and T lymphocytes关11–13兴. As a consequence of this multi-plicity, distinct B cell clones may become functionally con-nected via a certain T cell population. Those mechanisms can generate effective interactions between B cell clones, allow-ing us to view the immune system as a highly connected network关14兴.
random network of interactions, in physical space关19,20兴or in a space of molecular shapes关21,22兴.
Among the many network structures possible, three gen-eral classes, commonly known as regular, random, and scale-free networks, have attracted interest in modeling complex systems. By a regular network we mean a lattice structure with links between nearest neighbors, with each node 共or site兲 having the same number of neighbors. A maximally random network共or Erdös-Renyi graph兲is a collection of N
nodes, with each of the N共N− 1兲/ 2 possible links present, independently with probabilityp. In this case the number of neighbors varies from site to site; the probabilityp共k兲for a node to have exactlykneighbors共“degreek”兲follows a Pois-son distribution. 共Structures that are random but preserve some degree of regularity are also possible, such as small-world networks兲. A scale-free network may be either random or regular; it is characterized by a degree distribution p共k兲
that decays as a power law, so that there is no characteristic degree. Following the work of 共Barabasi and co-workers 关23,24兴兲, it is now apparent that the connectivity structure of diverse types of natural and social systems are well repre-sented by scale-free networks.
There is evidence that the network of interactions within the immune system is not maximally random. Early in onto-genesis, natural immunoglobulins spontaneously organize to form defined profiles of reactivity with complex mixtures of ligands 共molecules that bind to specific B cell receptors兲, which from then on are robustly conserved despite continu-ous exposure to immunogenic materials. The form of these profiles is influenced by alleles of genes important in immu-nological activity 关25兴. The transfer of maternal IgG to the young also influences the pattern of immunological activity in specific ways关26兴. These observations demonstrate highly organized immunological activity, influenced by specific ge-netic and molecular elements. The point is that, although the generation of lymphocyte receptors involves random shuf-fling of genetic material, the actual lymphocyte population of an organism is shaped by interactions with proteins, both intrinsic and foreign, so that the result is far from being a maximally random collection of receptors.
There are suggestions in the current immunology litera-ture of struclitera-tured networks. Given the evidence for a highly connected web of autoreactive components, coexisting with specific responses to foreign antigens, Varela and Coutinho 关27兴proposed a functional split of the immune system into central and peripheral parts, the connectivity of the former being much higher than that of the latter. Cohen 关28兴 pro-posed a hierarchy of immune reactivity, in which certain T cell clones regulate the activity of various other clones. These proposals for structured immune interactions are better accommodated in a scale-free network than in a maximally random one, motivating our study of both architectures.
In our highly simplified model, each site in the network represents either a B cell clone or a species of ligand; in each realization, the network architecture is fixed. A variable de-fined at each site represents the clonal population or ligand concentration. The dynamics of the system involves steady generation and death of B cells and random input of ligands. A given ligand stimulates a certain set of B cell clones, and is in turn eliminated when these clones expand. There are also
interactions, both excitatory and inhibitory, between specific pairs of B cell clones.
Starting with all population variables set to the same value, the system relaxes to a stationary state, with a broad distribution of population sizes, which is found to be stable to small perturbations. We study the response of the system, starting from the stationary state, to relatively large perturba-tions caused by a sudden increase in a small set of ligand populations. The perturbation represents a challenge to the immune system accompanying, for example, an infection or exposure to foreign proteins. The excess of ligands is elimi-nated by the system, which subsequently relaxes to a station-ary state, generally different from that preceding the pertur-bation. The model exhibits regulation in the sense that the response to each perturbation is limited. Memory appears in the form of a sharpened response to repeated challenges with the same set of ligands.
The balance of this paper is structured as follows. In Sec. II we define the structure and dynamics of the model, Section III contains results obtained via numerical simulation. In Sec. IV we discuss, conclude, and suggest extensions of this work.
II. THE MODEL
Since immunological activity involves manifold, complex mechanisms, we must decide which part of the system we intend to model. B lymphocytes may bind substances di-rectly to their membrane receptors 共BCR兲 but, in general, they are not activated when this happens. By contrast, T lymphocytes are unable to bind isolated molecules to their receptors共TCR兲; the molecule共usually a protein兲must first be captured and processed by accessory cells, and then pre-sented to T lymphocytes along with certain accessory mol-ecules 关29–31兴. Various types of cells may function as pre-senting cells for T lymphocytes; among them are the B lymphocytes themselves, a point of considerable importance in developing a network model.
in-teraction is such that presence of the ligand stimulates ex-pansion of the B cell population, while a B cell clone tends to reduce the quantity of the ligands that stimulate it. The rate of excitation of a clone is given a function ␣共lnx兲, where␣is Gaussian共see below兲andxrepresents the sum of excitatory influences on the clone in question. 共We believe direct interactions between different species of ligands to be unimportant in the present context; they are not considered in the model.兲 Figure 1 is a schematic representation of the model. Circles represent network sites: lymphocytes共B兲and ligands 共L兲. Continuous lines represent excitatory interac-tions and dotted lines suppressive ones.
The model evolves in discrete time; five kinds of events lead to changes in population.
共i兲New B cells enter the system continuously, represent-ing production in the bone marrow. Each clone receives a number of new cells per unit time. The number of cells produced per unit time is fixed, independent of the popula-tion sizes 兵Bi其 and 兵Li其. Ligands also enter the system at a fixed rate of molecules per species and per unit time.
共ii兲B cells continually leave the system due to cell death. Removal occurs at a fixed rate per cell, so that the number of cells removed per unit time from cloneiis proportional toBi. 关Note that a B cell clone may disappear and subsequently reappear via mechanism共i兲.兴
共iii兲A B cell population grows due to interactions with ligands or other B cells. The contribution to the growth rate due to a neighboring ligand population 共at site j, say兲 is given by the function␣共Lj兲 共defined below兲, whereLjis the number of ligand molecules of type j. Similarly, for sitesk
bearing B cell clones having a stimulatory interaction with B cell clonei, the contribution to the growth rate ofBiis␣共Bk兲. 共iv兲 B cells are eliminated by suppressive interactions with other B cell clones.
共v兲Ligand populations are reduced due to the interaction with B cell clones.
The above dynamics is studied via numerical simulation. To generate an Erdös-Renyi random network ofm=NL+NB sites, we link each pair of sites with probabilityp, indepen-dently共we usem= 9000 andp= 0.01兲. To construct a SFN of
msites, we follow the Barabasi-Albert prescription关23,24兴:
m0= 10 connected sites are the initial seed of the network.
Then a new site is added and connected to sites.共We use = 10 in the studies reported here.兲The probability of con-necting the new site to a given site j is proportional to the number of sites already connected to site j. This process is repeated until a network of m sites has been grown. The network generated by this prescription shows a power-law degree distribution P共k兲 ⬃k−c with c= 2.89共2兲. After con-structing the network共either Erdös-Renyi or scale-free兲, NL sites are selected to represent ligands共type-L sites兲 species and the remainingNB=m−NLsites共type-B sites兲represent B cell clones. Note that links between ligand sites, which con-stitute on average 25% of all links, are nonfunctional. After depleting these nonfunctional links, the degree distribution follows a power law with exponent= 2.87共2兲, essentially the same as before pruning.
At each step in the evolution, the following sequence of events is realized:
共1兲A site is chosen at random. The associated population increases by, regardless of whether it represents an ligand type or a B cell clone.
共2兲Another site iis chosen at random. If it is of type B, the corresponding populationBireduced byBi.共Otherwise there is no change.兲
共3兲A pair of connected sites are chosen at random. If both are of type L there is no change. In the case where one site is of type B共Bi, say兲and the other of type L共species
Lj, say兲, thenBiincreases by the factor 1 +␣共Lj兲, whereLj is the number of ligands j per Bi cell. At the same timeLj
decreases by␥LBi. If both are of type B and the interaction between them is excitatory, the population of each clone in-creases by the factor 1 +␣共B兲, whereBis the concentration of complementary B cell population. If both are of type B and the interaction between them is suppressive, the popula-tion of each clone decreases by the factor 1 −␥bB.
If the result for a new population size,Bior Li, turns out to be negative, it is instead set to zero. The above events are repeated in sequence for a total of M steps. In the studies reported here on scale-free networks we use the values ␥L = 1 / 25,␥b= 1 / 50, and= 1 / 100; for Erdös-Renyi networks we use␥L= 1 / 25, ␥b= 1 / 10, = 1 / 50. The function mediat-ing excitatory influences is ␣= 0.3 exp兵−关ln共x/ 1000兲兴2/ 2其. This function reflects the fact that B cell activation is maxi-mal for intermediate concentrations, and is smaxi-mall for both very low, and very high ligand concentrations关17兴.
III. SIMULATION RESULTS
Initially, all population variables are equalAi=Bi= 1000, ∀i. At short times the dynamics is dominated by the ligand-stimulated growth of certain B cell clones. B cell prolifera-tion in turn causes a reducprolifera-tion in ligand concentraprolifera-tion, lead-ing to a decrease in the B cell population共due to the finite B cell lifetime兲, until a stationary state is established.
We adopted the following protocol to study regulation and memory in the model. Once a stationary state is attained, we perturb the system by increasing the population of a small number 共ten兲 of randomly chosen ligand species. For each set of perturbed ligands, call the set of B cell clones directly linked to this set the “first-line clones.” Following the per-L
1 L2
L 3
L 4 B
1 B
2
B 3
B 4
B 5
turbation, the first-line clone populations grow, so that the perturbation is suppressed, and the system relaxes to a sta-tionary state. The perturbation/recovery protocol is repeated several times. We allow the system to reach a stationary state before perturbing it, always with the same set of ligands in a given study.共It is worth noting that, without suppressive in-teractions between B cell clones, the B cell population grows without limit following the perturbation, instead of reaching a steady state.兲 Following each perturbation we determine three quantities that characterize the response of the system: 共i兲 the integrated excess mean B cell population I in the transient state;共ii兲the time necessary for the mean ligand population decay to 1 / 5 of its value at the moment of per-turbation; 共iii兲 and the average Hamming distance, defined here asH=N1兺i
N兩B i 共n兲
−Bi共0兲兩, where Bi共n兲 is the stationary av-erage ofBiafternperturbations.共Bi
共0兲
is the average prior to any perturbation.兲 In general, the Hamming distance is a measure of system response when perturbed. The Hamming distance averaged over first-line clones represents the imme-diate response to infection, while that averaged over the en-tire system reflects global reorganization. 共Note that in the latter case, some clonal populations will actually be smaller after infection, but they make a positive contribution toH.兲 We interpretIas a measure of the overall immune response to the infection.
Figure2shows the Hamming distance per clone for three different sets of B cell clones, as a function of number of perturbationn, in the scale-free network. These results rep-resent an average over 50 independent realizations. Open circles represent the Hamming distance of the ten most con-nected clones, the largest hubs of the network; open squares represent the Hamming distance of the first-line clones, and filled circles represent the Hamming distance averaged over all B cell clones. The Hamming distance saturates after about eight infections.
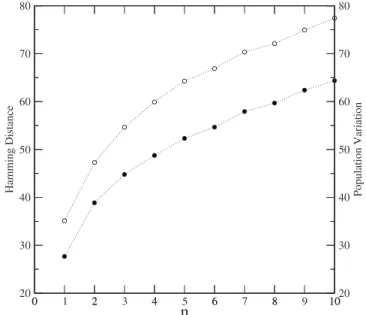
Figure3shows the Hamming distance共open circles兲and the variation of first-line B cell population 共filled circles兲. The latter is used in immunological experiments as a mea-sure of specific immune response. In the case of first-line B clones, the Hamming distance and population follow the same trends, supporting our interpretation of Hamming dis-tance as a measure of specific immune response, and its gen-eralization to the other sets of B cells defined above.
Note that the Hamming distance averaged over the ten largest hubs is greater than that of the first-line clones or that averaged over all clones. This suggests that the perturbation initiated at the first-line clones propagates through the net-work until it is suppressed by the hubs. To test this hypoth-esis, we perform simulations共following the same procedure as described above兲, in which, once the system attains a sta-tionary state following the first perturbation, we remove the 10 most connected sites from the network.共This procedure is used to test robustness of SFN against attacks and random failures 关24,32–34兴.兲 The result 共Fig. 4兲 is that the mean population of B clones grows by about 800%, showing that the hubs are responsible for regulation of the network.
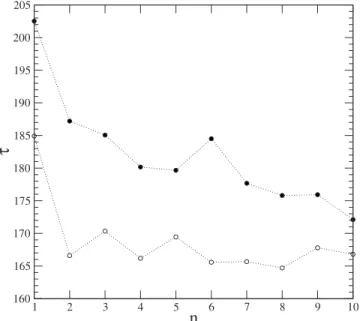
Figure5shows the timeneeded to eliminate a perturba-tion as a funcperturba-tion of the number of perturbaperturba-tions. Two dif-ferent situations are studied. In the first共open circles兲, only the first hub共the most connected one兲is a B cell clone, that is, the sites ranked 2–10 in order of connectivity all represent ligand populations. In the second case共filled circles兲the ten most connected sites are B cell clones. After each infection the time necessary to eliminate the perturbation tends to be smaller, demonstrating memory. The enhanced rapidity of response is more marked when all ten of the most highly connected sites represent B cell clones, suggesting that memory is associated with regulation. Further evidence of memory is the systematic increase 共Fig. 6兲 of immune re-sponseI 共the area under the curve of the mean B cell popu-lation in the transient state兲following each perturbation, fol-lowed by saturation, as observed experimentally关35兴.
0 1 2 3 4 5 6 7 8 9 10
n 40
60 80 100 120
Hamming
Displacement
FIG. 2. Hamming distance per clone versus perturbation number non the scale-free network, for the ten most connected clones共open circles兲, first-line clones 共open squares兲, and averaged over all B cell clones共filled circles兲.
0 2 4 6 8 10
n
2030 40 50 60 70 80
Hamm
ing
D
istance
0 1 2 3 4 5 6 7 8 9 1020
30 40 50 60 70 80
Po
p
ulation
Variation
We also performed simulations on Erdös-Renyi networks, following the same procedure as for the scale-free network. Figure 7 shows the Hamming distance per clone of three different sets of B cells clones, as a function of the number of perturbations. Open circles represent the Hamming dis-tance of the ten most connected clones, open squares the Hamming distance of first-line clones and filled circles the Hamming distance averaged over all clones. The variation of Hamming distance in this case is about 7% while in the scale free network it is about 20%, showing that the response in
the random network is weaker than in the scale-free network. The variation ofas a function of the number of infections follows the same trends as observed in the scale-free network 共see Fig. 8兲. The role of highly connected sites in the ER network is however different than in the scale-free case. The variation of Hamming distance of the ten most connected sites is smaller than that of the first-line clones. Moreover, depleting the ten most connected sites does not provoke the marked growth in B cell population observed in the scale-free network. These observations suggest that the sites with high connectivity are not essential to regulating the random
0 5000 10000
Time
0500 1000 1500 2000 2500 3000 3500
B
Mean
Population
Hubs Depletion Infection
FIG. 4. Evolution of mean population of B clones. Att= 5000 the system is perturbed and att= 10 000 the ten most connected sites of network are deleted.
1 2 3 4 5 6 7 8 9 10
n
160 165 170 175 180 185 190 195 200 205
τ
FIG. 5. Timeneeded to eliminate a perturbation as a function of the number of perturbations, on a scale-free network. We com-pare the case in which the ten most connected hubs represent B clones共open circles兲, with that in which only the most connected hub represents a B clone共filled circles兲.
0 1 2 3 4 5 6 7 8 9 10
n
500000 520000 540000 560000 580000 600000
I
FIG. 6. AreaIunder the curve of the mean B cell population in the transient state as a function of number of perturbations, on a scale-free network.
0 1 2 3 4 5 6 7 8 9 10
n
05 10 15 20
Hamm
ing
D
istance
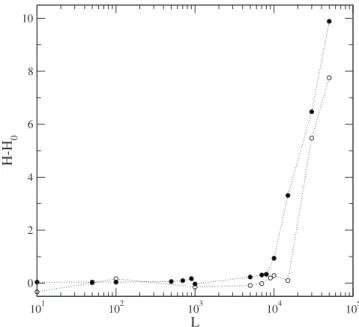
network, as they are in regulating the scale-free network. A series of studies were realized to probe the stability of the system. Once a stationary state is attained, we introduce a small perturbation and study the resulting variation in the mean Hamming distance of the B cell population. The per-turbation is made by choosing randomly single ligand, not highly connected, among the 4500 in the network, and changing its population to a certain value L. Since ligands are suppressed by the system dynamics, they generally have very small populations in the stationary state, so thatL is a measure of the perturbation. After a new stationary state has been reached, we calculate the mean Hamming distanceHof B cell clones between this new state and that prior to the disturbance. Since the system is subject to a certain random drift over time, even in the absence of a perturbation, it is of interest to study H−H0, where H0 is the mean Hamming distance calculated for the same time interval but with no perturbation. Figure9showsH−H0as a function ofL, for a scale-free network 共full circles兲, and for a random network 共open circles兲. Small perturbations produce no significant long-term change in configuration: the system remains in the same basin of attraction. For larger perturbations the system leaves the initial basin of attraction and visits many configu-rations until reaching a new basin of attraction. These results indicate that the system is locally stable.
The random and scale-free networks studied have the same number of nodes共N= 9000兲 and the same mean num-ber of connections共about 10 per node兲; the difference lies in how the nodes are connected. In the stability analysis we use the same set of parameters共,␥L,␥b兲 so that we may com-pare directly the behavior of the two networks. Figure 9 shows that the Hamming distance grows more rapidly withL
in the free network than in the random one. The scale-free network presents a higher sensitivity to共large兲 perturba-tions, suggesting that the basins of attraction are more dis-tant. In Fig.10we show the behavior of, the time necessary for the mean ligand population decay to 1 / 5 of its value at
the moment of perturbation, as a function ofL. In the scale free network 共full circles兲 this time is smaller than in the random network共open circles兲. The greater change in B cell populations in the scale free network is accompanied by faster elimination of the disturbance.
IV. CONCLUSIONS
We introduce a network model for the population dynam-ics of B cell clones and associated ligands; both scale-free and random networks are investigated. Our simulations show
0 1 2 3 4 5 6 7 8 9 10
n
29503000 3050 3100 3150 3200
τ
FIG. 8. Timeneeded to eliminate a perturbation as a function of the number of perturbations, on a random network.
101 102 103 104 105
L 0
2 4 6 8 10
H-H
0
FIG. 9. Excess Hamming distanceH−H0for two copies of the
system, with and without perturbation function ofL: for a scale free network共full circles兲, and for a random network共open circles兲.
101 102 103 104 105 L
0 100 200 300 400 500 600 700 800 900
τ
that the model attains a stationary state following a certain initial transient. Once a stationary state is attained, we per-turb the system by increasing the population of a small num-ber of randomly chosen ligand species, and allow the system to relax to a stationary state. The latter may be different from that obtaining prior to the perturbation. The perturbation/ relaxation protocol is repeated several times. The response to the perturbation is characterized by integrated excess B cell population in the transient state, the relaxation time of the ligand population, and the Hamming distance between the stationary B cell populations before and after the perturba-tion.
The Hamming distance saturates after several perturba-tions, which is reminiscent of the saturation of immune re-activity共e.g., specific antibody formation兲 observed experi-mentally under repeated administration of boosters. We find that in the scale-free network, the Hamming distance aver-aged over the ten largest hubs is greater than that of the first-line clones or that averaged over all clones. When the hubs are removed, we observe a much higher increase in the mean B cell population, showing that the hubs regulate the network by blocking the propagation of the disturbance.
In addition to the saturation of the response after several perturbations, our model exhibits another feature observed in immune systems. After each perturbation, there is a system-atic increase in Hamming distance, and also a reduction in the time necessary to eliminate the perturbation, both char-acteristics of immunological memory. Two configurations were used to study this particular feature: in one, only the largest hub represents a B cell clone, while in the other the ten most connected sites all represent B cell clones. The return to the stationary state is faster in the second case, suggesting that memory is associated with regulation. Simi-lar but less dramatic behavior is observed in a random net-work. Our results suggest that, in a random network, the sites with high connectivity are not essential to regulation, as they
are in regulating the scale-free network. Our results also show that the system on the scale free network has a higher sensitivity to perturbations, and a faster response, than on the random network.
The model studied here resembles a spin glass in that the interactions between pairs of B cell clones are taken ran-domly as excitatory共i.e., ferromagnetic,J⬎0兲 and suppres-sive共J⬍0兲. Thus we may expect to observe many basins of attraction, just as the spin glass possesses many free energy minima. History dependence of the system configuration is another characteristic trait of spins glasses shared by the present model. It is therefore tempting to identify the persis-tent immunological profiles observed experimentally 关36–38兴with basins of attraction共stored patterns兲of a spin-glass-like system 关39兴. Verification of this conjecture must await studies elucidating effective interactions between clones and global behavior of immune systems under pertur-bation.
In summary, our model of the B cell populations on a scale-free network reproduces several key features of the dy-namics of the immune system: regulation, saturation of re-sponse, and more rapid response upon repeated perturbations with the same agents. This suggests that, as in other biologi-cal systems, a functional network of interactions character-ized by a scale-free network may be responsible for the regu-lation and dynamics of the immune system. An alternative interpretation is that, if immune regulation is indeed struc-tured as a scale-free network, this may confer the disadvan-tage of extreme sensitivity to the loss of hubs. As is known from studies of other scale-free networks, such systems are quite robust to random attack, but highly susceptible to at-tacks directed at the principal hubs.
ACKNOWLEDGMENTS
We are grateful to CNPq and Fapemig, Brazil, for finan-cial support共Grant No. 30.5043/2003-0 to N. Vaz兲.
关1兴B. Stockinger, G. Kassiotis, and C. Bourgeois, Curr. Opin. Immunol. 16, 775共2004兲.
关2兴S. Sakaguchi, Nat. Immun. 6, 345共2005兲.
关3兴A. M. C. Faria and H. L. Weiner, Immunol. Rev. 206, 232 共2005兲.
关4兴R. Duchmann, E. Schmitt, P. Knolle, K. H. M. zumBuschen-felde, and M. Neurath, Eur. J. Immunol. 26, 934共1996兲. 关5兴A. Coutinho, Int. J. Dev. Biol. 49, 131共2005兲.
关6兴F. M. Burnet,The Clonal Selection Theory of Acquired Immu-nity共Cambridge University Press, Cambridge, 1959兲. 关7兴A. Coutinho, M. D. Kazatchkine, and S. Avrameas, Curr. Opin.
Immunol. 7, 812共1995兲.
关8兴D. Stahl, S. Lacroix-Desmazes, L. Mouthon, S. V. Kaveri, and M. D. Kazatchkine, J. Immunol. Methods 240, 1共2000兲. 关9兴D. J. Marks, N. A. Mitchison, A. W. Segal, and J. Sieper, Curr.
Top. Microbiol. Immunol. 305, 105共2006兲.
关10兴J. Sun, D. J. Earl, and M. W. Deem, Phys. Rev. Lett. 95, 148104共2005兲.
关11兴Z. A. Nagy, P. V. Lehmann, F. Falcioni, S. Muller, and L.
Adorini, Immunol. Today 10, 132共1989兲.
关12兴J. Bayry, S. Lacroix-Desmazes, M. D. Kazatchkine, O. Her-mine, D. F. Tough, and S. V. Kaveri, J. Immunol. 175, 15 共2005兲.
关13兴J. Bayry, S. Lacroix-Desmazes, V. Donkova-Petrini, C. Car-bonneil, N. Misra, Y. Lepelletier, S. Delignat, S. Varambally, E. Oksenhendler, Y. Levy, M. Debre, M. D. Kazatchkine, O. Hermine, and S. V. Kaveri, Proc. Natl. Acad. Sci. U.S.A. 101, 14210共2004兲.
关14兴N. M. Vaz and A. M. C. Faria, Cienc. Cult. 42, 430共1990兲. 关15兴N. K. Jerne, Ann. Immunol.共Paris兲 125C, 373共1974兲. 关16兴N. M. Vaz and F. J. Varela, Med. Hypotheses 4, 231共1978兲. 关17兴A. S. Perelson and G. Weisbuch, Rev. Mod. Phys. 69, 1219
共1997兲.
关18兴A. T. Bernardes and R. M. dos Santos, J. Theor. Biol. 186, 173 共1997兲.
关22兴J. Stewart and F. J. Varela, J. Theor. Biol. 153, 477共1991兲. 关23兴A. L. Barabasi and R. Albert, Science 286, 509共1999兲. 关24兴R. Albert, H. Jeong, and A. L. Barabasi, Nature共London兲 406,
378共2000兲.
关25兴R. Vasconcellos, A. Nobrega, M. Haury, A. C. Viale, and A. Coutinho, Eur. J. Immunol. 28, 1104共1998兲.
关26兴H. Lemke, A. Coutinho, and H. Lange, Mod. Trends Immunol.
25, 180共2004兲.
关27兴F. J. Varela and A. Coutinho, Immunol. Today 125, 159 共1991兲.
关28兴I. R. Cohen, Immunol. Today 1312, 490共1992兲.
关29兴R. H. Schwartz, inFundamental Immunology, edited by W. E. Paul共New York, 1984兲p. 379.
关30兴P. J. Bjorkman, M. A. Saper, B. Samraoui, W. S. Bennett, J. L. Strominger, and D. C. Wiley, Nature 共London兲 329, 512 共1987兲.
关31兴S. Buus, A. Sette, and H. M. Grey, Science 235, 1353共1987兲. 关32兴R. Cohen, K. Erez, D. ben-Avraham, and S. Havlin, Phys. Rev.
Lett. 86, 3682共2001兲.
关33兴R. Cohen, K. Erez, D. ben-Avraham, and S. Havlin, Phys. Rev. Lett. 85, 4626共2000兲.
关34兴S. N. Dorogovtsev and J. F. F Mendes, Phys. Rev. Lett. 87, 219801共2001兲.
关35兴B. A. Verdolin, S. M. Ficker, A. M. C. Faria, N. M. Vaz, and C. R. Carvalho, Braz. J. Med. Biol. Res. 34, 211共2001兲. 关36兴L. Mouthon, A. Nobrega, N. Nicolas, S. V. Kaveri, C. Barreau,
A. Coutinho, and M. D. Kazatchkine, Proc. Natl. Acad. Sci. U.S.A. 92, 3839共1995兲.
关37兴L. Mouthon, M. Haury, S. LacroixDesmazes, C. Barreau, A.
Coutinho, and M. D. Kazatchkine, J. Immunol. 154, 5769
共1995兲.
关38兴S. Lacroix-Desmazes, L. Mouthon, S. V. Kaveri, M. D. Kaza-tchkine, and M. E. Weksler, J. Clin. Immunol. 19, 26共1999兲. 关39兴M. W. Deem and H. Y. Lee, Phys. Rev. Lett. 91, 068101