Volume 28 (2003) número 2
www.scielo.br/eq
Characteristics of pyridine adsorption on Au(111) and Au(210)
by EIS parameters fitting procedure
A. de J. Motheo1,*, R. M. P. Saldanha1, R. de S. Neves1, E. de Robertis1; A.Sadkowski2
1* Instituto de Química de São Carlos - Universidade de São Paulo – CEP 13566-590 – São Carlos SP - Brasil 2 Institute of Physical Chemistry of the Polish Academy of Science - Kasprzaka 44/52 - 01-224 – Warsaw - Poland
Abstract: Some aspects of the application of electrochemical impedance spectroscopy to studies of solid electrode / solution interface, in the absence of faradaic processes, are analysed. In order to perform this analysis, gold electrodes with (111) and (210) crystallographic orientations in an aqueous solution containing 10 mmol dm-3KF, as supporting electrolyte, and a pyridine concentration varying from 0.01
to 4.6 mmol dm-3, were used. The experimental data was analysed by using EQUIVCRT software, which
utilises non-linear least squares routines, attributing to the solid electrode / solution interface behaviour described by an equivalent circuit with a resistance in series with a constant phase element. The results of this fitting procedure were analysed by the dependence on the electrode potential on two parameters: the pre-exponential factor, Y0, and the exponent nf, related with the phase angle shift. By this analysis it was possible to observe that the pyridine adsorption is strongly affected by the crystallographic orientation of the electrode surface and that the extent of deviation from ideal capacitive behaviour is mainly of interfacial origin.
Keywords: Pyridine; Gold; Electrochemical Immittance Spectroscopy; Frequency Dispersion; Double Layer Capacitance.
Introduction
In electrochemical impedance spectroscopy studies of electrochemical interfaces at solid electrodes, in the absence of faradaic processes, the major discussion has been due to the dependence of the interfacial capacitance on the alternated signal frequency, which is commonly called capacitance dispersion. These discussions are very important in order to understand the nature of the interfacial phenomena as well as to result in the correct analysis and interpretation of the impedance spectra.
The capacitance dispersion was first reported by Grahame in 1946 [8] for mercury /
KNO3 aqueous solution containing octyl alcohol. Six years later, Melik-Gaikazyan [24] published a more detailed study of this dispersion on mercury / n-amyl alcohol aqueous solution interface. Both authors observed an increase in the measured capacity with the decrease of the alternated potential frequency for specific potential regions where the degree of the surface coverage (q) varies rapidly with the electrode charge (adsorption/ desorption peaks of the capacity curves).
At solid metal / electrolyte interfaces, in the absence of organic species in solution without faradaic processes, alternating current impedance measurements display a frequency dispersion consisting of the apparent interdependence of the
Ecl. Quím., São Paulo, 28(2): 29-40, 2003
imaginary component, Zj, and the corresponding real component, Zr. This sort of dispersion results in a linear impedance diagram which intercepts the Zr axis at an angle lower than 90° [2,4], the value characteristic for the capacitance of ideally polarisable interfaces. In this case, the frequency dispersion has been commonly attributed to a non-uniform distribution of the electric charge, and consequently, also of the current density, due to the roughness and heterogeneity of the solid electrode surface [25]. The nature of this behaviour was discussed in terms of two distinct factors [26,27,29,30]. One is the coupling between the local resistance of the electrolyte close to the double layer with the local capacitance of the double layer, considering that at least one of these is non-uniformly distributed along the surface. The second factor is the dispersion of purely interfacial origin related to properties of the double layer itself.
In order to extract more information about the phase angle shift observed in spectroscopic impedance measurements, in the present work we used pyridine as a “probe molecule”. The pyridine molecule was chosen due to the extensive studies with different electrochemical (cyclic voltammetry, chronocoulometry and AC impedance) [6,22,31,32-36] and optical [1,5,7,18-19,22,28,37] techniques. Usually, the studies aimed at determining the adsorption parameters of organic compounds on solid electrodes are performed with the AC impedance technique at a fixed frequency of the alternated signal (AC voltammetry) [12-14,22,34,36]. However, as clearly noted by Lipkowski and co-workers [22,31,34-36], these capacitance measurements are only useful to determine the values of the potential of zero charge (pzc) due to the dependence of the capacitance on the frequency of the alternated potential applied.
To determine the influence of the surface structure on the capacitance dispersion, gold single crystal electrodes with crystallographic orientation (111) and (210) were used [26,27,30]. The Au(111) is the most closely packed face with the highest relative surface energy (g(hkl) / g(210)) [21] and Au(210) has the most negative potential of zero charge with a very rough structure on an atomic scale. So, attributing the capacitance dispersion only to the roughness on an atomic scale it would be reasonable to expect the following trend for the capacitance dispersion: Au(111) < Au (210).
The aim of the present work is to report the dependence of the phase angle shift with the crystallographic orientation of gold single crystal electrodes in the presence of different concentrations of pyridine. A comparison of the results for Au(111) and Au(210) faces can be expected to contribute to a better understanding of the relation between surface properties and the interfacial phenomena, which seems to be the origin of the capacitance dispersion in the double layer region.
Experimental
The preparation of the gold single crystals, experimental conditions and set-up have been described elsewhere [26,27]. The pyridine was distilled in small portions just before use and potassium fluoride (Merck suprapur) was used as supporting electrolyte as received. The pyridine solutions were prepared by dilution by using ultra pure water from a Milli-Q system (Millipore) with the following concentrations: 0.010, 0.022, 0.046, 0.1, 0.215, 0.464, 1.0, 2.15, 4.64 mmol dm-3. A
commercial saturated calomel reference electrode was kept in a separate compartment in the cell, connected with the main compartment by a salt bridge filled with the supporting electrolyte solution under study.
Prior to the impedance spectra measurements the standard cyclic voltammetry tests were performed to assure the cleanliness of the electrode and the reproducibility of its state. Each sequence of measurements was performed using freshly cleaned and flame-annealed gold electrodes. All the experiments were repeated twice to be certain of their reproducibility. All experiments were carried out at room temperature i.e. 25 ± 2 °C.
The impedance measurements were carried out in the frequency range of 10 Hz to 10 kHz at distinct potentials starting at –0.85 V vs. SCE and advancing to positive potentials by using an Autolab potentiostat model PGSTAT20 (ECOCHEMIE) equipped with a frequency response analyser module.
Results and Discussion
Cyclic Voltammetry
The cyclic voltammetry (CVs) for Au(111) and Au(210) recorded in 10 mmol dm-3
KF aqueous solution at 50 mV s-1 are presented in
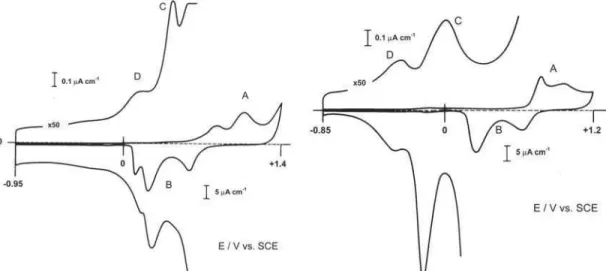
Figs. 1 and 2, respectively. For both orientations, the shape of the CVs in the gold oxidation region is characteristic for neutral medium without stirring and they are in good agreement with those presented in the literature [34,36].
Region A of both CVs is related to the oxidation of the metallic surface. The difference between the two crystallographic orientations at this potential region is related to different structural properties, resulting in different reaction sites [11,15,16]. The same behaviour is observed for region B, which is related to the reduction of the metal, where the neutrality of the media contributes to a better separation of the peaks.
The enlarged CVs showed in Figures 1 and 2 correspond to the electrical double layer potential region. In Fig. 1, peak C is the current response to the reconstruction phenomenon for Au(111) surfaces, from the 1x23 structure to the hexagonal one [20], while peak D is due to solvent dipole reorientation
near the pzc. In Fig. 2, no transitions on the surface are observed, since Au(210) does not undergoe superficial reconstruction. So, in this case, both peaks C and D are related to solvent dipole reorientation near to the pzc.
The observation of these features is important because they represent an evidence of the cleanness of the experimental system and of the good quality of the single crystals used.
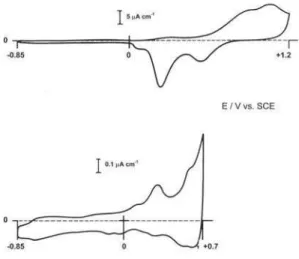
The influence of pyridine in the CVs can be observed by the example shown in Figs. 3 and 4 for Au(111) and Au(210), respectively, in contact with 1 mmol dm-3 pyridine solution. As already
observed by Stolberg et al. [34], for Au(111) the most important feature in the double layer region of the CV is the occurrence of a peak that for a pyridine concentration of 1 mmol dm-3 occurs at
around 0.3 V. When pyridine concentration increases this peak shifts to less positive values and may be associated to a bi-dimensional phase transition in the pyridine monolayer [35]. At higher
pyridine concentration the CVs present a peak at 0.05 V, preceded, in both directions of the potential sweep, by a broad peak of low magnitude. Additionally, at positive potential values (> 0.4 V), an extra peak occurs with the magnitude ca. four times superior than that of the preceding peak. Figure 1. Cyclic voltammogram of gold (111) in 10 mmol dm-3
potassium fluoride at 50 mV s-1. Double layer region enlarged
50 times.
Figure 2. Cyclic voltammogram of gold (210) in 10 mmol dm-3
potassium fluoride at 50 mV s-1. Double layer region enlarged 50
Ecl. Quím., São Paulo, 28(2): 29-40, 2003
Figure 3. (a) Cyclic voltammogram of gold (111) in an aqueous solution composed by 10 mmol dm-3 potassium fluoride and
1mmol dm-3 pyridine. (b) Double layer region enlarged 50 times.
Scan rate of 50 mV s-1.
Figure 4. (a) Cyclic voltammogram of gold (210) in an aqueous solution composed by 10 mmol dm-3 potassium fluoride and
1mmol dm-3 pyridine. (b) Double layer region enlarged 50 times.
Scan rate of 50 mV s-1.
For Au(210), the effect of pyridine in the CVs, as exemplified in Fig. 4, is mainly observed by the changes in the potential region corresponding to gold oxidation [34]. In the expanded scale, the changes are significant and one
can observe the occurrence of two pairs of peaks close to the negative potential limit. For a pyridine concentration of 1 mmol dm-3 (Fig. 4) the first pair,
with relatively small current, occurs around –0.55 V and it is followed, at approximately –0.65 V, by another pair of narrow peaks of larger magnitude. Between –0.4 and –0.1 V the magnitude of the current density decreases due to the adsorption of pyridine on the electrode surface. From –0.1 V, in the positive direction, the current density increases with the occurrence of a broad peak. When the pyridine concentration increases, the two pair of peaks, observed close to the negative potential limit, shift to more negative values of the potential and increase. However, for pyridine concentrations higher than 1 mmol dm-3 the increase of the peaks
is not significant. On the other hand, the current depression region increases in terms of potential range, that, in the case of 10 mmol dm-3 of pyridine,
is around 400 mV.
For both (111) and (210) systems one can observe that the pyridine concentration has an effect both in the potential range where no faradaic process occurs (double layer region) and in the ranges corresponding to the occurrence of such processes. For potential values lower than –0.8 V the hydrogen evolution reaction takes place, however, in the presence of pyridine, this limit is displaced to more negative values. In the absence of pyridine the formation of superficial gold oxides occurs at potentials greater than 0.6 V. However, when pyridine is added to the solution, faradaic processes occur at less positive potentials. Thus, the potential window was established for the AC impedance measurements with the value of –0.85 V for the negative potential limit and the value of 0.6 V and 0.4 V for Au (111) and Au(210) respectively, as positive limits.
AC Impedance
The AC impedance data were analysed by using the EQUIVCRT software3 to fit the
parameters of the equivalent circuit, composed of a resistance in series with a constant phase element (CPE), to the experimental data.
YCPE(w) = Y0(iw)n (1)
where Y0 is the pre-exponential factor, an analogue of the double layer capacitance (Cdl) of ideally polarisable electrodes; nf – the dimensionless parameter with values commonly between 0.5 and 1.0 (fractional exponent, fractality factor24); w = 2πf
– the angular frequency (rad –1); f – the frequency
(Hz) of the harmonic wave; i = (-1)1/2.
The complete electrode impedance in this case is represented by the formula:
Z(w) = Rs + 1/YCPE(w) (2) where Rs is the solution resistance and YCPE(w) is given by Eq. (1).
By using the EQUIVCRT software, for each value of the dc potential, the values of Rs, Y0, nf and c2 were obtained. The fitting quality was
evaluated by the c2 test [24]. For the data obtained
in the presence of pyridine, the analysis of c2 values
showed that the fitting quality was better for Au(111) than for the Au(210) electrode. The lowest values of c2 were observed in both cases in the
potential region corresponding to the pyridine adsorption with values around 5 x 10⁻⁶ for Au(111)
and 1 x 10⁻⁵ for Au(210). On the other hand, in the
potential regions corresponding to significant nf variations the value of c2 increased, i.e., the fitting
quality decreased up to values around 1 x 10⁻³ for
Au(111) and 5 x 10⁻³ for Au(210). However, for
all practical proposes, the mean fitting quality can be considered enough to validate the use of the CPE in the modelling of the electrical properties of the interfaces under investigation.
Additionally, any attempt to substitute the CPE, strictly in the double layer region, by a capacitor or to add to the circuit other elements, such as a Warburg impedance, resulted in a decrease of at least one order of magnitude in the fitting quality.
The Pre-exponential Factor, Y0
The factor Y0 as defined in Eq. (1), is related, still is a not quite defined manner, to the electrical capacitance of the electrode-solution interface. Thus, in the present section the characteristics of the dependence of Y0 with the potential are qualitatively compared with the
so-called capacitance curves commonly presented in the literature.
Au(111)
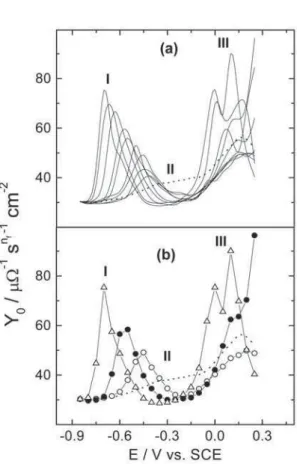
Figure 5. Dependence of the parameter Y0 with the potential applied to gold (111) in aqueous solution containing 10 mmol dm-3 potassium fluoride and pyridine (a) for concentrations
varying from 0.01 to 4.6 mmol dm-3; (b) for the concentrations:
(¡) 0.01; (n) 0.1; (∆) 1.0 mmol dm-3. The dashed curve
corresponds to the base electrolyte solution.
Ecl. Quím., São Paulo, 28(2): 29-40, 2003
position in the potential axis has a logarithmic dependence on the pyridine concentration.
In the positive region (III), the peak occurring between –0.1 and 0.3 V has a peculiar characteristic that for higher concentrations, it splits into two peaks. The single peak was attributed, by Stolberg et al. [34], as a bidimensional phase transition that occurs between two states of the film formed by adsorbed pyridine molecules. Finally, in the region II, the value of the Y0 presents a drastic depression (analogue to the “capacitance pit”) characteristic for the strong adsorption of organic species. This depression increases with the pyridine concentration while its medium point shifts to more negative potential values.
For all pyridine concentrations, at potentials more negative than –0.85 V, the Y0 curves reach approximately the same value showed by the supporting electrolyte solution. This behaviour suggests that, in this potential region, the pyridine molecules are completely desorbed from the electrode surface.
Differential capacitance curves obtained at a single frequency for Au(111) in the presence of pyridine were reported in the literature by Hamelin et al. [9,10] and Stolberg et al. [34]. The supporting electrolyte used in the two first studies was 0.2 M K2SO4 and in the last, 0.1 M KClO4. In these studies it was observed that the capacitance peak, which occurs at negative potential values (region I), shifts in the negative direction with the increase of pyridine concentration, which is in agreement with the behaviour observed in Fig. 5.
However, Hamelin [11] reported that the position of the second peak (III) is not sensitive to the variation of pyridine concentration while Stolberg et al. [32] observed that this peak shifts to the negative direction when the pyridine concentration increases. This difference was related to the effect of the anion in the pyridine adsorption on the Au(111) surface [34]. In the present work, one can observe that for concentrations up to 0.46 mmol dm-3, the position of this peak (III) is
independent of the pyridine concentration in the bulk solution, however, for higher concentrations, two distinct peaks appear. So, the assertion of Stolberg et al. [34] that the difference is due to the different anions of supporting electrolyte does not seem to be supported at this moment.
Au(210)
Figure 6. Dependence of the parameter Y0 with the potential
applied to gold (210) in aqueous solution containing 10 mM potassium fluoride and pyridine (a) for concentrations varying from 0.01 to 4.6 mM; (b) for the concentrations: (¡) 0.01; (n) 0.1; (F); 0.46 mM; (∆) 1.0 mM. The dashed curve
corresponds to the base electrolyte solution.
In the Fig. 6a, the dependence of the pre-exponential factor on the applied potential is shown for Au(210) in the presence of the different concentrations of pyridine used and in Fig. 6b for three selected concentrations.
for 40 mmol dm-3 NaF11, that is closer to the value
obtained in the present work using 10 mmol dm-3
KF as supporting electrolyte. So, the differences observed for the minimum values due to the diffuse layer can be attributed to the differences of nature and concentration of the supporting electrolyte used in the different studies.
When pyridine is added to the solution, the Y0 curves show a sharp peak at negative potential values (region I). The magnitude of this peak increases and the peak shifts in the negative direction of potential when the pyridine concentration increases. The characteristics of this peak are related to the adsorption/desorption process of pyridine on the electrode surface.
For pyridine concentrations up to 0.46 mmol dm-3 and potential values more negative than
–0.85 V, the Y0 curves are coincident with the curve corresponding to the supporting electrolyte solution, as observed for Au (111). This behaviour is classically interpreted as the situation where only the supporting electrolyte species are present in the inner layer of the electrical double layer, i.e., the pyridine molecules must be completely desorbed from the electrode surface.
When the pyridine concentration is higher than 0.46 mmol dm-3 the molecule
desorption occurs simultaneously with the hydrogen evolution and so, further analysis of the electrical double layer is restricted to the low pyridine concentrations.
In the region II of the curves, the value of Y0 decreases to very low values, apparently tending to be only slightly dependent on the pyridine concentration. Continuing to more positive potentials (region III), a peak, which decreases with the increase of pyridine concentration, appears. These peaks are observed for the supporting electrolyte and are related to dipole solvent reorientations on the electrode surface. So, adsorbed pyridine, by substituting dipole solvents on the surface, promotes a decrease in the intensity of such peak.
The exponent nf
The value of nf is related to the phase angle observed during the AC impedance measurement. As mentioned before, this parameter has been
attributed mainly to the non-uniformity of the current density at the electrode surface due to its roughness and heterogeneity. Additionally, taking into account more recent analysis [26,27,30], it can allow for other characteristics due to the reorientation of dipoles adsorbed on the electrode surface as well as changes in the region of the diffuse layer. The broken lines on plots present the tentative limit of nf = 0.98, which we suggest [27] as the limiting value for considering the interface as close to ideally polarisable and identifying the pre-exponential factor Y0 with the double layer capacitance.
Au(111)
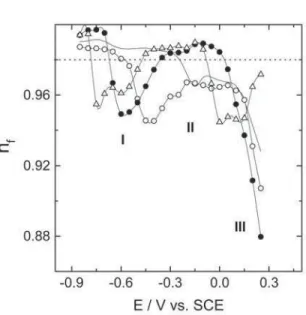
Figure 7. CPE exponent versus potential plots for gold (111) in aqueous solution containing 10 mmol dm-3 potassium fluoride
and pyridine: (¡) 0.046; (n) 0.464; (∆) 4.64 mmol dm-3. The
continuous curve corresponds to the base electrolyte solution and the dashed line corresponds to nf = 0.98.
Ecl. Quím., São Paulo, 28(2): 29-40, 2003
dm-3; for higher concentrations, the n
f values
increase with the bulk concentration. This variation can be considered as small compared to the mean value of 0.94 ± 0.01. Around -0.3 V the value of nf tends to unity when the bulk concentration increases with a mean value of 0.982 ± 0.07. The difference between this two mean values (regions I and II) is 0.04 and it can be considered as a characteristic value of the pyridine adsorption on Au(111) surface.
In the region III of the plot, the value of nf decreases almost independently of the pyridine concentration and it is possible to observe that nf presents very particular variations for the concentrations 1.0 and 2.15 mmol dm-3. The
characteristics of this behaviour will be taken into account in the following discussions.
Au(210)
Figure 8. CPE exponent versus potential plots for gold (210) in aqueous solution containing 10 mmol dm-3 potassium
fluoride and pyridine: (¡) 0.046; (n) 0.464; (∆) 4.64 mmol
dm-3. The continuous curve corresponds to the base electrolyte
solution and the dashed line corresponds to nf = 0.98.
In Fig. 8, the dependence of nf on the applied potential is exemplified for selected pyridine concentrations. The peaks at negative potentials (region I) referring to the different pyridine concentrations have almost the same magnitude, shifting to more negative potential values and changing their relative magnitudes when
the pyridine concentration increases. The mean value of nf obtained for these two peaks was 0.86 ± 0.07. On the other hand, the peak at more positive potentials (region III) increases with the increase of pyridine concentration, reaching values close to those observed for region I when the pyridine concentration is around 4.6 mmol dm-3. In the
region II, the value of nf increases with the pyridine concentration, reaching a value equal to 0.897 for 4.6 mmol dm-3.
The difference between the minima on nf in region I and the maximum in the regions II is c.a. 0.13, which is approximately 3.5 bigger than the difference observed in the case of Au(111). Considering that both electrodes were prepared in the same way, it can be assumed that they don’t present significant differences in the macroscopic roughness and so, one can conclude that the difference is mainly due to the crystallographic orientation. If one considers that nf < 1.0 is related strictly to the roughness and heterogeneity at atomic scale and to the relative superficial energy, it seems reasonable to expect that the value of nf for Au(111) will be higher than for Au(210). This supposition is in agreement with previous observations where the influence of the crystallographic orientation in perchloric acid [24] and KF [30] media, where nf was proposed as follows (100) < (111) < (110) < (210). So, at this point, it can be concluded that the pyridine adsorption on gold single crystal surfaces is strongly dependent on the microscopic roughness and the work function of the electrode crystallographic orientation, as observed by Lipkowski and co-workers [22,31,34-36]. The crystallographic orientations used in the present work can be considered as representative of limiting situations. The orientation (111) is the one where the gold atoms are most densely packed whereas mainly steps and terraces form the orientation (210) and so, this last orientation is much rougher and non-uniform on a microscopic scale.
Comparison between Y0 and n
vs. E for both crystallographic orientations in order to relate the variations on nfwith the adsorption proprieties of pyridine.
Au(111)
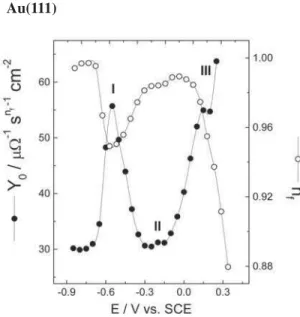
Figure 9. Electrode potential dependence of CPE parameters for Au(111) in 10 mmol dm-3 KF and 0.46 mmol dm-3 pyridine
aqueous solution.
In Fig. 9 the comparison of Y0 and nf dependence on potential for this crystallographic orientation is exemplified for the 0.464 mmol dm-3
pyridine concentration. One can observe that in general a significant increase on Y0 corresponds to a decrease of the nf value. The peak in the Y0 curve occurring at region I was attributed to an adsorption-desorption process of pyridine on the electrode surface [34]. This peak shifts to more negative potentials and increases in magnitude when pyridine concentration increases. A peak in the nf plots corresponds exactly to this Y0 variation also shifting to more negative potentials and decreasing in magnitude when the pyridine concentration increases. Assuming that at this potential region (I) the pyridine molecule desorbs, the electrical double layer capacitance increases due to an increase in the dielectric constant. It means that when the molecules desorb from the electrode surface the pyridine dipoles change from a highly oriented state on the electrode surface to a state with higher a level of entropy. This means that the variation of nf at this potential range corresponds to a phenomena related
to the inner layer properties, and so, the minimum in the nf reflects the non-ideality (CPE dispersion) of the inner layer.
The second peak in the Y0 plot (region III), which corresponds to a bidimensional phase transition between two states of the film formed by adsorbed pyridine molecules [34], doesn’t have a specific correspondence in the nf plot except for high pyridine concentrations when a small shoulder occurs in the curve.
In region II nf tends to unity and Y0 presents the smallest values. This situation corresponds to pyridine adsorption with the dipoles strongly oriented and packed on the electrode surface. Close to the surface saturation the arrangement on the surface is close to the ideal packing and nf is close to unity, indicating once more the influence of the inner layer properties in the nature of the nf variation. However, when the pyridine concentration increases the potential range where Y0 curve presents a depression increases but the range where nf is maximum decreases. This shows that nf is also sensitive to the variation between adsorption states of the pyridine however, it is a gradual variation of the dipole moments and so, the plot of nf doesn’t present a sharp variation.
Au(210)
Figure 10. Electrode potential dependence of CPE parameters for Au(210) in 10 mmol dm-3 KF and 0.46 mmol dm-3 pyridine
Ecl. Quím., São Paulo, 28(2): 29-40, 2003
As before, only the curves corresponding to the 0.46 mmol dm-3 pyridine concentration will
be used to illustrate the correspondence between nf and Y0 (Fig. 10). Taking this case as an example, the region I of the Y0 plot shows a small shoulder close to the negative limit of the main (well-defined) peak, while in the same region in the nf plot two distinct peaks occur. In this potential range, the CVs (Fig. 4) present two peaks, one of them very sharp. Yang et al. [36] suggested for the same potential range a phase transition due to the reorientation of the pyridine molecules on the electrode surface. However, Yang et al. did not explain the occurrence of the two distinct peaks. This behaviour permits the conclusion that the superficial composition of this face, composed by steps and terraces with (110) and (100) orientations [18], interferes in the reorientation of the adsorbed pyridine dipoles on the electrode, with pyridine adsorbed at different sites undergoing reorientations in different potentials. Such behavior could be better observed on nf vs. E plots.
Due to the different energetic conditions of the orientations, the reorientation-desorption process doesn’t present the same behaviour observed before for Au(111). This could explain the occurrence of a broad peak of low values of nf which becomes more defined when the pyridine concentration increases.
In region III, the peak of Y0 doesn’t depend significantly on the pyridine concentration and it always presents values lower than those for the peak occurring in region I. However, the value of nf increases with the pyridine concentration reaching values of the same order of those at negative potentials. Supposing that the pyridine dipole array on the electrode surface is more packed in region III than in region I, it is possible to suggest the occurrence of a reorientation process of the molecules on the electrode surface with a consequent increase of the superficial concentration. Additionally, this could decrease the interfacial capacitance when the potential is varied to more negative values. This supposition is not in agreement with Yang et al.[36] that in this region the films formed by pyridine molecules are less densely packed and the reorientation of the molecule as well as the co adsorption of the
anion from the supporting electrolyte were involved.
Thus for Au(210) two distinct changes could occur in the pyridine dipole orientation: the first, at positive potentials, where pyridine molecule adsorbed parallel to the surface suffers a reorientation to the perpendicular position increasing the number of free sites on the surface and permitting the continuation of the adsorption process; the second, the inverse process occurs i.e. the dipoles in the perpendicular position relative to the electrode surface change to parallel, followed by a desorption step which has a strong influence of the structural composition of the single crystal.
The main difference between the results of the present work and those presented by Yang et al. [36], in the positive potential region would be the influence of the anion present in the solution. The perchlorate anion may present a co adsorption bigger than fluoride and so, in the present case, a bigger contribution to the molecule reorientation could result in the increase of interfacial capacitance with the increase of the pyridine concentration.
Conclusions
By using an organic molecule with, well established adsorption characteristics, such as pyridine, it is possible to propose an interpretation for the behaviour observed for impedance data with respect to the capacitance dispersion.
values closer to the unity. Some dependency of the capacitance dispersion on the concentration of the organic specie in the solution bulk was observed, mainly at the Au(210) surface in dilute solutions. In these cases, nf tends to assume higher values, but not so close to unity, which makes ideal capacitor modelling unsatisfactory.
These observations indicate that, for the systems in question, the capacitance dispersion can’t be attributed only to superficial characteristics, but also to the solution properties, that collaborate with interfacial properties, have to
be considered in models that account for this kind of phenomena.
Acknowledgements
This work was supported by the Fundação de Amparo á Pesquisa do Estado de São Paulo (FAPESP), Brazil (Process n°96/3504-2). The authors also acknowledge the Conselho Nacional de Desenvolvimento Científico e Tecnológico (CNPq), Brazil, for their individual research grant and to Geoffroy R. P. Malpass for the language revision.
A. de J. Motheo, R. M. P. Saldanha, R. de S. Neves, E. de Robertis, A.Sadkowski. Características da adsorção de piridina sobre Au(111) e Au(210) estudadas por ajustes dos parâmetros de EIE.
Resumo: Neste trabalho são analisados alguns aspectos da aplicação da espectroscopia de impedância eletroquímica a estudos em interfaces eletrodo sólido/solução, na ausência de processos faradaicos. Para tanto foram utilizados foram utilizados eletrodos monocristalinos de ouro nas orientações cristalográficas (111) e (210) em contato com soluções aquosas contendo KF 10 mmol dm-3, como eletrólito suporte, e
piridina em concentrações que variaram entre 0,01 e 4,6 mmol dm-3. Os resultados experimentais foram
modelados com a utilização do programa EQUIVCRT, que utiliza métodos de mínimos quadrados não lineares, com a representação da região interfacial a partir de um circuito elétrico equivalente constituído de um resistor ligado em série a um elemento de fase constante. Os resultados obtidos através da modelagem foram então analisados em função da dependência dos parâmetros Y0 e nf, referentes ao elemento de fase constante, com o potencial no eletrodo, Foi observado que a adsorção da piridina é afetada de maneira significante pela orientação cristalográfica da superfície do eletrodo e que o grau de desvio do comportamento puramente capacitivo é preponderantemente de origem interfacial
Palavras-chave: piridina; ouro; Espectroscopia de Imitância Eletroquímica; dispersão de freqüência; capacitância da dupla camada elétrica.
References
[1] G. Andreasen, M. E. Vela, R. C. Salvareza, A. J. ArviA. Langmuir 13 (1997) 6851.
[2] R. D. Armstrong, T. Dickison, P. M. Willis. J. Electroanal. Chem. 53 (1974) 389.
[3] B. A. Boukamp. Equivalent circuit, University of Twente, 1989.
[4] G. J. Brug, A. L. G. Van Den Eeden, M. Sluytersrehbach, J. H. Sluyters. J. Electroanal. Chem. 176 (1984) 275. [5] W. B. Cai, L. J. Wan, H. Noda, Y. Hibino, K. Ataka, M. Osawa.Langmuir 14 (1998) 6992.
[6] I. O. Efimov, K. E. Heusler. J. Electroanal. Chem. 414 (1996) 75.
[7] M. Fumata, D. Diesing. Vibrational Spectroscopy 19 (1999) 187.
[8] D. C. Grahame. J. Am. Chem. Soc. 68 (1946) 301.
[9] A. Hamelin, G., C. R. Valette. Acad. Sci. Ser. C267 (1968) 127.
[10] A. Hamelin. J. Electroanal. Chem. 144 (1983) 365. [11] A. Hamelin. In: Conway, B. E.; White, R. E.; Bockris, J.O’M. Modern aspects of electrochemistry. New York: Plenum, 1985.
[12] A. Hamelin, S. Morin, J. Richer, J. Lipkowski. J. Electroanal. Chem. 272 (1989) 241.
[13] A. Hamelin, S. Morin, J. Richer, J. Lipkowski; J. Electroanal. Chem. 285 (1990) 249.
[14] A. Hamelin, S. Morin, J. Richer, J. Lipkowski. J. Electroanal. Chem. v.304, (1991) 195.
[15] A. Hamelin. J .Electroanal. Chem. 407 (1996) 1. [16] A. Hamelin. J. Electroanal. Chem. 407 (1996) 13. [17] F.Henglein, J. Lipkowski, D. M. Kolb. J. Electroanal. Chem. 303 (1991) 245.
Ecl. Quím., São Paulo, 28(2): 29-40, 2003 [19] Y. Ikezawa, T. Sawatwri, T. Kitazume, H. Goto, K. Toriba.
Electrochim. Acta 43 (21/22)(1998) 3297. [20] D. M. Kolb. Prog. Surf. Sci. 51 (1996) 109.
[21] J. Lecoeur, J. P. Bellier, C. Koehler. Electrochim. Acta 30 (1990) 1383.
[22] J. Lipkowski, L. Stolberg, S. Morin, D. E. Irish, P. Zelenay, M. Gamboa, A. wieckowski. J. Electroanal. Chem. 355 (1993) 147.
[23] J. R. MacDonald. Impedance spectroscopy. 1 ed. New York: John Wiley & Sons, 1987.
[24] V. I. Melik-Gaikazyan. Zhur. Fiz. Khim. 26 (1952) 1184. [25] A. J Motheo, S. A. S. Machado, M. H. Van Kampen, J. R. Santos Jr. J. Braz. Chem. Soc. 4 (1993) 122.
[26] A. J. Motheo, J. R. Santos Jr, A. Sadkowski, A. Hamelin. J. Electroanal. Chem. 397 (1995) 331.
[27] A. J. Motheo, A. Sadkowski, R. S. Neves. J. Electroanal. Chem. 430 (1997) 253.
[28] N. Nanbu, F. Kitamura, T. Ohsaka, K. Tokuda. J.
Electroanal. Chem. 470 (1999) 136.
[29] T. Pajkossy. J. Electroanal. Chem. 364 (1994) 111. [30] A. Sadkowski, A. J. Motheo, R. S. Neves. J. Electroanal. Chem. 455 (1998) 107.
[31] L. Stolberg, J. Lipkowski, D. E. Irish. J. Electroanal. Chem. 238 (1987) 333.
[32] L. Stolberg, J. Lipkowski, D. E. Irish. J. Electroanal. Chem. 296 (1990) 171.
[33] L. Stolberg, J. Lipkowski, D. E. Irish. J. Electroanal. Chem. 300 (1991) 563.
[34] L. Stolberg, S. Morin, J. Lipkowski, D. E. Irish. J. Electroanal. Chem. 307 (1991) 241.
[35] L. Stolberg, J. Lipkowski, D. E. Irish. J. Electroanal. Chem. 322 (1992) 357.
[36] D. F. Yang, L. Stolberg, J. Lipkowski, D. E. Irish. J. Electroanal. Chem. 329 (1992) 259.