Research Article
Olive Oil Total Phenolic Contents and Sensory Sensations
Trends during Oven and Microwave Heating Processes and
Their Discrimination Using an Electronic Tongue
Rafaela Prata
,
1José A. Pereira
,
1Nuno Rodrigues
,
1Luís G. Dias
,
1,2Ana C. A. Veloso
,
3,4Susana Casal
,
5and António M. Peres
1,61Centro de Investigac¸˜ao de Montanha (CIMO), ESA, Instituto Polit´ecnico de Braganc¸a, Campus Sta Apol´onia, 5300-253 Braganc¸a, Portugal
2Centro de Qu´ımica-Vila Real (CQ-VR), University of Tr´as-os-Montes e Alto Douro, Apartado 1013, 5001-801 Vila Real, Portugal 3Instituto Polit´ecnico de Coimbra, ISEC, DEQB, Rua Pedro Nunes, Quinta da Nora, 3030-199 Coimbra, Portugal
4Centre of Biological Engineering (CEB), University of Minho, Campus de Gualtar, 4710-057 Braga, Portugal
5LAQV@REQUIMTE/Laborat´orio de Bromatologia e Hidrologia, Universidade do Porto, Rua de Jorge Viterbo Ferreira, 228, 4050-313 Porto, Portugal
6Laboratory of Separation and Reaction Engineering-Laboratory of Catalysis and Materials (LSRE-LCM), ESA, Instituto Polit´ecnico de Braganc¸a, Campus Sta Apol´onia, 5300-253 Braganc¸a, Portugal
Correspondence should be addressed to Ant´onio M. Peres; [email protected]
Received 29 October 2017; Revised 9 January 2018; Accepted 22 January 2018; Published 19 February 2018
Academic Editor: Amy Simonne
Copyright © 2018 Rafaela Prata et al. This is an open access article distributed under the Creative Commons Attribution License, which permits unrestricted use, distribution, and reproduction in any medium, provided the original work is properly cited.
Olive oil has unique organoleptic attributes and its consumption is associated with nutritional and health benefits, which are mainly related to its rich composition in phenolic and volatile compounds. The use of olive oil in heat-induced cooking leads to deep reduction of phenolic and volatile concentrations and to changes of the sensory profiles. This work confirmed that oven
and microwave heating significantly reduced total phenolic contents (𝑃value<0.0001, one-way ANOVA), more pronounced in the
latter, together with a significant reduction of the intensity of fruity, sweet, bitter, pungent, and green attributes (𝑃value<0.0001, Kruskal-Wallis test), particularly for fruity and green sensations. Besides, bitter, fruity, green, and pungent intensities showed a linear dependency with the total phenolic contents (0.8075 ≤ 𝑅-Pearson≤0.9694). Finally, the potentiometric electronic tongue together with linear discriminant analysis-simulated annealing algorithm allowed satisfactory discrimination (sensitivities of94 ± 4%, for repeated𝐾-fold cross-validation) of olive oils subjected to intense microwave heating (5–10 min, 160–205∘C) from those processed
under usual cooking conditions (oven heating during 15–60 min or microwave heating during 1.5–3 min, 72–165∘C). This could be
due to the different responses of the electronic tongue towards olive oils with diverse phenolic and sensory profiles.
1. Introduction
Olive oil is a key ingredient of the Mediterranean diet. Virgin olive oil is obtained from fresh olives ofOlea europaea L. species, exclusively by mechanical or other physical means. Olive oil has unique aroma and delicate flavor, whose con-sumption is associated with health and nutritional benefits [1, 2]. Although usually consumed in its crude form [2], the use of virgin olive oil in food cooking techniques is increasing worldwide [3]. However, during deep-frying, pan-frying,
boiling, roasting, grilling, microwave cooking, or baking procedures, olive oil is heated at different temperatures and during different time periods, leading to hydrolysis, oxidation, and some polymerization, which in turn leads to nutritional losses and sensory deterioration [3, 4]. These heating effects on olive oil chemical, nutritional, and biolog-ical properties have been studied under laboratorial or real cooking conditions [4–9]. As recently reviewed by Santos et al. [3], the degradation of olive oil during heat-induced procedures is a complex process from chemical and health
point of views, the implementation of reliable analytical protocols and testing methods being still required. Yet, when compared to other vegetable oils, olive oils possess good thermal resistance [3].
According to the legislation [10], the extension of the thermal degradation of vegetable oils is usually assessed based on the contents of total polar compounds or tria-cylglycerols oligomer fractions, whose formation is low in olive oils in comparison to other vegetable oils [3]. Although most of the official methods for assessing the quality of oils and fats are relatively simple, some of them are time-consuming, quite expensive, often requiring the use of toxic chemicals and solvents [11, 12]. Thus, sensor-based techniques coupled with chemometric tools, namely, electronic noses and tongues (E-noses and E-tongues, resp.), have emerged as alternative/complementary fast, cost-effective, portable, reliable, and robust approaches for olive oil chemical and sensory analysis [12, 13]. The use of these electrochemical tools has been successfully demonstrated for (i) assessing olive oils’ geographical, cultivar, chemical, and sensory (pos-itive and negative attributes) quality; (ii) detecting olive oil adulterations with other vegetable oils or with low-quality olive oils; (iii) quantifying total polyphenolic, flavonoids, and phenolic acids contents in olive oils; and (iv) monitoring olive oil quality physicochemical changes during storage [14–34].
The main aim of this work was to evaluate, for the first time, the possibility of using a homemade potentiometric E-tongue together with multivariate statistical techniques to discriminate extra virgin olive oils (EVOOs) after subjecting them to different heating cooking procedures (oven and microwave irradiation) during different time periods (from 0 min up to 10 min or 60 min for microwave and oven, resp.) and to different heating temperatures (between 140–165∘C for oven and 72–205∘C for microwave). At the same time, the heat-induced alterations on the olive oils total phenolic content and on the olive oils gustatory-retronasal positive sensory sensations were also evaluated.
2. Materials and Methods
2.1. Olive Oil Samples. Commercial olive oil samples were obtained from different producers in the “Tr´as-os-Montes” region (northeast of Portugal). In total, 12 different olive oils, with different total phenol contents (varying from 400 to 1000 mg of caffeic acid equivalents per kg of oil, quantified as described below) were evaluated, aiming to be a representative selection of the different Portuguese olive oils commercially available. Samples were withdrawn from each of the 12 olive oils, allowing to subject all of them to the different studied heating procedures (no heating or conventional electric oven and microwave heating processes) for selected heating times. Assays were performed in triplicate for each combination of heating procedure×heating time.
2.2. Heating Procedures. Subsamples from each of the 12 olive oils were taken and each one was subjected to each of the seven heat treatments plus control, allowing to eval-uate the effect of the two different heat-induced cooking processes (conventional electric oven and microwave) and
the different time periods, which were studied aiming to simulate the usual home culinary olive oil uses. Assays were carried out using olive oil samples (without any food presence), with the possible degradation effects of different heating conditions being evaluated (i.e., cooking process and time): (i) no heating (Control t0, 20∘C); (ii) heating in an oven Memmert (model UNB500, Schwabach, Germany) during 15 min (Oven t15 min, 140∘C), 30 min (Oven t30 min, 150∘C), and 60 min (Oven t60 min, 165∘C); and (iii) heating in a microwave Amstrad (model WP810, London, UK) during 1.5 min (MW t1.5 min, 72∘C), 3 min (MW t3 min, 115∘C), 5 min (MW t5 min, 160∘C), and 10 min (MW t10 min, 205∘C). The final olive oil temperatures, after each microwave heating procedure, were measured immediately after each cooking process using a solid stem thermometer Selecta (model 1090250, Barcelona, Spain). During the assays the microwave oven was used at its maximum potency (1200 W) and the electric conventional oven at 2000 W. For each olive oil, cooking process, and cooking time-period, three subsamples of 50 mL were individually heated in Petri dishes (20 mm high and 110 mm of diameter), with a total of 288 assays (12 olive oils × 8 heat treatments× 3). After being heated and cooled, all samples were stored in Falcon tubes and refrigerated.
2.3. Olive Oil Total Phenolic Content. The total phenolic contents were determined according to Capannesi et al. [37] with some modifications. A mass of 2.5 g of olive oil was diluted with n-hexane and then extracted with 2.5 mL of methanol/water (80 : 20 v/v). The mixture was then cen-trifuged (5 min at 5000 rpm). After, to 1 mL of the super-natant, 1 mL of Folin-Ciocalteau reagent, 1 mL of Na2CO3 solution (7.5%), and 7 mL of deionized water were added. After homogenization, the mixture was stored overnight and spectrophotometrically analyzed (𝜆 = 765nm). For quantification purposes, a calibration curve between the measured absorbance and the concentration of caffeic acid in methanol was established (dynamic concentration range: 0.04–0.18 mg/mL;𝑅2-Pearson≥0.996). Results were expressed as mg of caffeic acid equivalents per kg of oil.
2.4. Sensory Analysis. Unheated olive oils (Control t0 min) and olive oils heated in the oven (15, 30 and 60 min) or in the microwave (1.5, 3, 5 and 10 min) were evaluated by a sensory panel following the methods and standards adopted by the International Olive Council (IOC) for sensory analysis of olive oils, namely, COI/T.20/Doc. No 15/Rev. 6 [35] and COI/T.30/Doc. No 17 [36]. Each sample was subjected to the judgment of eight trained panelists that evaluated and assessed the perceived intensities of five gustatory-retronasal sensations using the IOC ordinal scales [35, 36], namely, fruity (0 to 10), sweet (0–4), bitter (0–3), pungent (0–3), and green (0–2).
2.5. E-Tongue Assays
Sensor array
Reference electrode
Stirrer
S3 S10 S5 S12 S1 S18
Signals in time
Olive oils’
hydroethanolic extract
Data logger as potentiometer with high impedance
134.16mV
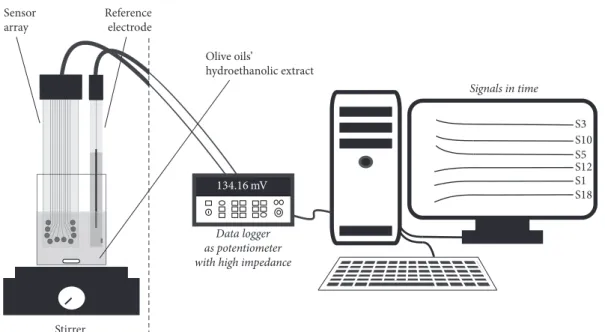
Figure 1: E-tongue setup, including homemade sensor array, data logger, and PC.
the hydroethanolic solution (H2O : EtOH, 80 : 20 v/v), using deionized water (type II) and ethanol p.a. (from Panreac, Barcelona). The mixture was left at ambient temperature during 60 min, after which 40.0 mL (2x) of the supernatant solution was carefully removed and immediately analyzed with the E-tongue multisensor device. Each olive oil was extracted in duplicate.
2.5.2. E-Tongue Setup and Analysis. The homemade E-tongue comprised 2 print-screen potentiometric arrays, each one with 20 cross-sensitivity lipid polymeric sensors, immo-bilized using a drop-by-drop technique. The 40 sensors included in the device corresponded to different mixtures of 4 additives (octadecylamine, oleyl alcohol, methyltrioctylam-monium chloride, and oleic acid; ∼3%) and 5 plasticizers (bis(1-butylpentyl) adipate, dibutyl sebacate, 2-nitrooctylether, tris(2-ethylhexyl)phosphate, and dioctyl phenyl-phosphonate;∼65%), plus high molecular weight polyvinyl chloride (PVC;∼32%) [20]. The lipid polymeric membranes were used since they show qualitative and quantitative potentiometric signal responses towards solutions mimick-ing positive attributes (e.g., bitter, fruity, green, and pungent sensations) and negative attributes (rancid, winey-vinegary, fusty, and musty defects) usually perceived in olive oils [24–26, 34] and basic taste sensations (bitter, sweet, acid, salty, and umami) [38, 39]. Indeed, the lipid polymeric sensor membranes contain hydrophobic and hydrophilic groups that interact with taste substances via electrostatic or hydrophobic interactions [40]. Each sensor is identified by a letter S (for sensor) followed by a code for the sensor array (1: or 2:) and the number of the membrane (1 to 20, corresponding to different combinations of additive and plasticizer compounds). In Figure 1, the E-tongue setup used is shown, which included two print-screen arrays with 10 nonspecific cross-sensitivity lipid membranes in each
face of the array (only one array shown), a data logger equipment (Agilent Data Acquisition Switch Unit model 34970A) used to record the potentiometric signal differences between each E-tongue sensor and the Ag/AgCl reference electrode (Metrohm Ag/AgCl double junction with SGG sleeve), and a PC with the software (Agilent BenchLink Data Logger software) for recording and processing and the signal profiles during the analysis of the olive oil hydroethanolic extracts. Each extract was analyzed in duplicate. The electro-chemical analysis took 5 min, enabling carrying out several electrochemical scans, the last one being retained, which corresponded to a pseudoequilibrium state. When the coef-ficients of variation of the potentiometric signals recorded by each E-tongue sensor were greater than 20% (value set according to the IOC regulations for sensory analysis), a third assay was performed. As proposed by Rodrigues et al. [22], to minimize the risk of overoptimistic performance of the multivariate models, for data split (establishment of training and internal-validation sets) and modeling purposes, only one electrochemical “average” signal profile per sample was used, avoiding that results from duplicate assays of the same olive oil sample could be included into both training and validation sets.
using an ordinal scale according to the IOC guidelines [35, 36], the existence of a significant statistical effect due to the cooking process was evaluated using the Kruskal-Wallis (KW) nonparametric (distribution free) test, with Dunn’s post hoc nonparametric test being further used if a significant effect was observed. Dunn’s test does multiple pairwise comparisons between group levels with corrections for multiple testing, using the Holm–Bonferroni method as adjustment method to control the family-wise error. Linear Pearson correlation coefficients (𝑅-Pearson) were calculated to evaluate the existence of bivariate correlations between median intensities of the sensory sensations and the mean total phenolic contents of unheated and heated (oven or microwave) olive oils. Also, principal component analysis (PCA) was used as an unsupervised pattern recognition technique with the objective of verifying if the potentiometric signals generated by the E-tongue would naturally split the olive oils according to the “type × time” of heating. The number of principal components (PCs) required depended on data variability but is usually less than or equal to the number of original variables. This technique was applied to the potentiometric signals data matrix, which was previously centered and scaled, to evaluate data variability. Finally, linear discriminant analysis (LDA) with the metaheuristic simu-lated annealing (SA) variable selection algorithm was applied to verify the capability of using the homemade potentiomet-ric E-tongue to discriminate olive oils subjected to different heat-induced coking processes [41–43]. The electrochemical-chemometric strategy followed was similar to previous works of the research team [21, 22, 24–27, 39, 44]. E-tongue-LDA-SA models were established based on the most informative subset of sensors (varying from 2 to 32 sensors, used as independent predictors, whose maximum number must be lower than the number of independent samples studied). This statistical procedure overcomes the risk of including redundant sensors’ information, which may increase the noise effects. The LDA predictive performance was evaluated using the leave-one-out cross-validation (LOO-CV) and the repeated𝐾-fold cross-validation (repeated𝐾-fold-CV) tech-niques. The latter statistical cross-variant approach is a more realistic tool since it ensures that the initial database is split into𝐾-folds, ensuring that each subset contains (1/𝐾)×100% of the total number of independent samples, which are left out in turn to validate the E-tongue-LDA-SA model established using the other𝐾 − 1folds [42]. In this work, the𝐾-folds were set to be equal to 4, enabling the random formation of internal-validation subsets with 25% of the initial data, allowing bias reduction. The procedure was repeated 10 times for putting the model under stress. To normalize the weight of each variable in the final linear classification model, variable scaling and centering procedures were evaluated. The clas-sification performance of each LDA model was graphically evaluated using 2D plot of the main discriminant functions, with posterior probabilities being computed using the Bayes’ theorem (which enables controlling overfitting issues) to deeper assess the classification capability of the established LDA models, allowing plotting the class membership bound-ary lines in the 2D plots [45].𝑅-Pearson coefficients were also calculated to infer about the existence of bivariate correlations
between the mean total phenolic contents of unheated and heated (oven or microwave) olive oils and the group centroids of the linear discriminant functions, for the original grouped data, which would further allow relating the classification performance of the taste device and the olive oils parameters. All statistical analysis was performed using the Subselect [43, 46, 47] and MASS [48] packages of the open source statistical program R (version 2.15.1), at a 5% significance level.
3. Results and Discussion
Olive oils are naturally resistant to thermal oxidation due to their rich composition in monounsaturated fatty acids and phenolic compounds. However, when subjected to high temperatures (from 160 to 190∘C) during prolonged times (e.g., frying, roasting, or processed in microwaves), they suffer a progressive degradation due to oxidation, hydrolysis, and polymerization reactions [3]. Indeed, during usual cook-ing procedures, triacylglycerols are hydrolyzed, the free fatty acids contents change, peroxide values increase, total polar compounds amounts increase, cyclic fatty acid monomers and low molecular weight volatile aldehydes are formed, the contents of some olive oil phenolic fractions (e.g., hydroxytirosol) are reduced or completely degraded, and phytosterols are oxidized [3]. Also, a higher oxidation degree is usually observed during microwave heating compared to conventional oven heating [49]. On the contrary, frying procedures lead to higher losses of phenolic compounds than microwave irradiation [4, 50]. Thus, in this work, it was intended to verify if an E-tongue could be used to differentiate olive oils subjected to different cooking processes and heating time periods.
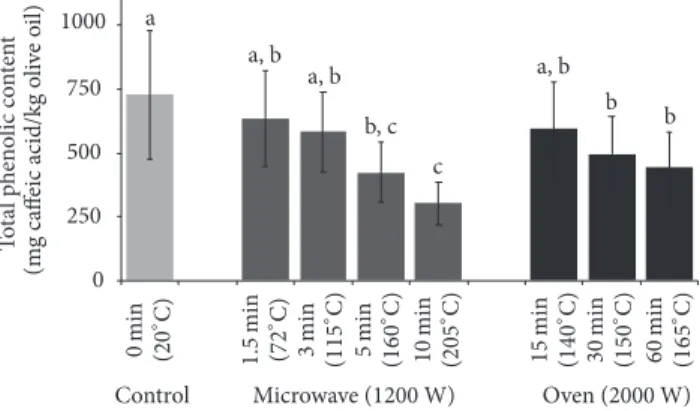
3.1. Effect of Cooking Process on the Olive Oils Total Phenolic Contents and Gustatory Positive Sensory Sensations. The results obtained (Figure 2) allowed verifying that the total phenolic contents are significantly influenced by the cooking process (oven or microwave: 𝑃 value < 0.0001, one-way ANOVA), suffering, in both cases, a significant decrease when the heating time-period increases (𝑃 value ≤0.0218, Tukey’s HSD post hoc test). The results also pointed out that the phenolic compounds degradation was slightly more drastic for microwave heating than with the conventional at the usual cooking time and temperatures ranges (microwave: from 1.5 to 10 min corresponding to 72 to 205∘C; oven: from 15 to 60 min leading to 140 to 165∘C). Nevertheless, it should be strengthening that the higher phenolic reduction was only observed for microwave heating during 10 min, which may be attributed to the higher temperature reached (205∘C) in comparison with the other heating procedures studied (maximum oven temperature≤165∘C). This observation may indicate that, for the time-temperature ranges evaluated, the temperature reached had probably a more significant effect on the total phenolic reduction than the type of cooking (oven versus microwave).
T o ta l p h eno lic co n ten t Control a b a, b b a, b a, b b, c c 0 250 500 750 1000 (m g ca ff
eic acid/kg o
li ve o il) ( 16 0 ∘C) ( 205 ∘C) ( 16 5 ∘ C) ( 15 0 ∘C) ( 14 0 ∘C)
Microwave (1200 W) Oven (2000 W)
60 min 30 min 15 min 10 min 5 min ( 115 ∘ C) 3 min ( 72 ∘ C) 1.5 min ( 20 ∘ C) 0 min
Figure 2: Total phenolic contents (mean value±standard deviation)
of olive oils according to the cooking process applied: control
(no heat-induced, 20∘C); microwave heating (from 1.5 to 10 min,
corresponding to 72 to 205∘C); and electrical conventional oven (15
to 60 min, leading to 140 to 165∘C). Different small letters mean
statistical significant differences, at a 5% significance level.
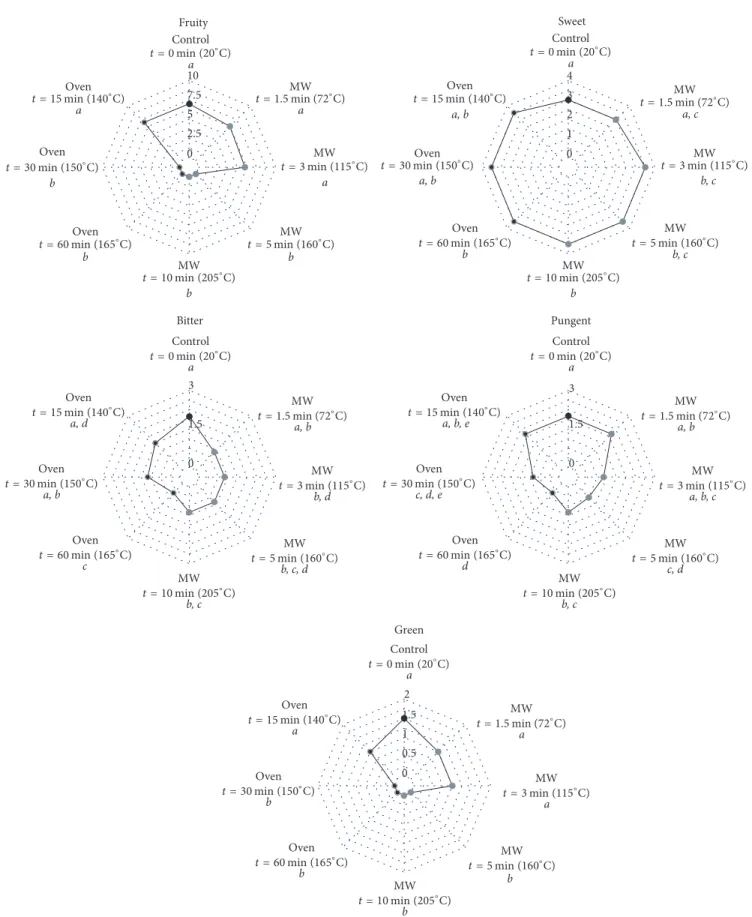
may be enhanced during cooking processes due to the formation of aroma compounds, color, and texture changes [3]. However, the possible effect of the cooking process on the olive oil gustatory-retronasal positive attributes (e.g., fruity, bitter, green, pungent, and sweet sensations) that highly influence consumer’s preference was never evaluated. Several of these positive sensory sensations are related to the total phenolics and/or to the individual phenolic fractions, which amounts are influenced by heat-induced cooking processes. Therefore, all olive oils studied were evaluated by trained sensory panelists before and after each cooking process, following the IOC guidelines [35, 36]. The median intensities of the perceived positive attributes are shown in Figure 3.
As can be inferred from the visualization of Figure 3, the median intensities of all the perceived positive taste sensations were significantly reduced after each heat-induced cooking process (𝑃 values < 0.0001 for Kruskal-Wallis test), decreasing for increased heating time periods. It was observed that fruity and green sensations disappeared after oven heating for 30 min or more and after microwave heating during 5 min or more, which corresponded to heating tem-peratures equal to or greater than 160∘C. On the contrary, sweet sensation was the gustatory attribute less affected by the cooking process, followed by bitter and pungent sensations (Figure 3). Finally, with the exception of sweet sensation, lower perceived intensities of bitter, fruity, green, and pungent attributes corresponded to lower total phenolic contents, showing the expected relation between phenolic content and positive gustatory-retronasal attributes. Indeed, for oven heating process, the median intensities of the above-mentioned four positive sensations showed a linear positive dependence with the mean total phenolic content (0.8843
≤ 𝑅-Pearson≤0.9694). Similarly, for the microwave heating process, positive linear relations were also observed but only for fruity, green, and pungent attribute (0.8075≤ 𝑅-Pearson
≤0.9615).
3.3. Olive Oil E-Tongue Potentiometric Signal Profiles by Type of Heating Procedure and Heating Time-Period. Depending on the type of heating procedure applied and the heating time-period, the potentiometric signals recorded by the 40 E-tongue sensors (20 different lipid polymeric membranes in duplicate: S1:1–S1:20 and S2:1–S2:20) ranged from +90 to +216 mV. It could also be observed that the mean potential signal profiles were quite similar (Figure 4) for unheated olive oils (Control t0 min), olive oils heated in a conventional oven during 15 to 60 min (Oven t15 min; Oven t30 min and Oven t60 min), and olive oils heated in a microwave during 1.5 or 3 min (MW t1.5 min and MW t3 min). Indeed, it is known that the lipid polymeric sensor membranes comprised in the homemade E-tongue respond in the presence and concentration of polar compounds [26, 39], such as phenolic compounds, whose contents in the olive oils studied are of the same order of magnitude for the above-mentioned heat conditions (Figure 2). On the contrary, the mean signal profiles of olive oils heated in the microwave during 5 or 10 min showed quite different trends, which could be due to the more drastic combined effect of the higher heating time and MW heating procedure on the olive oil chemi-cal composition and gustatory-retronasal positive sensory attributes (Figures 2 and 3), to which the E-tongue sensors also respond [24]. It should also be emphasized that the lipid polymeric sensor membranes of the homemade E-tongue had cross-sensitivity towards different chemical compounds (e.g., aldehydes, alcohols, esters, acids, and salts, among others) that mimic positive olive oil sensory attributes and not towards a specific compound. So, the performance of the E-tongue device would mainly depend on a synergetic overall effect due to changes of the type and content of different chemical compounds, rather than to individual effects of a single class of chemical compounds.
Fruity Sweet
Bitter Pungent
Green
2
0 1 2 3 4
0 0.5 1 1.5 3
0 1.5
3
0 1.5 10
0 2.5 5
7.5 t = 1.5MWmin (72∘C)
a
MW
t = 3 GCH(115∘C)
a
MW
t = 3 GCH(115∘C)
a
MW
t = 5 GCH(160∘C)
b
b
MW
t = 10 GCH(205∘C)
b
Oven
t = 60 GCH(165∘C)
b
Oven
t = 30 GCH(150∘C)
b
Oven
t = 15 GCH(140∘C)
a
Control
t = 0 GCH(20∘C)
a
MW
t = 1.5min (72∘C)
a, c
MW
t = 3 GCH(115∘C)
b, c
MW
t = 5 GCH(160∘C)
b, c
MW
t = 10 GCH(205∘C)
b
Oven
t = 60 GCH(165∘C)
b
Oven
t = 30 GCH(150∘C)
a, b
Oven
t = 15 GCH(140∘C)
a, b
Control
t = 0 GCH(20∘C)
a
MW
t = 1.5min (72∘C)
a, b
MW
t = 3 GCH(115∘C)
b, d
MW
t = 5 GCH(160∘C)
b, c, d
MW
t = 10 GCH(205∘C)
b, c
Oven
t = 60 GCH(165∘C)
c
Oven
t = 30 GCH(150∘C)
a, b
Oven
t = 15 GCH(140∘C)
a, d
Control
t = 0 GCH(20∘C)
a
MW
t = 1.5min (72∘C)
a
MW
t = 5 GCH(160∘C)
MW
t = 10 GCH(205∘C)
b
Oven
t = 60 GCH(165∘C)
b
Oven
t = 30 GCH(150∘C)
b
Oven
t = 15 GCH(140∘C)
a
Control
t = 0 GCH(20∘C)
a
MW
t = 1.5min (72∘C)
a, b
MW
t = 3 GCH(115∘C)
a, b, c
MW
t = 5 GCH(160∘C)
c, d
MW
t = 10 GCH(205∘C)
b, c
Oven
t = 60 GCH(165∘C)
d
Oven
t = 30 GCH(150∘C)
c, d, e
Oven
t = 15 GCH(140∘C)
a, b, e
Control
t = 0 GCH(20∘C)
a
Control
E-tongue sensor code number 110 120 130 140 150 160 170 180 190 200 210 P o te n tial diff er ence (mV)
1st array (S1:1 to S1:20) 2nd array (S2:1 to S2:20)
Oven_15min
Oven_30min
Oven_60min
MW_1.5min
MW_3min
MW_5min
MW_10min
S1:1 S1:2 S1:3 S1:4 S1:5 S1:6 S1:7 S1:8 S1:9 S1:10 S1:11 S1:12 S1:13 S1:14 S1:15 S1:16 S1:17 S1:18 S1:19 S1:20 S2:1 S2:2 S2:3 S2:4 S2:5 S2:6 S2:7 S2:8 S2:9 S2:10 S2:11 S2:12 S2:13 S2:14 S2:15 S2:16 S2:17 S2:18 S2:19 S2:20
Figure 4: E-tongue potentiometric mean signal profiles recorded during the analysis of hydroethanolic unheated (Control) and heated olive oils in an oven (2000 W) during 15, 30, or 60 min (Oven 15 min, Oven 30 min, and Oven 60 min) or in a microwave (1200 W) during 1.5, 3, 5, or 10 min (MW 1.5 min, MW 3 min, MW 5 min, and MW 10 min).
PC1 (63.7%) −0.10 −0.05 0.00 0.05 PC2 (14.6%) −0.05 0.00 0.05 PC3 (7.4%) −0.08 −0.06 −0.04 −0.02 0.00 0.02 0.04 MW-10 MW-10 MW-10 MW-10 MW-10 MW-10 MW-10 MW-10 MW-10MW-5 MW-5 O-30 MW-5 MW-10 MW-1.5 MW-5 MW-1.5 MW-5MW-5 O-30 MW-3 MW-10 C O-60 MW-3 C MW-5 MW-5 O-15 MW-5 C MW-5 O-15 MW-3 O-60 C MW-3 O-60 MW-3 O-30 MW-3 C MW-3 O-60 MW-1.5 MW-3 MW-5 O-60 MW-3 O-60 C MW-1.5 MW-1.5 O-15 O-30 MW-1.5 O-30 O-60 O-30 O-30 MW-1.5 MW-3 O-30 C C MW-1.5 O-15 O-60 O-15 O-30 O-15 O-30 O-60 CO-30 O-15 C C MW-1.5 O-15 O-15 O-60 MW-1.5 O-15 O-60 MW-1.5 O-30 C O-60 MW-3 O-15 O-15
Figure 5: PCA results based on the 40 signal sensors profiles recorded by the homemade potentiometric E-tongue (3D plot of the first 3 PCs): microwave heating (MW, grey filled marks) for 1.5, 3, 5, or 10 min (MW-1.5, MW-3, MW-5, or MW-10); oven heating (O, black filled marks) for 10, 30, or 60 min (O-10, O-30, or O-60); and unheated olive oils (control: C, asterisk mark).
above-mentioned groups, based on the first 3 PCs (which explained 80% of the potentiometric data variability).
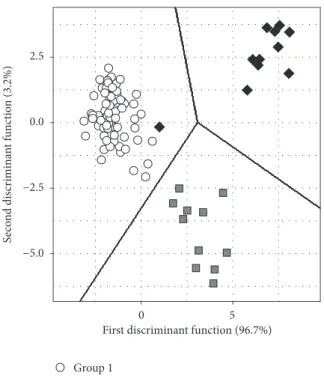
Finally, to further evaluate the E-tongue classification performance, an E-tongue-LDA-SA model with 2 discrim-inant functions (explaining 96.7% and 3.2% of the data variability, resp.) was developed based on the potentiometric signal profiles of a subset of 28 sensors (1st array: S1:1, S1:3,
S1:6, S1:7, S1:9, S1:10, S1:12, S1:14 to S1:18, and S1:20; 2nd array: S2:1 to S2:4, S2:6, S2:7, S2:10, S2:12 to S2:18, and S2:20) selected from the 40 sensors comprised in the E-tongue device. The selected model allowed the correct classification of 99% of the olive oils according to the predefined heat-induced original grouped data (i.e., moderate, intense, or severe) (Figure 6) and a sensitivity of 97% for the LOO-CV procedure (2 samples of group 2 misclassified as group 1 and 1 sample of group 3 misclassified as group 1). From Figure 4, it can be observed that the group centroids of the 1st discriminant function (group 1: −1.1584; group 2: +3.2028; and group 3: +6.4598) increase with the intensity of the heat-induced cooking process, showing a linear negative relation (𝑅-Pearson =−0.9995) with the mean total phenolic concentrations of the predefined groups (group 1: 581 ±
100mg caffeic acid/kg olive oil; group 2:425 ± 117mg caffeic acid/kg olive oil; and group 3:304 ± 83mg caffeic acid/kg olive oil). This finding suggests that E-tongue potentiometric signals are inversely related to the total phenolic contents of unheated and heated olive oils and indirectly related to the bitter, fruity, green, and/or pungent sensations perceived on the olive oils. The E-tongue-LDA-SA model predictive performance was further assessed using a repeated𝐾 -fold-CV procedure (4 folds and 10 repetitions, which allowed the evaluation of the robustness of the model using the 40 internal cross-validation sets of 8 to 9 olive oils). The best predictive E-tongue-LDA-SA model was also based on the potentiometric fingerprints recorded by the same 28 lipid membrane sensors, which led to mean correct classification rates of94 ± 4% (varying from 87% to 100%).
−5.0 −2.5 0.0 2.5
0
First discriminant function (96.7%)
S
eco
nd dis
cr
imina
n
t f
u
nc
ti
o
n
(3.2%)
Group 1 Group 2 Group 3
5
Figure 6: Classification performance (original grouped data) of the E-tongue-LDA-SA model (28 selected sensors): discrimination of olive oils according to the heat-induced cooking process (group 1: unheated olive oil plus oven heating for 15 to 60 min and microwave heating for 1.5 to 3 min; group 2: microwave heating for 5 min; and group 3: microwave heating for 10 min).
the cooking process using microwave irradiation during 5–10 min, which could be related to the overall reduction of total phenolic contents and was evidenced by loss of sensory sensations of the olive oils after the microwave heat-induced process. Furthermore, E-tongue-LDA-SA results pointed out that the potentiometric fingerprints of unheated olive oils and oven (up to 60 min) or microwave (up to 3 min) heated olive oils were not deeply influenced by these cooking processes, possibly meaning that the composition of the polar compounds soluble in water was not highly affected by these moderate heating during a low to medium time-period. This finding could be expected since as pointed out by Santos et al. [3] olive oil processed under normal cooking conditions (frying or roasting) at temperatures up to 180–190∘C shows a comparable or better quality resistance performance to that achieved with other vegetable oils, although, under microwave heating, the temperatures achieved are less con-trolled and so all vegetable oils suffer a more rapid quality degradation. So, the proposed electrochemical-chemometric approach could be envisaged as a fast and practical pre-liminary tool, capable of giving valuable sensory insights regarding the effect of the cooking process (moderate, intense, or severe heat-induced process) on the olive oil final quality.
4. Conclusions
Heat-induced cooking processes may have a deep impact on the overall chemical composition of olive oils, whose use for culinary purposes has increased. The type and intensity of the chemical reactions that may occur (oxidation, hydrolysis, polymerization, etc.) are highly dependent on the cooking technique, the heating time, and the temperature reached during the process and due to the presence of absence of other food products. Furthermore, during the cooking process, the highly appreciated sensory attributes of olive oils may be quite altered. The present work confirmed that the total phenolic content of olive oils was significantly reduced during oven or microwave heating, being more marked for the latter. Also, for the first time, it was verified that the perceived gustatory-retronasal intensities were drastically reduced by both cooking procedures and the fruity and green sensations disappeared after 30 min of heating in an electrical conventional oven (temperatures equal or greater than 150∘C) or after 5 min of microwave heating (temperatures equal or greater than 160∘C). Sweet attribute was the less affected by the heat-induced process, bitter and pungent sensations sim-ilarly being affected. Also, as expected, the median intensities of bitter, fruity, green, and pungent sensations were directly related to the mean total phenolic contents (i.e., higher phe-nolic contents corresponded to higher perceived intensities). Finally, the possibility of applying a potentiometric electronic tongue to satisfactorily discriminate olive oils subjected to moderate, intense, or more severe heating processes was also shown. A linear correlation was found between the total phenolic contents and the location of the group centroids according to the linear multivariate classification model was established with the potentiometric fingerprints recorded by the taste device. This pointed out that, indeed, the classifica-tion satisfactory performance may be related to the electronic tongue known capability to interact with taste substances. This last finding can be of practical future interest if a sensor device would be envisaged for indirectly assessing the olive oil quality after being subjected to different heat-induced cooking processes.
Conflicts of Interest
The authors declare that there are no conflicts of interest regarding the publication of this article.
Acknowledgments
FCT, POPH-QREN, and FSE for the Ph.D. Grant (SFRH/ BD/104038/2014).
References
[1] A. Bajoub, S. Medina-Rodr´ıguez, M. G´omez-Romero et al., “Assessing the varietal origin of extra-virgin olive oil using liquid chromatography fingerprints of phenolic compound,
data fusion and chemometrics,”Food Chemistry, vol. 215, pp.
245–255, 2017.
[2] E. Borr`as, J. Ferr´e, R. Boqu´e et al., “Prediction of olive oil sensory descriptors using instrumental data fusion and partial least squares (PLS) regression,”Talanta, vol. 155, pp. 116–123, 2016.
[3] C. S. P. Santos, R. Cruz, S. C. Cunha, and S. Casal, “Effect of cooking on olive oil quality attributes,”Food Research Interna-tional, vol. 54, no. 2, pp. 2016–2024, 2013.
[4] V. Goulas, A. Orphanides, E. Pelava, and V. Gekas, “Impact of thermal processing methods on polyphenols and antioxidant activity of olive oil polar fraction,”Journal of Food Processing and Preservation, vol. 39, no. 6, pp. 1919–1924, 2015.
[5] S. Casal, R. Malheiro, A. Sendas, B. P. P. Oliveira, and J. A. Pereira, “Olive oil stability under deep-frying conditions,”Food and Chemical Toxicology, vol. 48, no. 10, pp. 2972–2979, 2010. [6] R. Malheiro, N. Rodrigues, G. Manzke, A. Bento, J. A. Pereira,
and S. Casal, “The use of olive leaves and tea extracts as effective antioxidants against the oxidation of soybean oil under microwave heating,”Industrial Crops and Products, vol. 44, pp. 37–43, 2013.
[7] S. Gharby, H. Harhar, B. Matth¨aus, Z. Bouzoubaa, and Z. Charrouf, “The chemical parameters and oxidative resistance to heat treatment of refined and extra virgin Moroccan Picholine olive oil,”Journal of Taibah University for Science, vol. 10, no. 1, pp. 100–106, 2016.
[8] Y. M. Kongbonga, H. Ghalila, Y. Majdi, W. M. Feudjio, and Z. B. Lakhdar, “Investigation of heat-induced degradation of virgin olive oil using front face fluorescence spectroscopy and
chemometric analysis,”Journal of the American Oil Chemists’
Society, vol. 92, no. 10, pp. 1399–1404, 2015.
[9] I. Oueslati, A. Taamalli, A. Loubiri, D. Arr´aez-Rom´an, A. Segura-Carretero, and M. Zarrouk, “Assessment of conven-tional and microwave heating effects on the variation of the bioactive compounds of Ch´etoui VOO using
HPLC-DAD-ESI-TOF-MS,”Arabian Journal of Chemistry, 2017.
[10] Portaria No. 1135/95, Di´ario da Rep´ublica, I S´erie-B, no. 214, article 5836, 1995.
[11] C. A. Nunes, “Vibrational spectroscopy and chemometrics to assess authenticity, adulteration and intrinsic quality parame-ters of edible oils and fats,”Food Research International, vol. 60, pp. 255–261, 2014.
[12] E. Valli, A. Bendini, A. Berardinelli et al., “Rapid and innovative instrumental approaches for quality and authenticity of olive oils,”European Journal of Lipid Science and Technology, vol. 118, no. 11, pp. 1601–1619, 2016.
[13] M. Peris and L. Escuder-Gilabert, “Electronic noses and tongues
to assess food authenticity and adulteration,”Trends in Food
Science & Technology, vol. 58, pp. 40–54, 2016.
[14] A. Guadarrama, M. L. Rodr´ıguez-M´endez, C. Sanz, J. L. R´ıos, and J. A. de Saja, “Electronic nose based on conduct-ing polymers for the quality control of the olive oil aroma-discrimination of quality, variety of olive and geographic ori-gin,”Analytica Chimica Acta, vol. 432, no. 2, pp. 283–292, 2001.
[15] Z. Haddi, A. Amari, A. Ould Ali et al., “Discrimination and identification of geographical origin virgin olive oil by an e-nose based on MOS sensors and pattern recognition techniques,” in
Proceedings of the 25th Eurosensors Conference, pp. 1137–1140, September 2011.
[16] Z. Haddi, H. Alami, N. El Bari et al., “Electronic nose and electronic tongue combination for improved classification of Moroccan virgin olive oil profiles,”Food Research International, vol. 54, pp. 1488–1498, 2013.
[17] M. S. Cosio, D. Ballabio, S. Benedetti, and C. Gigliotti, “Geo-graphical origin and authentication of extra virgin olive oils by an electronic nose in combination with artificial neural networks,”Analytica Chimica Acta, vol. 567, no. 2, pp. 202–210, 2006.
[18] M. S. Cosio, D. Ballabio, S. Benedetti, and C. Gigliotti, “Eval-uation of different storage conditions of extra virgin olive oils with an innovative recognition tool built by means of electronic nose and electronic tongue,”Food Chemistry, vol. 101, no. 2, pp. 485–491, 2007.
[19] S. Mabrouk, Y. Braham, H. Barhoumi, and A. Maaref, “Char-acterization and classification of different tunisian geographical olive oils using voltammetric electronic tongue,”Journal of Food Processing and Technology, vol. 7, no. 1, Article ID 1000535, 5 pages, 2015.
[20] L. G. Dias, A. Fernandes, A. C. A. Veloso, A. S. C. Machado, J. A. Pereira, and A. M. Peres, “Single-cultivar extra virgin olive oil classification using a potentiometric electronic tongue,”Food Chemistry, vol. 160, pp. 321–329, 2014.
[21] L. G. Dias, N. Rodrigues, A. C. A. Veloso, J. A. Pereira, and A. M. Peres, “Monovarietal extra-virgin olive oil classification: a fusion of human sensory attributes and an electronic tongue,”
European Food Research and Technology, vol. 242, no. 2, pp. 259– 270, 2016.
[22] N. Rodrigues, L. G. Dias, A. C. A. Veloso, J. A. Pereira, and A. M. Peres, “Monitoring olive oils quality and oxidative resistance
during storage using an electronic tongue,”LWT- Food Science
and Technology, vol. 73, pp. 683–692, 2016.
[23] N. Rodrigues, L. G. Dias, A. C. A. Veloso, J. A. Pereira, and A. M. Peres, “Evaluation of extra-virgin olive oils shelf life using
an electronic tongue—chemometric approach,”European Food
Research and Technology, vol. 243, no. 4, pp. 597–607, 2017. [24] A. C. A. Veloso, L. G. Dias, N. Rodrigues, J. A. Pereira, and A.
M. Peres, “Sensory intensity assessment of olive oils using an electronic tongue,”Talanta, vol. 146, pp. 585–593, 2016. [25] A. C. A. Veloso, L. M. Silva, N. Rodrigues et al., “Perception of
olive oils sensory defects using a potentiometric taste device,”
Talanta, vol. 176, pp. 610–618, 2018.
[26] S. Slim, N. Rodrigues, L. G. Dias et al., “Application of an electronic tongue for Tunisian olive oils’ classification according
to olive cultivar or physicochemical parameters,”European Food
Research and Technology, vol. 243, no. 8, pp. 1459–1470, 2017. [27] F. Souayah, N. Rodrigues, A. C. A. Veloso et al., “Discrimination
of olive oil by cultivar, geographical origin and quality using
potentiometric electronic tongue fingerprints,”Journal of the
American Oil Chemists’ Society, vol. 94, no. 12, pp. 1417–1429, 2017.
[28] I. M. Apetrei and C. Apetrei, “Voltammetric e-tongue for the
quantification of total polyphenol content in olive oils,”Food
Research International, vol. 54, no. 2, pp. 2075–2082, 2013. [29] C. Apetrei, I. M. Apetrei, I. Nevares et al., “Using an e-tongue
wines aged in oak barrels or aged using alternative methods. Correlation between electrochemical signals and analytical parameters,”Electrochimica Acta, vol. 52, no. 7, pp. 2588–2594, 2007.
[30] C. Apetrei, I. M. Apetrei, S. Villanueva, J. A. de Saja, F. Gutierrez-Rosales, and M. L. Rodriguez-Mendez, “Combination of an e-nose, an e-tongue and an e-eye for the characterisation of olive oils with different degree of bitterness,”Analytica Chimica Acta, vol. 663, no. 1, pp. 91–97, 2010.
[31] C. Apetrei, M. Ghasemi-Varnamkhasti, and I. M. Apetrei, “Olive
oil and combined electronic nose and tongue,” inElectronic
Noses and Tongues in Food Science, M. L. Rodr´ıguez-Mendez, Ed., pp. 277–289, Academic Press, London, UK, 2016.
[32] M. L. Rodr´ıguez-M´endez, V. Parra, C. Apetrei et al., “Electronic tongue based on voltammetric electrodes modified with mate-rials showing complementary electroactive properties. Applica-tions,”Microchimica Acta, vol. 163, no. 1-2, pp. 23–31, 2008. [33] M. L. Rodr´ıguez-M´endez, C. Apetrei, and J. A. de Saja,
“Electronic tongues purposely designed for the organoleptic characterization of olive oils,” inOlives and Olive Oil in Health and Disease Prevention, V. R. Preedy and R. R. Watson, Eds., pp. 525–532, Academic Press, London, UK, 2010.
[34] U. Harzalli, N. Rodrigues, A. C. Veloso et al., “A taste sensor device for unmasking admixing of rancid or winey-vinegary olive oil to extra virgin olive oil,”Computers and Electronics in Agriculture, vol. 144, pp. 222–231, 2018.
[35] International Olive Council, Sensory analysis of olive oil—method for the organoleptic assessment of virgin olive oil, COI/T.20/Doc. No. 15/Rev. 6, 2013.
[36] International Olive Council, IOC Mario Solinas quality award—rules of the international competition for extra virgin olive oils, COI/T.30/Doc. No. 17, 2014.
[37] C. Capannesi, I. Palchetti, M. Mascini, and A. Parenti, “Elec-trochemical sensor and biosensor for polyphenols detection in olive oils,”Food Chemistry, vol. 71, no. 4, pp. 553–562, 2000. [38] L. A. Dias, A. M. Peres, A. C. A. Veloso, F. S. Reis, M.
Vilas-Boas, and A. A. S. C. Machado, “An electronic tongue taste evaluation: identification of goat milk adulteration with bovine milk,”Sensors and Actuators B: Chemical, vol. 136, no. 1, pp. 209– 217, 2009.
[39] ´I. M. G. Marx, N. Rodrigues, L. G. Dias et al., “Quantification of table olives’ acid, bitter and salty tastes using potentiometric
electronic tongue fingerprints,”LWT- Food Science and
Technol-ogy, vol. 79, pp. 394–401, 2017.
[40] Y. Kobayashi, M. Habara, H. Ikezazki, R. Chen, Y. Naito, and K. Toko, “Advanced taste sensors based on artificial lipids with global selectivity to basic taste qualities and high correlation to sensory scores,”Sensors, vol. 10, no. 4, pp. 3411–3443, 2010. [41] D. Bertsimas and J. Tsitsiklis, “Simulated annealing,”Statistical
Science, vol. 8, no. 1, pp. 10–15, 1993.
[42] S. Kirkpatrick, C. D. Gelatt, and M. P. Vecchi, “Optimization by simulated annealing,”Science, vol. 220, no. 4598, pp. 671–680, 1983.
[43] J. Cadima, J. O. Cerdeira, and M. Minhoto, “Computational aspects of algorithms for variable selection in the context
of principal components,” Computational Statistics & Data
Analysis, vol. 47, no. 2, pp. 225–236, 2004.
[44] ´I. Marx, N. Rodrigues, L. G. Dias et al., “Sensory classification of table olives using an electronic tongue: analysis of aqueous pastes and brines,”Talanta, vol. 162, pp. 98–106, 2017.
[45] C. M. Bishop, Pattern Recognition and Machine Learning,
Springer, New York, NY, USA, 1st edition, 2006.
[46] J. Cadima, J. O. Cerdeira, P. D. Silva, and M. Minhoto, “The subselect R package,” 2012, http://cran.rproject.org/web/ packages/subselect/vignettes/subselect.pdf.
[47] M. Kuhn and K. Johnson,Applied Predictive Modeling, Springer
Science Business Media, New York, NY, USA, 2013.
[48] W. N. Venables and B. D. Ripley,Modern Applied Statistics with
S (Statistics and Computing), Springer, New York, NY, USA, 4th edition, 2002.
[49] F. Caponio, A. Pasqualone, and T. Gomes, “Effects of conven-tional and microwave heating on the degradation of olive oil,”
European Food Research and Technology, vol. 215, no. 2, pp. 114– 117, 2002.
[50] M. Brenes, A. Garc´ıa, A. Guinda, M. C. Dobarganes, J. Velasco, and C. Romero, “Influence of thermal treatments simulating cooking processes on the polyphenol content in virgin olive oil,”
Hindawi www.hindawi.com
International Journal of
Volume 2018
Zoology
Hindawiwww.hindawi.com Volume 2018
Anatomy
Research International
Peptides
Hindawi
www.hindawi.com Volume 2018
Hindawi
www.hindawi.com Volume 2018 Journal of
Parasitology Research
Genomics
International Journal of
Hindawi
www.hindawi.com Volume 2018 Hindawi Publishing Corporation
http://www.hindawi.com Volume 2013 Hindawi
www.hindawi.com
The Scientific
World Journal
Volume 2018
Hindawi
www.hindawi.com Volume 2018
Bioinformatics
Advances inMarine Biology
Journal ofHindawi
www.hindawi.com Volume 2018
Hindawi
www.hindawi.com Volume 2018
Neuroscience
Journal
Hindawi
www.hindawi.com Volume 2018
BioMed
Research International
Cell Biology
International Journal of
Hindawi
www.hindawi.com Volume 2018
Biochemistry Research International
Archaea
Hindawi
www.hindawi.com Volume 2018
Hindawi
www.hindawi.com Volume 2018 Genetics
Research International
Hindawi
www.hindawi.com Volume 2018 Advances in
Virology
Stem Cells
International
Hindawi
www.hindawi.com Volume 2018
Hindawi
www.hindawi.com Volume 2018
Enzyme
Research
Hindawi
www.hindawi.com Volume 2018
International Journal of