– –
ORIGINAL ARTICLE
Physical growth of schoolchildren from the Jequitinhonha
Valley, Minas Gerais, Brazil: Comparison with the
CDC-2000 reference using the
LMS
method
DARTAGNAN PINTO GUEDES
1, JOSÉ ARLEN BELTRÃO DE MATOS
1,
VITOR PIRES LOPES
3,4, JOSÉ EDUARDO FERREIRINHA
2,4&
ANTÓNIO JOSÉ SILVA
2,41State University of Londrina, Paraná, Brasil,2University of Trás-os-Montes and Alto Douro,
Vila Real, Portugal,3Polytechnic Institute of Bragança, Portugal, and4Research Centre for Sport, Health and Human Development (CIDESD)
(Received 25 May 2009; accepted 11 November 2009)
Abstract
Objective: To analyse the physical growth of a representative school population sample from the Jequitinhonha Valley, Minas Gerais, Brazil, in comparison with the reference proposed by the Centre for Disease Control and Prevention (CDC-2000).
Methods: The sample was composed of 5100 individuals (2730 girls and 2370 boys), aged 6–18 years. Body weight-for-age and height-for-age percentiles were obtained using theLMSmethod. Statistical and graphical comparisons were made with the corresponding percentiles of the CDC-2000 reference, estimated using the same method.
Results: Overall, the calculated values of theL(asymmetry) and the S(variability) parameters were quite similar to the CDC-2000 reference values. However,M(median) was substantially different from the reference used in the study, mainly in schoolchildren over 12–13 years of age of both genders. The magnitude of the deficits of height-for-age and body weight-for-age observed in the schoolchildren
from the Jequitinhonha Valley, Minas Gerais, Brazil, varied from 4 to 6 cm and from 3 to 6 kg, respectively.
Conclusion: The body weight-for-age and height-for-age percentiles of schoolchildren population in the Jequitinhonha Valley, Minas Gerais, Brazil differed substantially from those referenced.
Keywords:Anthropometry, body mass, stature, child, adolescent
Correspondence: Dartagnan Pinto Guedes, Rua Ildefonso Werner 177, Condomínio Royal Golf, CEP 86055-545–Londrina,
Paraná, Brasil. E-mail: [email protected]
ISSN 0301-4460 print/ISSN 1464-5033 onlineÓ2010 Informa UK Ltd.
Introduction
Although growth is genetically determined, it is sensitive to environmental contingencies, such as economic, geo-climatic, social and cultural factors, which may alter the expression of genetic potential with higher or lesser intensity (Palmert and Hirschhorn 2003; Silventoinen 2003). This complex biological and environmental interaction leads to an extraordinary plasticity of human physical growth and to intra- and inter-population heterogeneity. In fact, human physical growth is an important attribute to use in analyses of the health condition and quality of life in a population (WHO 1995). Systematic monitoring programmes of physical growth are commonly accepted as an important indicator of the quality of life in a specific young population, or of the extent of the existing distortions in different subgroups from the same population (Onis et al. 2007).
Previous studies involving young populations from different regions of Brazil (Guedes and Guedes 2002), and other countries (Onis et al. 2004), have highlighted the physical growth variability within and between populations. Interpretation of the physical growth of indi-viduals or a population requires the use of a reference system. Literature has systematically suggested the use of a single reference, seen as universal, based on gathered information of young populations from developed countries where, supposedly, the best environmental conditions for ideal physical growth exist (WHO 1995).
This suggestion is based on the assumption that physical growth follows a unique pattern highly resistant to external influences, but which could be changed if negative conditions persist for long periods (Gafni and Baron 2000). Therefore, differences observed in the physical growth indicators of young people from different regions of the world could be explained by differences in life conditions (nutrition, primary health care, etc.).
In this context, the reference system originally proposed in the 1970s by the National Centre for Health Statistics (NCHS), involving a representative sample of the young North American population (Hamill et al. 1979), and recently adjusted and updated by the Centre for Disease Control and Prevention (CDC) (Kuczmarski et al. 2000), is the suggested instrument for monitoring physical growth throughout the world and is also widely accepted by human growth researchers (Hasan et al. 2001; Ogden et al. 2002; Alfaro et al. 2004; Hakeem et al. 2004; Marwaha et al. 2006; Ayatollahi and Pourahmad 2006; Neyzi et al. 2006; Davies 2007).
The purpose of this study was to describe the parameters associated with physical growth according to age and gender in a representative sample of schoolchildren, from the Jequitinhonha Valley in Minas Gerais, Brazil, comparing them with the parameters published by the Centre for Disease Control and Prevention – CDC-2000.
Methodology
This study is part of a cross-sectional survey, involving anthropometric and socio-demographic indicators of the schoolchildren population from the Jequitinhonha Valley, Minas Gerais, Brazil. The data were gathered between August and November 2007. The research was approved by the Committee of Ethics in Research of the State University of Montes Claros – UNIMONTES (Protocol no. 529/2006).
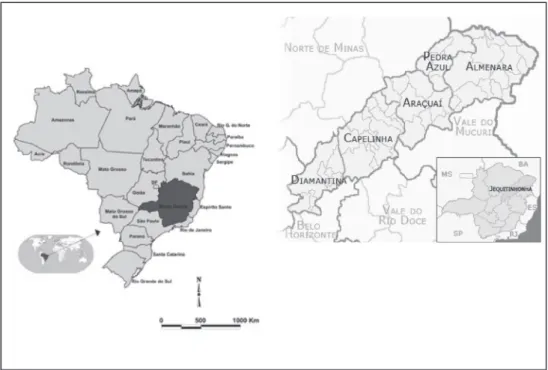
The Jequitinhonha Valley is known as one of the poorest regions in Brazil. It is located in the northeast of Minas Gerais state, where cities have the worst socio-economic index in Brazil. Concerning the Human Development Index (HDI), 58.8% of the State’s cities show
40 deaths/1.000 live births. Figure 1 indicates the geographical location of the Jequitinhonha Valley, Minas Gerais, Brazil.
Sample
The reference population includes schoolchildren of both genders aged between 6 and 18 years, who were enrolled in the 2007 school year. According to information given by the Sector of Statistics of the State of Minas Gerais’Secretariat of Education, at the beginning of
the 2007 school year there were 175 826 schoolchildren enrolled in 5022 primary classes and 32 245 in secondary classes, which made up a total of 208 071 schoolchildren.
The selection of the sample followed a certain sequence of steps, in an attempt to obtain a stratified probabilistic sample which would actually represent the considered schoolchildren population. Firstly, all of the Jequitinhonha Valley’s schoolchildren were classified separately by gender and chronological age, according to the school they were enrolled in. Secondly, the population of schoolchildren was stratified by the five administrative districts of the Jequitinhonha Valley.
It was decided to include 60 schools that were randomly selected from groups of schools gathered in the same section of an administrative micro region, each section having 16 schools.
The sample size was established assuming a 95% confidence interval, a 3% sampling error and an increment of 10% in order to cover possible losses when gathering the data. Since a cluster sampling selection was used, 1.5 of design effect was obtained. The sample size calculated was 4800 subjects. However, the sample used was 5100 subjects (2730 girls and 2370 boys).
The criteria for excluding subjects were: (a) refusal to participate in the study; (b) not being authorized by the parents or tutors; (c) not going to class on the day scheduled for collecting the data; and (d) any physical incapacity.
Collecting data
Age was established in years and months. Height and body weight were measured according to standardized procedures (WHO 1995). Measurements were taken by three anthropo-metries. Technical error varied between 20 and 50 g for body weight and between 2 and 5 mm for height.
Statistical analyses
The LMS parameters (Lambda for the skew, Mu for the median, and Sigma for the
generalized coefficient of variation) were obtained using the method proposed by Cole et al. (1998). This method takes note of any departures from normality of the growth reference by inclusion of theLparameter. TheLMSparameters were calculated for each gender for each
age segment of 3 months.
From theL,MandSvalues for body weight and height the percentiles of weight-for-age
and of height-for-age were calculated according to the mathematical model (Cole 1990):
1/
(1 + )
=
L
C M LSZ
whereL,M andSare values of asymmetry, median and variability calculated for each age
segment and gender, andZ represents the value of score z corresponding to the selected
percentile. In this case, we chose to consider the percentiles traditionally used in studies of physical growth and considered in international references (P3, P10, P25, P50, P75, P90 and P97).
For each age segment and gender, the calculated percentiles equivalent to weight-for-age and height-for-age were compared with the corresponding values of the CDC-2000 reference (Kuczmarski et al. 2000), also established according to the LMS method,
according to the fraction: 100 log(percentile of reference/calculated percentile). However, the results were gathered in three age groups: (1) from 6 to 9.5 years old; (2) from 10 to 14.5 years old; and (3) from 15 to 18 years old. The average in each age group and gender was used. All data analysis was carried in Stata 9.2 (Stata Corp. College Station, TX, USA).
Results
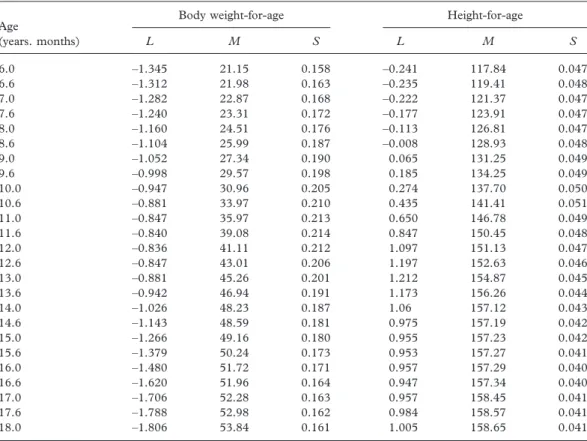
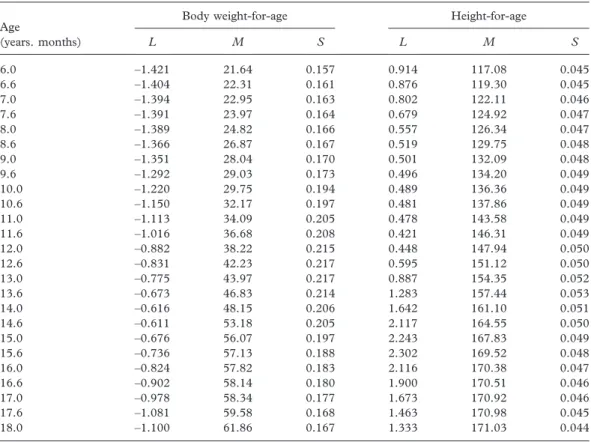
Tables I and II present the parametersL,MandSfor body weight-for-age and for
height-for-age at/with 6 months intervals for girls and boys, respectively.
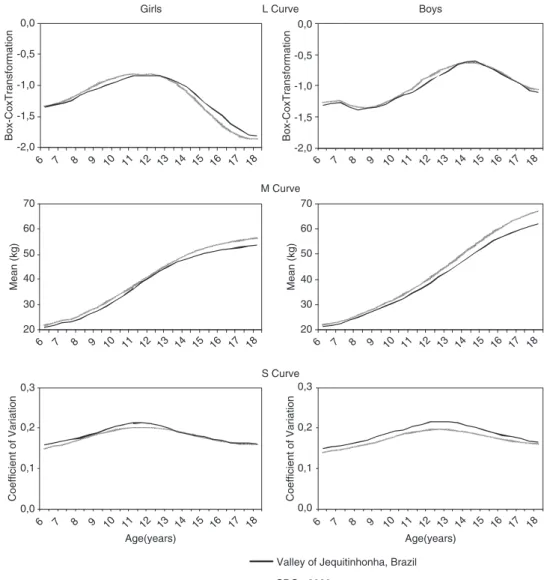
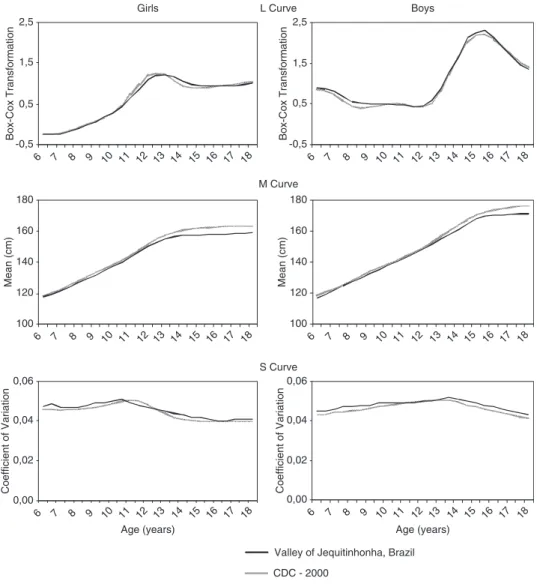
In Figures 2 and 3 theL, MandScurves of body weight-for-age and height-for-age are
compared with the CDC-2000 reference. Overall, noticeable similarities between the curves can be observed. However, in the M curve, the observed differences in both genders are
quite evident.
were observed in the percentiles of body weight-for-age, in boys between 15 and 18 years of age. In percentiles for height-for-age, the difference increased proportionally with age, in both girls and boys, reaching the highest discrepancies at 15–18 years old.
Discussion
When growth curves are generated fromLMSparameters the distribution is mathematically
captured (Cole 1989). TheLMSparameters can then be used to generate a growth chart.
This process of generating a growth reference decreases the influence of minor errors originated during the sampling and measurement of the subjects and the abnormality of the distribution (Mei et al. 1998).
Comparison of the Lcurves between this study and the CDC-2000 references, showed
large similarities. The body weight-for-age L curves always had negative values for both
genders, suggesting an increase of positive skew distribution which slowly decreased with age, reaching an inflexion point which tended to show once again more accentuated asymmetries, mainly in girls. In schoolchildren from Jequitinhonha, Minas Gerais, Brazil, the mean L values was close to –1.10 for both genders; however in girls the highest
asymmetry occurred at the age of 16 years, with a mean Lvalue of –1.68; whilst in boys
this phenomenon was observed before the expected age of peak of biological maturation, between the 6 and 11 years of age, with a medium value ofL equal to –1.28.
Table I. Values of theL,MandSparameters, for body weight-for-age and height-for-age of the schoolchildren from the Jequitinhonha Valley, Minas Gerais, Brazil 2007–Girls.
Age Body weight-for-age Height-for-age
(years. months) L M S L M S
6.0 –1.345 21.15 0.158 –0.241 117.84 0.047
6.6 –1.312 21.98 0.163 –0.235 119.41 0.048
7.0 –1.282 22.87 0.168 –0.222 121.37 0.047
7.6 –1.240 23.31 0.172 –0.177 123.91 0.047
8.0 –1.160 24.51 0.176 –0.113 126.81 0.047
8.6 –1.104 25.99 0.187 –0.008 128.93 0.048
9.0 –1.052 27.34 0.190 0.065 131.25 0.049
9.6 –0.998 29.57 0.198 0.185 134.25 0.049
10.0 –0.947 30.96 0.205 0.274 137.70 0.050
10.6 –0.881 33.97 0.210 0.435 141.41 0.051
11.0 –0.847 35.97 0.213 0.650 146.78 0.049
11.6 –0.840 39.08 0.214 0.847 150.45 0.048
12.0 –0.836 41.11 0.212 1.097 151.13 0.047
12.6 –0.847 43.01 0.206 1.197 152.63 0.046
13.0 –0.881 45.26 0.201 1.212 154.87 0.045
13.6 –0.942 46.94 0.191 1.173 156.26 0.044
14.0 –1.026 48.23 0.187 1.06 157.12 0.043
14.6 –1.143 48.59 0.181 0.975 157.19 0.042
15.0 –1.266 49.16 0.180 0.955 157.23 0.042
15.6 –1.379 50.24 0.173 0.953 157.27 0.041
16.0 –1.480 51.72 0.171 0.957 157.29 0.040
16.6 –1.620 51.96 0.164 0.947 157.34 0.040
17.0 –1.706 52.28 0.163 0.957 158.45 0.041
17.6 –1.788 52.98 0.162 0.984 158.57 0.041
TheLparameter for height-for-age in girls had a progressive increase of asymmetry up to
the age of 13, when a slight decline was detected and then a stable value until the age of 18 years. In boys, between the ages of 6–13 years there was a tendency for theLparameter value to remain stable, then an abrupt rise up until they were 16 years of age, and later a decrease of similar intensity.
TheLcurves drawn from the data of this study were very similar to curves presented by
the CDC-2000 reference. According to Cole (1989), occurrence of the sameLcurve pattern
in different populations is a proof that the variations in asymmetry are genuine and not a consequence of technical artifice (sample or procedure).
TheScurves of body weight-for-age and height-for-age drawn from the data taken from
the schoolchildren from Jequitinhonha, Minas Gerais, Brazil, were similar to the curves that represent the CDC-2000. Besides, the dimensions of the S values can be considered of
low magnitude and considerably higher for the measurements associated with body weight-for-age than for the measurements related to height-weight-for-age. TheScurves for body
weight-for-age showed a peak value close to 22% for each gender, which coincides with the expected beginning of puberty, earlier in girls than in boys, but longer in boys.
The M curves for body weight-for-age and height-for-age drawn from the data of the
present study and the data from CDC-2000 reference are quite similar up to 12–13 years of age, earlier in girls. In older ages, the curves depart from each other, with greater values for the curve drawn of the CDC-2000, reaching the highest discrepancies at the age of 18 years.
Table II. Values of theL,MandSparameters, for body weight-for-age and height-for-age of the schoolchildren from the Jequitinhonha Valley, Minas Gerais, Brazil 2007–Boys.
Age Body weight-for-age Height-for-age
(years. months) L M S L M S
6.0 –1.421 21.64 0.157 0.914 117.08 0.045
6.6 –1.404 22.31 0.161 0.876 119.30 0.045
7.0 –1.394 22.95 0.163 0.802 122.11 0.046
7.6 –1.391 23.97 0.164 0.679 124.92 0.047
8.0 –1.389 24.82 0.166 0.557 126.34 0.047
8.6 –1.366 26.87 0.167 0.519 129.75 0.048
9.0 –1.351 28.04 0.170 0.501 132.09 0.048
9.6 –1.292 29.03 0.173 0.496 134.20 0.049
10.0 –1.220 29.75 0.194 0.489 136.36 0.049
10.6 –1.150 32.17 0.197 0.481 137.86 0.049
11.0 –1.113 34.09 0.205 0.478 143.58 0.049
11.6 –1.016 36.68 0.208 0.421 146.31 0.049
12.0 –0.882 38.22 0.215 0.448 147.94 0.050
12.6 –0.831 42.23 0.217 0.595 151.12 0.050
13.0 –0.775 43.97 0.217 0.887 154.35 0.052
13.6 –0.673 46.83 0.214 1.283 157.44 0.053
14.0 –0.616 48.15 0.206 1.642 161.10 0.051
14.6 –0.611 53.18 0.205 2.117 164.55 0.050
15.0 –0.676 56.07 0.197 2.243 167.83 0.049
15.6 –0.736 57.13 0.188 2.302 169.52 0.048
16.0 –0.824 57.82 0.183 2.116 170.38 0.047
16.6 –0.902 58.14 0.180 1.900 170.51 0.046
17.0 –0.978 58.34 0.177 1.673 170.92 0.046
17.6 –1.081 59.58 0.168 1.463 170.98 0.045
The differences between the mean values presented by this study up to 12–13 years of age and the CDC-2000 references were 4–6 cm lower. These values represent a deficit of height-for-age of about 3%, at an age close to reaching adult stature.
The M values, for body weight-for-age had a similar tendency to the measurements of
height-for-age. However, the differences between the measurements presented by the CDC-2000 reference and those presented in schoolchildren from the Jequitinhonha Valley, Minas Gerais, Brazil were more accentuated, clearly in older ages, which confirm a higher sensitivity of this growth parameter to environmental factors. At the ages preceding the expected biological maturation peak, the mean body weight of the girls of the present study presented values from 0.5 to 1.0 kg lower than the CDC-2000 references. In boys, the differences started at 0.6 kg at the age of 6 years and reached values of about 3 kg when close
Girls L Curve Boys
M Curve
S Curve
Valley of Jequitinhonha, Brazil
CDC - 2000 -2,0
-1,5 -1,0 -0,5 0,0
6 7 8 9 10 11 12 13 14 15 16 17 18 6 7 8 9 10 11 12 13 14 15 16 17 18
6 7 8 9 10 11 12 13 14 15 16 17 18 6 7 8 9 10 11 12 13 14 15 16 17 18
6 7 8 9 10 11 12 13 14 15 16 17 18 6 7 8 9 10 11 12 13 14 15 16 17 18
Box-CoxTransformation
-2,0 -1,5 -1,0 -0,5 0,0
Box-CoxTransformation
20 30 40 50 60 70
Mean (kg)
20 30 40 50 60 70
Mean (kg)
0,0 0,1 0,2 0,3
Age(years)
Coefficient of Variation
0,0 0,1 0,2 0,3
Age(years)
Coefficient of Variation
Figure 2. L,MandScurves of body weight-for-age for the subjects of the present study and for the CDC-2000
to 14 years of age. Then, with the advancing of age, the differences became progressively more accentuated in both genders, so that at 18 years of age the weight deficit reached values of about 3 kg in girls and of 6 kg in boys.
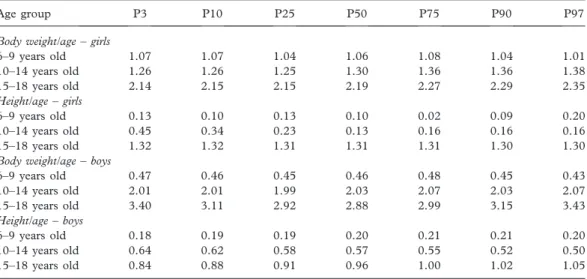
Comparisons of percentiles for height-for-age and for body weight-for-age in this study and the CDC-2000 reference confirmed the differences associated with gender and age related to the magnitude of physical growth deficits identified in the schoolchildren from the Jequitinhonha Valley, Minas Gerais, Brazil. Higher deficits were observed in the measure-ments of body weight-for-age in boys in the age segment from 15 to 18 years old.
When consulting the literature available in this area, it can be observed that differences with similar magnitudes to those found in the present study have also been identified in studies comparing distinct ethnic populations (Hasan et al. 2001; Hakeem et al. 2004; Marwaha et al. 2006; Neyzi et al. 2006; Davies 2007). It is possible and reasonable to speculate that these differences could be due to the genetic factors. However, it seems that
Girls L Curve Boys
M Curve
S Curve
Valley of Jequitinhonha, Brazil
CDC - 2000 -0,5
0,5 1,5 2,5
6 7 8 9 10 11 12 13 14 15 16 17 18
Box-Cox Transformation
-0,5 0,5 1,5 2,5
6 7 8 9 10 11 12 13 14 15 16 17 18
Box-Cox Transformation
100 120 140 160 180
6 7 8 9 10 11 12 13 14 15 16 17 18
Mean (cm)
0,00 0,02 0,04 0,06
6 7 8 9 10 11 12 13 14 15 16 17 18 Age (years)
Coefficient of Variation
0,00 0,02 0,04 0,06
6 7 8 9 10 11 12 13 14 15 16 17 18 Age (years)
Coefficient of Variation
100 120 140 160 180
6 7 8 9 10 11 12 13 14 15 16 17 18
Mean (cm)
Figure 3. L,MandScurves of height-for-age for the subjects of the present study and for the CDC-2000 reference
the hypothesis of genetic differences cannot be applied in this case, since in the early ages which precede the expected moment of peak biological maturation, there were similarities in the comparisons.
It is important to note that results obtained in a study with a sample from an industrialized region of Brazil (Guedes et al. 2009) showed no noticeable differences in weight and height from the CDC-2000 reference data, being, therefore, superior to the growth indicators of the sample in the present study.
In this context, there may be indications that the deficits observed in height and body weight measures per age presented for both genders, from the beginning of the process peak of biological maturation, could be associated with environmental conditions, which can restrict adequate physical growth. In fact, at this period there are extremely significant nutritional needs associated with physical growth, which demand a balanced contribution of the metabolic energy offer, amino acids, mineral salts and vitamins, essential to a large spectrum of physiological functions (Spear 2002). The contrast observed between girls and boys may be explained by gender differences in sensitivity to adverse environmental conditions. Although the mechanisms of these phenomena are still unknown, Stinson (1985) summarized several studies that show how boys are more sensitive to changes in the environment than girls. According to this author, boys under environmental stress conditions showed higher percentages of prenatal mortality, delays in physical growth, and higher incidence of contagious diseases.
On the other hand, the most important factor associated with physical growth identified in older ages may be related to the selected schoolchildren’s nutritional history. Recent social
advances and aid programmes available specifically for sections of the population from less developed regions in Brazil may have contributed to a greater physical growth profile for younger schoolchildren when comparing to older ones, considering that, a decade ago, when the adolescent schoolchildren were infants, there were almost no such programmes. This phenomenon has occurred in a similar way in other undeveloped and developing countries’ Table III. Differences between the percentiles presented by the CDC-2000 reference and by the schoolchildren of the Jequitinhonha Valley, Minas Gerais, Brazil 2007.
Age group P3 P10 P25 P50 P75 P90 P97
Body weight/age–girls
6–9 years old 1.07 1.07 1.04 1.06 1.08 1.04 1.01
10–14 years old 1.26 1.26 1.25 1.30 1.36 1.36 1.38
15–18 years old 2.14 2.15 2.15 2.19 2.27 2.29 2.35
Height/age–girls
6–9 years old 0.13 0.10 0.13 0.10 0.02 0.09 0.20
10–14 years old 0.45 0.34 0.23 0.13 0.16 0.16 0.16
15–18 years old 1.32 1.32 1.31 1.31 1.31 1.30 1.30
Body weight/age–boys
6–9 years old 0.47 0.46 0.45 0.46 0.48 0.45 0.43
10–14 years old 2.01 2.01 1.99 2.03 2.07 2.03 2.07
15–18 years old 3.40 3.11 2.92 2.88 2.99 3.15 3.43
Height/age–boys
6–9 years old 0.18 0.19 0.19 0.20 0.21 0.21 0.20
10–14 years old 0.64 0.62 0.58 0.57 0.55 0.52 0.50
15–18 years old 0.84 0.88 0.91 0.96 1.00 1.02 1.05
young populations, changing, in a positive way, the trend of physical growth in children and teenagers (Prista et al. 2003).
Conclusions
Using the information related to physical growth observed in this study we can conclude that, at younger ages, there were strong similarities between the data collected from the schoolchildren from the Jequitinhonha Valley, Minas Gerais, Brazil, and the data presented by the CDC-2000 references. However, deficits of height-for-age and body weight-for-age that increased with age were identified, despite the similarity of the increase presented by the curves of theL,MandSparameters of the present study and the CDC-2000 references after
the moment the process of biological maturation is expected to start reaching its peak. At the age of 18 years the analysed schoolchildren were 4–6 cm shorter and 3–6 kg lighter when compared with CDC-2000 references.
Based on the results found in this study and considering that information associated with physical growth has been found to be one of the most important indicators concerning the condition of global health and the quality of life of young populations throughout the world, the lower values of height-for-age and body weight-for-age observed in schoolchildren from the of Jequitinhonha Valley, Minas Gerais, Brazil, when compared to the CDC-2000 reference, suggest the need for adequate interventions as a way of correcting the existing distortions.
Declaration of interests:The authors report no conflicts of interest. The authors alone are responsible for the content and writing of the paper.
References
Alfaro E, Bejarano I, Dipierri J, Quispe Y, Cabrera G. 2004. Percentilos de peso, talla e índice de masa corporal de escolares jujeños calculados por el método LMS. Arch Argent Pediatr 102:431–439.
Ayatollahi SMT, Pourahmad S. 2006. Height and weight of school children of Shiraz in relation to the CDC growth charts and the previous study in Shiraz (15 years ago). JRMS 11:375–381.
Cole TJ. 1989. The British, American NCHS, and Dutch weight standard compared using the LMS method. Am J Hum Biol 1:397–408.
Cole TJ. 1990. The LMS method for constructing normalized growth standards. Eur J Clin Nutr 44:45–60. Cole TJ, Freeman JV, Preece MA. 1998. British 1990 growth reference centiles for weight, height, body mass index
and head circumferencefitted by maximum penalized likelihood. Stat Med 17:407–429. Davies PS. 2007. Growth charts for use in Australia. J Paediatr Child Health 43:4–5.
Gafni RI, Baron J. 2000. Catch-up growth: Possible mechanisms. Pediatr Nephrol 14:616–619.
Guedes DP, Guedes JERP. 2002. Crescimento, Composição Corporal e Desempenho Motor de Crianças e Adolescentes. São Paulo: CLR Balieiro.
Guedes DP, Martini FAN, Borges MB, Bernardelli R. Jr. 2009. Physical growth of schoolchildren: A comparison with the Centers for Disease Control and Prevention reference using the LMS method. Rev Bras Saúde Matern Infant 9:39–48.
Hamill PVV, Drizd TA, Johnson CL, Reed RB, Roche AF, Moore WM. 1979. Physical growth: National Center of Health Statistics Percentiles. Am J Clin Nutr 32:607–629.
Hakeem R, Shaikh AH, Asar F. 2004. Assessment of linear growth of affluent urban Pakistani adolescents according to CDC 2000 references. Ann Hum Biol 31:282–291.
Hasan MA, Batieha A, Jadou H, Khawaldeh AK, Ajlouni K. 2001. Growth status of Jordanian schoolchildren in military-funded schools. Eur J Clin Nutr 55:380–386.
Marwaha AY, Tandon N, Singh Y, Aggarwal R, Grewal K, Mani K. 2006. A study of growth parameters and prevalence of overweight and obesity in school children from Delhi. Indian Pediatr 43:943–952.
Mei Z, Yip R, Grummer-Strawn LM, Trowbridge FL. 1998. Development of a research child growth reference and its comparison with the current international growth reference. Arch Pediatr Adolesc Med 152:471–479. Neyzi O, Furman A, Bundak R, Gunoz H, Darendeliler F, Bas F. 2006. Growth references for Turkish children
aged 6 to 18 years. Acta Paediatr 95:1635–1641.
Ogden CL, Kuczmarski RJ, Flegal KM, Mei Z, Guo S, Wei R, et al 2002. Centers for Disease Control and Prevention 2000 Growth Charts for the United States: Improvements to the 1977 National Center for Health Statistics version. Pediatrics 109:45–60.
Onis M, Wijnhoven TMA, Onyango AW. 2004. Worldwide practices in child growth monitoring. J Pediatr 144:461–465.
Onis M, Onyango AW, Borghi E, Siyam A, Nishida C, Siekmann J. 2007. Development of a WHO growth reference for school-aged children and adolescents. Bull World Health Organ 85:660–667.
Palmert MR, Hirschhorn JN. 2003. Genetic approaches to stature, pubertal timing, and other complex traits. Mol Genet Metab 80:1–10.
Prista A, Maia JAR, Damasceno A, Beunen G. 2003. Anthropometric indicators of nutritional status: Implications forfitness, activity, and health in school-age children and adolescents from Maputo, Mozambique. Am J Clin Nutr 77:952–959.
Silventoinen K. 2003. Determinants of variation in adult body weight. J Biosoc Sci 35:263–285. Spear BA. 2002. Adolescent growth and development. J Am Diet Assoc 102(3 Suppl):S23–S29.
Stinson S. 1985. Sex differences in environmental sensitivity during growth and development. Am J Phys Anthrop 28:123–147.
UNDP (United Nations Development Programme). 2007. Human development report 2007/2008. UNPD: New York.