ESTUDOS DO ISCA – SÉRIE IV – Nº10 (2014)
HIGHER EDUCATION AND QUALITY ASSESSMENT SYSTEM:A NEW APPROACH BASED ON STUDENTS PERCEPTION António Augusto dos Santos Soares Universidade Federal de Santa Catarina - SC – UFSC – Brasil [email protected]
Carla Susana Marques Universidade de Trás os Montes e Alto Douro – UTAD [email protected]
Hugo de Almeida Universidade de Aveiro – Centro de Investigação em Marketing e Análise de Dados (CIMAD) [email protected] Ester Fraga Vilas-Bôas Carvalho do Nascimento
Universidade Tiradentes - Brasil [email protected] Pedro António de Melo Universidade Federal de Santa Catarina – UFSC – Brasil [email protected] Rafael Pereira Campos Moré Universidade Vale do Itajaí – UNIVALI - Brasil [email protected] Ana Filipa Pinheiro Gomes Universidade de Aveiro [email protected] Abstract
Over the past 10 years has seen an increasing number of students in higher university system, both in the traditional courses and in technological courses. This new group has quite different behaviors in relation to what was established as a student "model" to the university system, pushing constantly the institutions of higher education to meet this new demand, not only with technological innovation processes, but mainly new teaching methods and contents that attract the interest of the new group.
What people expect is that the more IES has being aware of the need for change, better it will be prepared to implement programs and services that meet the expectations and perceptions of students. Governments, on the other hand, with their regulatory models and their proposals for review and supervision, insist on indicators that are not always perceived by students as references to their perceptions of educational quality.
Given this situation, the aim of this article is to make a comparative study which evaluates the importance degree of what students, considered "digital generation", attribute seconded by official instruments as indicators of quality in higher education factors.
Keywords: quality, digital generation, evaluation model
Resumo
Ao longo dos últimos 10 anos tem-se assistido ao crescimento de o número de estudantes no sistema de ensino superior, tanto nos cursos tradicionais como em cursos tecnológicos. Este novo grupo tem comportamentos diferenciados em relação ao que foi estabelecido como um "modelo" de estudante para o sistema universitário, levando as instituições de ensino superior a serem constantemente forçadas a atender a essa nova demanda, não só com os processos de inovação tecnológica, mas, principalmente, para novos métodos de ensino e conteúdos que atraiam o interesse deste novo grupo.
O que as pessoas esperam é que quanto mais as IES estejam cientes da necessidade de mudança, melhor elas vão estar preparadas para implementar programas e serviços que atendam as expectativas e percepções dos alunos. Os governos, por outro lado, com os seus modelos de regulação e as suas propostas para a revisão e supervisão, insistem em indicadores que nem sempre são percebidos pelos alunos como sendo elaborados para as suas percepções da qualidade do ensino.
Perante esta situação, o objetivo deste artigo é fazer um estudo comparativo que avalie o grau de importância dos alunos, considerados "geração digital", atributo esse destacado por instrumentos oficiais como indicadores de qualidade em fatores de ensino superior.
Palavras-chave: Qualidade, geração digital, modelo de avaliação
1. INTRODUCTION
In Brazil, in the period between 2001 and 2012, the enrollment in higher education doubled from 3.5 million to just over 7 million students. The average age of these students was 26 years, and 50 % have up to 24 years (INEP 20131).
In Portugal, the number of students in 2012 was 390.273, and has remained virtually the same over the past 10 years, with a slight decrease between 2011 and 2012. The average age is 21 years, with up to 23
years are 80 % of the enrolled population (PORDATA 20132).
To analyze the profile of the current situation of students in higher education in Brazil and Portugal especially, as their needs and perceptions, it is important to distinguish the profile of this population, not only as their "names, but especially as to their habits and relationship models.
As Regnier (2011) says, " ...the generations define themselves and differentiate from a set of valuesthat emerge from specific historical conditions (social economic events technological, demographic, and others), and become dominant or emblematic of an era. Young people are the most frequent carriers of these values because they are exposed to in their formative era (early youth). These values tend to structure their conduct ways of seeing and being in the world) throughout their lives. But they are not immutable, they can gain or lose strength depending on the stage in the life cycle and new events that present themselves".
To better understand this situation, those born from 1981 to 1995 are referred to as Generation Y, those born from 1996 are classified as Generation Z, which has as main feature the intense use of digital media and social networks as process communication and social structure. (Regnier, 2011)
According to Queiroz at all (2002, p. 4): "Schooling is generally perceived by young people as a means to achieve better jobs and, consequently, better living conditions. In this sense, the existing fallacy - the relationship between level of education and secure employment with better earnings, and consequent increase in quality of life - ultimately direct the goals and expectations of the young. Thus, the efforts invested in their schooling assume the meaning of guarantee better future, even though, to some extent, understand the limitations of the precarious conditions in which it takes place and the few concrete results that the school can provide”.
2. HIGHER EDUCATION IN BRAZIL AND SINAES
In 1996, with the massification of higher education in Brasil, the federal government, has no reliable information on higher education, implemented a set of actions, which were aimed to build a database and specific information that could assist the government the implementation of public policies and actions for higher education under the guidance of the World Bank and UNESCO. These public policies and actions involved the institutional planning, institutional assessment, and quality of educational services provided by higher education institutions (HEIs).
Created by Law No. 10.861, of April 14th 2004, the National System of Higher Education Assessment (SINAES) consists of three main components: the assessment of institutions, courses and student performance. The SINAES evaluates all aspects revolving around these three areas: teaching, research, extension, social responsibility, students performance, the management of the institution, faculty, facilities and various other aspects.
According to the report of the Higher Education Assessment Special Commission (CEA), designated by Ordinance MEC / SESu on 11 April 28th 2003 and 19 May 27th 2003, "the proposed "National System of Evaluation Higher Education" (SINAES) was to ensure, among other things, the integration of internal
1www.inep.gov.br - Accessed on 29/03/14 2www.pordata.pt - Accessed on 29/03/14
and external, private and global, summative and formative, quantitative and qualitative dimensions and the various objects and purposes of the review. The evaluation system aimed to articulate a coherent, concepts, objectives, methodologies, practices, members of the academic community and government bodies. Protected the specifics, the degrees of authority and responsibilities of each group of agents, the evaluation system is a construction to be undertaken collectively with functions of information for decision-making of political, pedagogical and administrative, institutional improvement, self- regulation, empowerment, increased educational capacity and the performance of other public duties".
Also according to the report, "beyond the idea of integration and articulation is also central in the concept of this system participation. Ethical requirement of educational processes calls on all agents of the higher education community, the concerned institutions, government bodies and members of society, to engage in evaluative actions, respecting the roles, characteristics and scientific expertise, professional, formal, political, administrative of distinct categories. In this sense, evaluation is not only undeniable technical-administrative and compliance with legal requirements, but especially the ethical imperative of building and consolidation of institutions and the higher education system with high scientific value and social reasons".
SINAES is grounded in institutional reviews, courses and students and has the following structure and dimensions:
- Institutional, internal and external evaluation, considering 10 dimensions: Mission and PDI; policy for teaching, research, graduate and extension; social responsibility of HEIs; communication with society; the personnel policies, the careers of the body teaching and technical-administrative; management organization of the HEI; physical infrastructure; planning review; attendance policies for students and financial sustainability.
- Assessment of courses with 3 dimensions: Organization Training; Faculty Profile; physical facilities.
- Assessment of students through ENADE which is periodically applied to students in all undergraduate courses at the end of the first and last year of course. The evaluation will be expressed through concepts, based on minimum standards set by experts from different fields of knowledge.
A very important aspect to note is that there is no institutionally opportunity to consult the students and their perception of quality of their academic experience, except during ENADE, when it held an economic partner search.
3. HIGHER EDUCATION IN PORTUGAL AND ASSESSMENT SYSTEM
According Freitas & Verhine (2010), "Europe in the large-scale assessments were intensified with the creation of the EU (European Union) and the Bologna Declaration that in the search for greater student mobility between member countries, established a convergence between the organizational structures of the systems and harmonization of curricula. Diplomas and certificates began to be granted under certain standardization and, as a consequence, there are more homogeneous in respect of skills to be acquired, the content to be taught, the length and types of courses to be offered”.
Also according Freitas & Verhine (2010), "this time, it happens in Portugal to move from a system marked by self-assessment to a system characterized by hetero of higher education. Thus, the new system features a heteronomous character, whether in relation to the initiative to open up further evaluation, it ceases to belong primarily to educational institutions, and in relation to the responsibility for the results of the evaluation, which also follow a character external (AMARAL. 2007; Monteiro de Freitas, 2010) . It is in light of this change in focus that comes the need for creation of an independent agency for quality assurance of higher education with absolute externality, whether over the interests of the evaluated entities, whether from government".
Through Decree-Law No 369 /2007 of 5th November 2007, the Agency for Assessment and Accreditation of Higher Education, which will assume responsibility for the quality assurance procedures, this level of education is created in particular the evaluation and accreditation, as well as the inclusion of Portugal in the European system of quality assurance in higher education.
Their creation is an important step towards the implementation of a national system of quality assurance in higher education, independent, internationally recognized, whose main objective is to provide improved quality of performance of higher education institutions and their cycles studies and ensure compliance with the basic requirements of their official recognition.
Freitas & Verhine (2010) says that, "the process of accreditation by the Agency for Assessment and Accreditation of Portugal is based on mandatory compliance with quality indicators by educational institutions. Once defined the criteria base, the base standards or minimum requirements, courses are accredited or not. No course can work without the accreditation given by the agency. In the context of Portugal, assessment and accreditation have different objectives but are complementary and inseparable: Review aims to promote quality education, research, cultural action and action in the external environment developed by the institutions, while the accreditation is intended to fulfill the minimum requirements leading to official recognition of institutions and programs evaluated. The quality assessment is the responsibility, first, of their own HEI. The external evaluation, in turn, is carried out by committees designated by the agency and is aimed at quality assurance and validation of internal mechanisms for quality assurance (audit) and expressed in recommendations expressed in three gradations accreditation: accredited, conditionally accredited and non- believed (Monteiro de Freitas, 2010)”.
In 2013, the Agency promoted student participation in accreditation activities experimentally, however, their presence has happened in a limited number of the external review. The participation depended on the interest and IES was optional, ie only were evaluated by committees integrating those students who were willing to do so.
Based on the results of this experimental procedure, i.e., the responsiveness of institutions is shown by the A3ES assess the feasibility on student participation in the assessment process on a regular basis.
4. STUDENTS IN THE EDUCACIONAL PROCESS
According to Castro (2010), "the development of information systems and evaluation became a key part of the process of educational reforms which have taken place in several countries, mainly from the mid- 80s. With the aim of supporting actions to improve the quality, ratings began to give greater visibility and transparency to key aspects of the learning process:
- What are students learning?
- Evaluation results correspond to what is expected of them at the end of cycles or different levels of learning?
- Which factors may explain the positive or negative outcomes of education systems?
- What is the degree of equity observed on learning outcomes? As the social, economic and cultural inequalities of a given society focus on learning opportunities?
- What school characteristics decrease the impact of socioeconomic level on learning outcomes?" According Schleich, A.L.R., at al, 2006, page 11): “Note in some countries, and especially here in Brazil, the commitment by the government to open more vacancies (Pinto, 2004). However, there is still the same commitment to the adequacy of facilities, and educational and diversity politics, the characteristics and expectations of this population processes. Perhaps this is due to lack of systematic knowledge about Brazilian student”.
Still as Schleich (ALR, at al. 2006, page 12) says: "Scholars seek to better understand the interaction between the institution and the students and the changes caused from this interaction, building
instruments capable of characterizing the student and determine the lived experience during training academic satisfaction is among the variables analyzed by researchers interested in the area. However, Astin (1993) considers that the number of studies on this construct is less than would be necessary given its importance".
5. THE RESULTS OF THE SURVEY
For this work was used as a working tool to "scale of satisfaction with the academic experience (ESEA)", considering that such a document had its validation both in Brazil and in Portugal (Schleich, at al., 2006). To compare qualitative variables we used the chi-square test or Fisher's exact test if the assumptions are not checked. To compare quantitative variables in two groups t test was used if the assumptions are not verified considered the nonparametric Mann- Whitney. For comparison of quantitative variables in more than two groups was considered the ANOVA, or nonparametric test Kurskal - Wallis if not the assumptions are verified. To test the normal distribution was considered the Kolmogorov-Smirnov test, whereas for homogeneity of variance was considered Levene's test. In all tests was considered a level of significance α = 0.05.
Respondents were 158 subjects, 82 (51,9%) were female and 76 (48,1%) males. All respondents are students, 34 students (21,5%) studying in Brazil and 124 (78,5%) in Portugal. In Brazil, UCB college students were surveyed, and 19 (55,9%) attended the 7th semester and 15 (44,1%) the 8th semester. In Portugal, there were 30 respondents (24,2%) students of Management UTAD and 94 (75,8%) of the AU, these being distributed by the Finance courses (23,4%) , accounting (21,3%) and marketing (55,3%). The 30 respondents in UTAD are attending the 6th semester, whereas the respondents were students of the AU 2nd and 6th semester in the proportion 80,9% and 19,1% respectively. Respondents students are aged between 18 and 58 years, with an average age of 22 years. Table 1 shows the age distribution by age group and institution. As can be seen in the analysis of the results, 96,67% of the respondents were from UTAD that have at most 23 years old, only one respondent was aged at this institution outside this range, it fits into the group with ages in the range [36,40]. Also on UA occurs the same trend, i.e., the proportion of students with maximum age 23 years is significantly higher than other age groups, although it has been a greater distribution of students by remaining cases. Still in UA, we verified the existence of a student over 50 years. The institution UCB there was a different to those seen in Portuguese institutions trend. The age group most represented in this institution's students with [24,30] , with 47.06 % . Not significantly different from the observed proportion of students with maximum age 23 years old, can be an indicator of a trend for students attending the institution at a later age. Just as the AU, there was a student with more than 50 years attending UCB.
TABLE 1-DISTRIBUTION BY AGE AND INSTITUTION
Age UTAD UA UCB
N % N % N % <=23 29 96,67 79 84,04 15 44,12 [24,30] 0 0,00 9 9,57 16 47,06 [31,35] 0 0,00 3 3,19 0 0,00 [36,40] 1 3,33 0 0,00 2 5,88 [41,50] 0 0,00 2 2,13 0 0,00 [>=50] 0 0,00 1 1,06 1 2,94
Lets look deeper to registered students aged over 50 years old, seeking featuring them. As already mentioned, two students were registered at this age. One such case, an individual female with 53 years of
age, was recorded at UCB. This student does not perform paid work and found himself at the time of the survey, the 8th semester of the course. In terms of satisfaction, this student shows up, in general, completely satisfied with the course and institution that attends, classifying it with a total score of 170 points. Reveals only the security of the institution, the physical infrastructure of classrooms, review proposed by the teachers, the availability of teachers and matching tasks and set time to perform, as being less satisfactory factors. Still, the questions referred ranked as 'very satisfied'.
The other record was observed in the UA, a student male with 58 years of age is employed with a full-time paid work. This student attended the 6th semester of Marketing and proves, in general, very satisfied with the course and the institution ranking with a total score of 142 points. This student turns out to be somewhat satisfied with the adequacy of the tasks and the time set for the meeting. Furthermore, is only satisfied with the personal involvement in the course, the physical infrastructure of the classrooms, the physical infrastructure of the institution, the programs offered financial support and the comfort of. Of the total respondents, 39 (24%, 7%) reveal students combine studies with a paid activity. Analyzing these results by country, there are significant differences, while in Brazil 79,4% of students in paid activity, this proportion falls to 9.7 % in Portuguese students.
Analysis of satisfaction:
Only 3 (1,9 %) of 158 respondents reveal that do not want to continue attending the course.
Note: In the analysis of each of the following tables, only the highlighted issues getting at least 20 % of responses to satisfaction 'Little Satisfied', or that the combination of 'Little Satisfied' and 'Not Satisfied' is also higher or equal to 20%.
Tables 2, 3 and 4 show the overall results for the questions to measure the degree of satisfaction of students.
TABLE 2–OVERALL RESULTS FOR EACH QUESTION (1 TO 14)
Unsatisfied Somewhat Satisfied Satisfied Satisfied Very Satisfied Totally
N % N % N % N % N %
1. Relationship with teachers 0 0,00 1 0,63 47 29,75 96 60,76 14 8,86
2. Diversity of extracurricular activities
offered by the institution 2 1,27 40 25,32 62 39,24 51 32,28 3 1,90
3. Course Curriculum 0 0,00 7 4,43 60 37,97 77 48,73 14 8,86
4. Audiovisual equipment and resources
available in the institution 9 5,70 25 15,82 54 34,18 55 34,81 15 9,49
5. Relationship with colleagues Course 0 0,00 5 3,16 24 15,19 78 49,37 51 32,28
6. Social events offered by the institution 6 3,80 20 12,66 66 41,77 56 35,44 10 6,33
7. Care and clarity of the information
offered by Secretarial staff 5 3,16 15 9,49 74 46,84 42 26,58 22 13,92 8. Adequacy of personal involvement in
the course and academic performance
achieved 0 0,00 1 0,63 62 39,24 82 51,90 13 8,23
9. Personal involvement in course
activities 0 0,00 14 8,86 72 45,57 61 38,61 11 6,96
10. Programs or support services offered
to students by the institution 0 0,00 27 17,09 71 44,94 51 32,28 9 5,70
11. Conditions offered to my
professional development (knowledge
and skills to act) 0 0,00 12 7,59 59 37,34 71 44,94 16 10,13
12. Interest of teachers to answer
students during class 2 1,27 1 0,63 21 13,29 93 58,86 41 25,95
13. Teachers' knowledge about the
content of the subjects they teach 0 0,00 4 2,53 18 11,39 71 44,94 65 41,14
14. Recognition by teachers of my
TABLE 3–OVERALL RESULTS FOR EACH QUESTION (15 TO 30)
Unsatisfied Somewhat Satisfied Satisfied Satisfied Very Satisfied Totally
N % N % N % N % N %
15. Equipment and software offered by
the Computer Lab 3 1,90 25 15,82 62 39,24 52 32,91 16 10,13
16. Care and clarity of the information
offered by library staff 0 0,00 16 10,13 52 32,91 62 39,24 28 17,72 17. Conditions for entering professional
training area (insertion strategies and
contact with the world of work) 1 0,63 21 13,29 65 41,14 60 37,97 11 6,96 18. Available collection in the library 1 0,63 5 3,16 39 24,68 79 50,00 34 21,52
19. Security offered by the institution
(concierge, security guards) 6 3,80 14 8,86 44 27,85 64 40,51 30 18,99
20. Physical infrastructure of classrooms 5 3,16 25 15,82 85 53,80 33 20,89 10 6,33
21. Commitment of the institution to
quality training 0 0,00 9 5,70 51 32,28 82 51,90 16 10,13
22. Physical infrastructure of the
institution 4 2,53 13 8,23 69 43,67 55 34,81 17 10,76
23. Financial support program offered
by the institution 5 3,16 20 12,66 81 51,27 42 26,58 10 6,33
24. Opportunity for personal
development offered by the institution 2 1,27 11 6,96 71 44,94 65 41,14 9 5,70
25. Evaluation proposed by teachers 2 1,27 4 2,53 51 32,28 85 53,80 16 10,13
26. Adequacy of financial investment to
fund my studies and training received 3 1,90 11 6,96 49 31,01 77 48,73 18 11,39
27. Cleanliness of the institution 2 1,27 24 15,19 52 32,91 47 29,75 33 20,89
28. Strategy used by classroom teachers 1 0,63 8 5,06 69 43,67 67 42,41 13 8,23
29. Services offered by the library 1 0,63 4 2,53 53 33,54 71 44,94 29 18,35
30. Comfort of the facilities of the
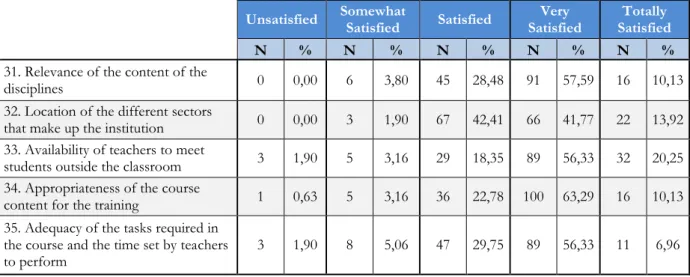
TABLE 4–OVERALL RESULTS FOR EACH QUESTION (31 TO 35)
Unsatisfied Somewhat Satisfied Satisfied Satisfied Very Satisfied Totally
N % N % N % N % N %
31. Relevance of the content of the
disciplines 0 0,00 6 3,80 45 28,48 91 57,59 16 10,13
32. Location of the different sectors
that make up the institution 0 0,00 3 1,90 67 42,41 66 41,77 22 13,92 33. Availability of teachers to meet
students outside the classroom 3 1,90 5 3,16 29 18,35 89 56,33 32 20,25 34. Appropriateness of the course
content for the training 1 0,63 5 3,16 36 22,78 100 63,29 16 10,13 35. Adequacy of the tasks required in
the course and the time set by teachers
to perform 3 1,90 8 5,06 47 29,75 89 56,33 11 6,96
Analysis of the results presented in Tables 2, 3 and 4 some issues stand out against the high level of dissatisfaction among students. One example is the question 2, in which 25,32 % of respondents are assumed somewhat satisfied regarding extra curricular activities offered by the institution they attend. In order to achieve classify each institution, according to the degree of satisfaction of students a score that is the sum of satisfaction experienced by each question was calculated. Thus, for each respondent student obtains a score representing the degree of satisfaction. The maximum score will correspond to cases in which the student attaches a maximum degree of satisfaction (5 - totally satisfied) in all matters, and this maximum 175 points. Then we will introduce a comprehensive descriptive analysis of the scores obtained.
TABLE 5–DESCRIPTIVE MEASURES TO SCORE
The analysis of Table 5 it can be seen that, on average, students classify institutions studied regarding the degree of satisfaction with 125 by 175 points possible. It may also be noted that the maximum rating given by a student to an institution of 170 points. On the other hand, there is a minimum score of 86 points. Table 6 shows the descriptive statistics distributed by age groups are represented.
TABLE 6–DESCRIPTIVE MEASURES TO SCORE BY AGE RANGE Minimum Maximum Mean deviation Standard Total
Score 86,00 170,00 125,1582 14,56089
Total score
Age
Range Minimum Average Median Maximum <=23 96,00 123,41 123,00 152,00 [24,30] 86,00 131,08 136,00 157,00 [31,35] 110,00 127,33 135,00 137,00 [36,40] 122,00 133,67 132,00 147,00 [41,50] 100,00 111,50 111,50 123,00 [>=50] 142,00 156,00 156,00 170,00
We present then the results of the satisfaction score by institution and, in the case of Portuguese institutions, per course.
TABLE 7–DESCRIPTIVE MEASURES TO SCORE BY INSTITUTION Institution Minimum Maximum Average Standard deviation
UTAD 106,00 136,00 118,5000 9,41294
UA 96,00 157,00 125,4043 13,52204
UCB 86,00 170,00 130,3529 18,63506
It may be noted that students attending UCB has an average higher than the two institutions Portuguese satisfaction score. In addition, the distribution of scores in the UCB is significantly different. The AU also reveals an average score higher satisfaction with the UTAD, however no significant differences were detected in the distribution of scores between the two institutions.
TABLE 8–DESCRIPTIVE MEASURES TO SCORE BY INSTITUTION AND COURSE (PORTUGUESE INSTITUTIONS) Institutions Course Minimum Maximum Average Standard deviation
UTAD Management 106,00 136,00 118,5000 9,41294
UA
Marketing 96,00 152,00 125,5800 14,54632 Finance 97,00 157,00 124,8636 14,89422 Accounting 108,00 169,00 128,4000 13,50400
Regarding courses, it can be seen that the accounting course AU has an average score higher than the other courses studied in Portuguese institutions satisfaction. Moreover, the course management UTAD has the lowest average score among the courses. The observed differences are not statistically significant.
TABLE 9–DESCRIPTIVE MEASURES TO SCORE A POINT IN THE COURSE Point in the
course Minimum Maximum Average Standard deviation 2nd semester 96,00 157,00 124,6974 12,82708 6th semester 96,00 151,00 122,2083 13,15692 7th semester 86,00 156,00 133,8947 16,95712 8th semester 99,00 170,00 125,8667 20,25504
For the analysis of Table 9, it appears that the students of 7th semester assign an average score higher than students in other semesters satisfaction. This difference is statistically significant.
6. CONCLUSION
We do not want to say from this study that the instruments used in Brazil and in Portugal are flawed and need to be modified in any way, but rather to shed light on the problem at this point has been surfacing. Although the students were satisfied and only 3% of the sample have informed you do not want to follow in higher education it is clear that they want "something extra" that not only the recipe so far offered. Students have expectations and perceptions of quality that are not fully measured by the instruments now used for the evaluation and supervision of higher education.
One has to ask the student how he wants to actively participate in contributing to a better understanding of their needs and desires.
This "Digital Generation" who now attends college education has other models compared with the system that are not those that supported the construction of valuation models.
It may be noted that in some way the teachers are trying to "speak" the language of this new generation, but it does not solve the problem, because in some institutions dissatisfaction with the institution is very relevant.
This study is still quite limited and need to make further research with the use of instruments, as used here, to try to give a new shape to the evaluation process.
So even with the limitations set out, we hope this study can be useful for the continuation of studies, so that new phenomena can be captured and improve academic satisfaction.
7. BIBLIOGRAPHY
A3ES. Normas para avaliação externa. Available at: www.a3es.pt/pt/avaliacao-e- acreditacao/normas-para-avaliacao. Accessed on 30/03/2014.
AMARAL, A. A reforma do Ensino Superior Português. In: Políticas do ensino superior: Quatro te- mas em
debate. Conselho Nacional de Educação, Lisboa, Portugal, 2007.
CASTRO, Maria H. G. (2010) A Consolidação da Política de Avaliação da Educação Básica no Brasil. [On-line].
Available at: http://metaavaliacao.cesgranrio.org.br/index.php/metaavaliacao/article/view/51/30 . Accessed on 29/03/2014.
FREITAS, Antônio A. S. M. Avaliação da educação superior: um estudo comparativo entre Brasil e Portugal. Tese de Doutorado, Progra- ma de Pós-Graduação em Educação, Universida- de Federal da Bahia. Salvador, BA, 2010.
FREITAS, Antônio A. S. M. & VERHINE, R. E. A avaliação da educação superior: modalidades e tendências
no cenário internacional. [On-line]. Available at:
http://www.revistaensinosuperior.gr.unicamp.br/edicoes/ed07_outubro2012/ARTIGO_PRINCIPAL.p df . Accessed on 29/03/2014.
LUCKESI, Cipriano C. Avaliação do aprendizado escolar: estudos e proposições. 8ª ed. São Paulo: Cortez, 1998. MOREIRA, A. Novos caminhos de Santiago. In: COLÓQUIO CNAVES. Temas do Processo de Bolonha. Lisboa: Fundação Oriente, 2005.
RÉGNIER, K. (2011). Gerações em persperctiva: Suas características e a relação com o mundo do trabalho. [On-line]. Available at: http://www.slideshare.net/Macroplan/as-novas-geraes-em-perspectiva-suas-caractersticas-e-relao-com-o-mundo-do-trabalho . Accessed on 29/03/2014.
SCHLEICH, Ana L. R., SOELY A. J. P. & SANTOS, Acácia A. A. - Escala de Satisfação com a Experiência Acadêmica de Estudantes do Ensino Superior - Avaliação Psicológica, 2006, 5(1), pp.11-20.
SINAES. Da concepção à regulamentação. 4. ed. Brasília: INEP, 2007.
UNESCO. Política de mudança e desenvolvimento no ensino superior. Trad. Laura Ferrantini Fusaro. Rio de Janeiro: Garamond, 1999.
VERHINE, Robert E. O novo alfabeto do Sinaes: Reflexões sobre o IDD, CPC e IGC. In: DALBEN A.; DINIZ J.; LEAL L.; SANTOS L. Convergências e tensões no campo da formação e do trabalho docente. Belo Horizonte: Autêntica, 2010, p. 632-650.