Paula Lopes, Patrícia Costa*, Luisa Araujo and Patrícia Ávila
Measuring media and information literacy
skills: Construction of a test
https://doi.org/10.1515/commun-2017-0051
Abstract: Research on media and information literacy has been growing
expo-nentially over the past years, but it has focused more on the examination of media practices than on the assessment of media and information literacy skills. In this paper we describe the process of designing and implementing a Media and Information Literacy Test comprising 20 items. We present the re-sults of the analysis carried out to validate the items and to construct a scale of media and information literacy skills using Item Response Theory (IRT). Findings indicate that the conceptual framework adopted is adequate to mea-sure media and information literacy and that the test has good discrimination and difficulty parameters. The test is based on a more comprehensive frame-work used to assess media and information literacy skills than those used in previous studies and can be used on an item-by-item basis. In this sense, it is a novel contribution to current efforts to measure media and information litera-cy skills.
Keywords: media and information literacy, direct assessment of media and
in-formation literacy skills, Item Response Theory
1 Introduction
Media literacy is believed to have a relevant impact on citizenship practices, as repeatedly conveyed by politicians and academics since the 1980s (Bucking-ham, 2003; Gonnet, 2001; Livingstone, 2011a, 2011b; Martinsson, 2009) and by international organizations such as UNESCO (1982, 1990, 1999, 2002, 2006, Paula Lopes, UAL – Autónoma University of Lisbon, Communication and Society Research Centre – Minho University (CECS-UM), Lisbon, Portugal, E-mail: [email protected] *Corresponding author: Patrícia Costa, Human Capital and Employment Unit, Ispra, Italy, E-mail: [email protected]
Luisa Araujo, Human Capital and Employment Unit, Ispra, Italy, E-mail: [email protected]
Patrícia Ávila, ISCTE-IUL – University Institute of Lisbon, Centre for Research and Studies in Sociology (CIES-IUL), Lisbon, Portugal, E-mail: [email protected]
2007, 2008, 2009, 2011, 2012, 2013a, 2013b) the Council of Europe (2000, 2002, 2008) and the European Commission (2007a, 2007b, 2008a, 2008b, 2009a, 2009b). Importantly, it has the potential to increase the ability of citizens to interpret media messages critically and to communicate messages effectively (Zacchetti, 2011). The concept of “media literacy” itself was first defined by the Media Literacy Expert Group in 2006 as “the ability to access media, to under-stand and critically evaluate the different aspects of the media and media con-tent and to create communications in a variety of contexts” (European Commis-sion, 2007a). A few years later, UNESCO defined Media and Information Literacy (MIL) as “a set of competencies that empowers citizens to access, re-trieve, understand, evaluate and use, to create as well as share information and media content in all formats, using various tools, in a critical, ethical and effective way, in order to participate and engage in personal, professional and societal activities” (2013b). As an evolving concept, “media” and “information” literacies have become integrated.
Today, citizens have access to a variety of media content and can place content online to communicate ideas, to react and to participate in discussions. New forms of communication, namely social media (like blogs, microblogging, internal wikis and collaborative software, social networks), have emerged and people need the skills to interpret what others say, to evaluate how publicity may influence choices and to select reliable information from search engines (European Commission, 2009a). Social inclusion in the information society is thus not only dependent on the ability of citizens to manipulate technology, but on their literacy skills (media, information, news, digital and many others). A media literate individual is one that communicates effectively and is able to create messages (Zacchetti, 2011). This ability to communicate effectively, in turn, will help ensure that individuals can exercise an active citizenship and contribute to democracy (European Commission, 2007b). Indeed, the Council of Europe (2008) has called for the identification and promotion of good media literacy practices exactly because they can increase the quality of information and contribute to a plurality of views.
While the construction and application of questionnaire surveys about me-dia practices, such as type of meme-dia read and number of hours spent interacting with different media have already been developed (EAVI, 2011; Ofcom, 2012, 2013, 2016, for example), research on the direct assessment of media and infor-mation literacy skills is scarce. More specifically, the instruments designed to date have only provided insights on topic-specific media knowledge with re-stricted student populations. For example, Primack et al. (2006) developed a scale that measures smoking media literacy, Paul Mihailidis (2008) measured how media literacy can make students more engaged citizens, and Arke and
Primack (2009) designed an instrument that measures college students’ ability to process media messages. In the latter study, only 34 students composed the sample, and they were all college students enrolled in a communication course. Moreover, their ability to create media messages was not tested. Similarly, the media literacy test developed by Ashley, Maksl and Craft (2013) measured news media literacy alone, and the participants were college students taking a news media course or a journalism course. In Portugal, studies on media and infor-mation literacy skills assessment started to be developed in the last decade (Lopes, Pereira, Moura and Carvalho, 2015). More recently, the work developed by the Iberian-American Alfamed network seeks to capture the media literacy competences of students and teachers from different educational levels [www.redalfamed.org]. In some countries such as Portugal, data is being col-lected during 2017 and countries’ results are expected shortly thereafter. This paper describes the first research conducted in Portugal designed to measure media and information literacy using a direct assessment of competencies (Lopes, 2014), and so far the only one using Item Response Theory to analyze the results.
The media and information literacy test presented in this paper provides a new tool to assess media and information literacy beyond news consumption and encompasses a wider range of cognitive abilities. Moreover, this instrument is based on a broader framework of media and information literacy knowledge and skills that assesses respondents’ ability to generate or create media mes-sages. Also, the test has been applied to a large sample of adult students follow-ing secondary and tertiary education programs, and Item Response Theory was used to analyze the results. This procedure has the advantage of producing a scale composed of items that are calibrated according to difficulty levels and discrimination parameters that are independent of the tested population and the items used. These psychometric properties enable the development, evalu-ation and administrevalu-ation of a standardized measurement providing more accu-rate and consistent results.
Additionally, IRT allows the efficiency of the instrument to be checked, and new items can be inserted in the scale constructed to measure media and information literacy skills. Finally, the construction of a scale using IRT guaran-tees that the respondents are located on the same scale, allowing comparisons between respondents, between items and between respondents and items. As such, IRT is a reliable procedure for testing media and information literacy skills, and it will enable the establishment of relationships with other dimen-sions, such as media practices and citizenship practices.
This article describes the media and information literacy test and presents an analysis of the 20 items comprising it, as well as the methodology followed
to construct and validate the media and information literacy scale. We consid-ered the overall proficiency level, and the analysis is carried out considering socio-demographic characteristics. The scales constructed enable a direct evaluation of media skills – citizens’ ability to deal with media information, to interpret it and to act with it/on it.
2 The construction of the Media and Information
Literacy Test
The Media and Information Literacy Test was conceptualized and developed on the basis of different conceptual and assessment frameworks (Lopes, 2015). First, test construction was informed by major extensive literacy studies, such as the International Adult Literacy Survey (IALS), the Adult Literacy and Life Skills Survey (ALL) and the Programme for the International Assessment of Adult Competencies (PIAAC) conducted by the Organisation for Economic Co-operation and Development (OECD, 2013). Second, the construction of the test was informed by research in the field of media and information literacy (Arke, 2005; Arke and Primark, 2009; EAVI, 2009, 2011; Hobbs and Frost, 2003; João and Menezes, 2008; Mihailidis, 2008; Quin and McMahon, 1991, 1995; UNESCO, 2011) and cognitive psychology (Morais, 2002, 2010; Rumelhart, 1977).
While the literature about media literacy and cognitive psychology was particularly useful in the operationalization of cognitive operations, the under-standing of the journalistic text informed the construction of text items in terms of content selection and item design (Deacon, Fenton, and Bryman, 1999; Fairclough, 1995; Mathieu, 2009; Tuchman, 1978; van Dijk, 1983a, 1983b, 1988, 1990, 2002, 2008, 2009). Images and texts were selected according to the fol-lowing criteria: They should be examples of those that readers are likely to encounter in a typical media environment and comply with the adopted assess-ment framework. That is, the items should include different formats (images, contiguous and non-contiguous texts), different types of media channels (infor-mative, opinion) and call for different cognitive tasks. For example, the Apple logo (item example #1) was selected because several studies indicate that it is a highly visible image and a valuable brand in the media environment (www.forbes.com). In the case of the contiguous text that asks for the interpre-tation of media-related information (item example #2), the Journalist Code of Ethics calls for deductive reasoning as a cognitive task. With respect to the items that are opinion texts, these were published in the digital versions of the two most widely sold weekly newspapers in the country, Expresso and SOL. That was the case of item example #3 that discusses sexual discrimination.
The test was designed as a “printed booklet test”. Although we were aware that media and information literacy requires the ability to use technology to access information and to communicate, the administration of the test on a computer was not an option due to time constraints and lack of funding. The alternative was to select materials from different sources (printed and digital), which were the basis for the design of several tasks/questions posed to respon-dents using a paper-and-pencil test. These materials covered different item types and formats.
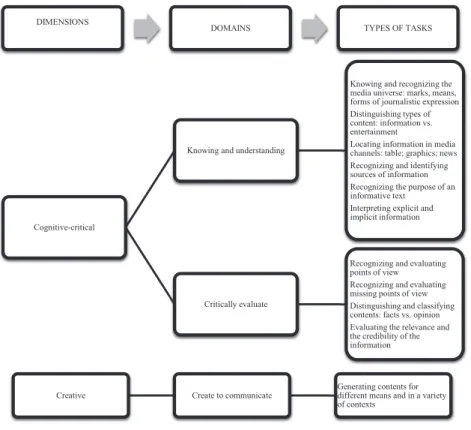
The construction of the tasks/questions was based on a conceptual model that included two major dimensions: cognitive and critical, and creative. The cognitive and critical dimension was oriented to evaluate whether respondents: a) identify and recognize media content; b) locate information; c) understand and interpret the purpose of a message; and d) critically evaluate information. The creative dimension was designed to evaluate the respondents’ skills con-cerning the generation of contents. These require the selection of information, the ability to mobilize background knowledge and the capacity to construct a media message, which in any media literacy test is a more time-consuming task. Still, we managed to include two media generation items, and our frame-work assumes that news literacy is an integral part of media literacy (Mihailidis, 2008). Thus, some items are representative of the journalistic genre by includ-ing information usually encountered in the media (Figure 1).
We followed the model of Kirsch, Jungeblut and Mosenthal (1998) applied in IALS and in ALL to define the structure variables and the process variables. The first set of variables refers to the different media channels, classified ac-cording to the format, the source means and the type of information. The sec-ond set refers to the process variables that capture the information-processing operations, or cognitive strategies, necessary to accomplish the tasks: locating and identifying, integrating and interpreting, evaluating and reflecting and generating (Figure 2). These cognitive strategies are similar to those currently considered in the assessment frameworks of different International Large-Scale Assessments (ILSA) of primary school students (e.g., The Program for Interna-tional Reading Literacy Study – PIRLS) and of secondary school students (PISA) (Araújo, Morais, and Costa, 2013), as well as in surveys of adult skills, such as PIAAC (OECD, 2016). In all ILSA, the levels of difficulty validated using IRT models for the various items in the tests reflect increasingly demanding cogni-tive operations with the most complex tasks measured by a smaller number of items. Similarly, our test included fewer items requiring the generation of media content, a choice also motivated by the need to keep respondents engaged and avoid high non-response rates.
Our conceptual framework resulted in a matrix that guided the construction of the test and ensured that it would integrate media channels and tasks of a
DIMENSIONS
DOMAINS TYPES OF TASKS
Cognitive-critical
Knowing and understanding
Knowing and recognizing the media universe: marks, means, forms of journalistic expression Distinguishing types of content: information vs. entertainment
Locating information in media channels: table; graphics; news Recognizing and identifying sources of information Recognizing the purpose of an informative text Interpreting explicit and implicit information
Critically evaluate
Recognizing and evaluating points of view Recognizing and evaluating missing points of view Distinguishing and classifying contents: facts vs. opinion Evaluating the relevance and the credibility of the information
Creative Create to communicate
Generating contents for different means and in a variety of contexts
Figure 1: Dimensions, domains and types of tasks.
Structure variables: Process variables:
Format of the media channel:
Continuous text Non-continuous text Image Source: Printed Digital Type of information: Textual informative Textual opinion Textual prescriptive Visual informative Visual opinion Visual instrumental
Type of cognitive strategy:
(N1) Locating and identifying (N2) Integrating and interpreting (N3) Evaluating and reflecting (N4) Generating
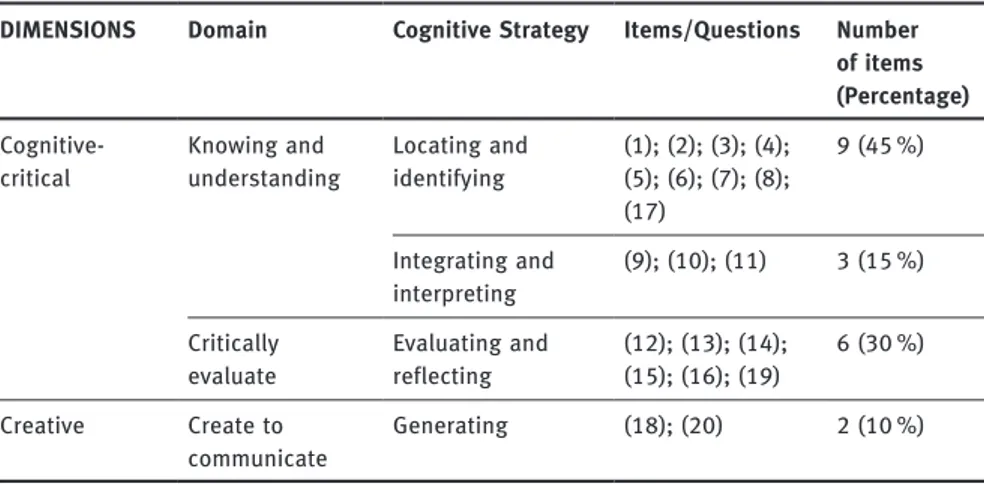
variety of types and degrees of difficulty. All the tasks (constructed response, open-ended and multiple-choice tasks) were classified according to the expect-ed degree of difficulty in four levels. The most difficult tasks are those that result from the cross-checking of more complex cognitive operations and more complex media channels. For example, generating content is a more complex cognitive process than locating and identifying information. Similarly, texts are more complex than images. Thus, a task that combines generating content about a text is expected to be more difficult than one that requires identifying or naming an image. In summary, the test was operationalized as follows:
Table 1: Media and Information Literacy Test: Item classification.
DIMENSIONS Domain Cognitive Strategy Items/Questions Number
of items (Percentage) Cognitive- Knowing and Locating and (1); (2); (3); (4); 9 (45 %) critical understanding identifying (5); (6); (7); (8);
(17)
Integrating and (9); (10); (11) 3 (15 %) interpreting
Critically Evaluating and (12); (13); (14); 6 (30 %) evaluate reflecting (15); (16); (19)
Creative Create to Generating (18); (20) 2 (10 %)
communicate
3 Examples of the test items
Below are some examples of media channels and respective tasks according to the expected levels of difficulty covered by the Media and Information Literacy
Test.1For each example a summary table is also provided with item
characteris-tics and item classification according to the conceptual model used to design the test.
1 To ensure that test questions can be included and used as a bank of items, the whole instrument is not presented.
Example 1: Level 1 task
Level 1 task example: Item characteristics and item classification
– Item characteristics:
Format of the media channel: Image
Type of channel: Visual instrumental – Logo Source means: Digital
Purpose: Recognizing and identifying a sign from the media universe: Brand – Item classification:
Dimension: Cognitive-critical
Domain: Knowing and understanding Cognitive strategy: Locating and identifying Example 2: Level 2 task
Journalist Code of Ethics
1. The journalist must report facts with rigor and accuracy and interpret them in a truthful way. The facts must be checked by consulting interested parties. The distinction between factual informational news and an opinion must be made clear to the reader.
2. The journalist must fight censorship and sensationalism and consider both accusations without proof and plagiarism as serious professional faults. 3. The journalist must fight against restrictions to access informational
sour-ces, attempts to limit freedom of expression and the right to inform. 4. The journalist must use legal means to obtain information, images or
docu-ments and refrain from abusing the good will of people. It is the rule of law to identify oneself as a journalist, and any deviation from this must be justi-fied for reasons of public interest.
5. The journalist must assume responsibility for his or her work and profession-al conduct, as well as promote the rectification of information that has been proved inexact or false.
After reading the “Journalist Code of Ethics”, indicate whether the following state-ment is true (T) or false (F):
Level 2 task example: Item characteristics and item classification
– Item characteristics:
Format of the media channel: Continuous text
Type of channel: Textual prescriptive: “Journalist Code of Ethics” Source means: Printed
Purpose: Interpreting implicit information and inferring by deduction – Item classification:
Dimension: Cognitive-critical
Domain: Knowing and understanding
Cognitive strategy: Integrating and interpreting Example 3: Level 3 task
Conquering is forbidden
A priori, I have the same feelings for rapists as I have for murderers. That is, disgust and repulse, and I wish to see them in jail. This is in relation to the public protest of the Slutwalks. Let us trace the story. A ridiculous Canadian police officer went to the University of Toronto to defend the strange idea that the best way for women to avoid being raped was to stop dressing themselves as sluts.
This happened in January and since then emotions took over of helpless girls that protested in more than 70 cities worldwide. Dressed to kill, as nuns or cheaply-dressed, many held signs saying they have the right to present them-selves as sluts, without this giving anyone the right to bother them. I couldn’t agree more, provided that they are careful about the street corners they walk by. But let us go back to the actual sluts. They also say on the signs that they can dress as they wish and that they don’t want to be bothered. That is, they don’t want to hear compliments or experience any attempt of seduction. But has the world gone mad? How would the world be without seduction? We would click a button on the internet and desire would fire? I couldn’t agree more that people should not bother each other. Yet, that they cannot show they like something is silly.
Portuguese sluts on the street to protest
Low-cut necklines, mini-skirts, laced tights, push-up pants, high heels (of course), provocative dresses: Next Saturday, Portuguese women will let their imagination loose (and their wardrobe too) to go out into the streets for their first “Slutwalk”.
They started in April and I must admit that I have been following with curiosity the proportions these “Slutwalks” against machismo have reached. The idea came from a group of Canadian women, after the statement of a police
officer who said that “women should avoid dressing provocatively if they don’t want to be raped”. The indignation of the high heels world spread like a fuse, and the Slutwalk reached over 70 cities, from Sidney to London and Brasilia. Could this be a sign that the silly comments of this police officer are, after all, common in these diverse countries? So it seems.
Yesterday I read the statement of the Portuguese walk and it made sense to me. I wrote this sentence here several times: Nothing justifies rape. And if we need to go to the street, barely dressed, in protest so that people understand this, then so be it. I make the street walk statement my own.
After reading the texts from Vítor Rainho and Paula Cosme Pinto, answer the following question: “In your opinion, are there any references that may be consid-ered discriminatory?” Justify your answer with some examples.
Level 3 task example: Item characteristics and item classification
– Item characteristics:
Format of the media channel: Continuous text Type of channel: Textual opinion
Source means: Digital
Purpose: Recognizing and evaluating the author’s point of view (the argu-ment)
– Item classification:
Dimension: Cognitive-critical Domain: Critically evaluate
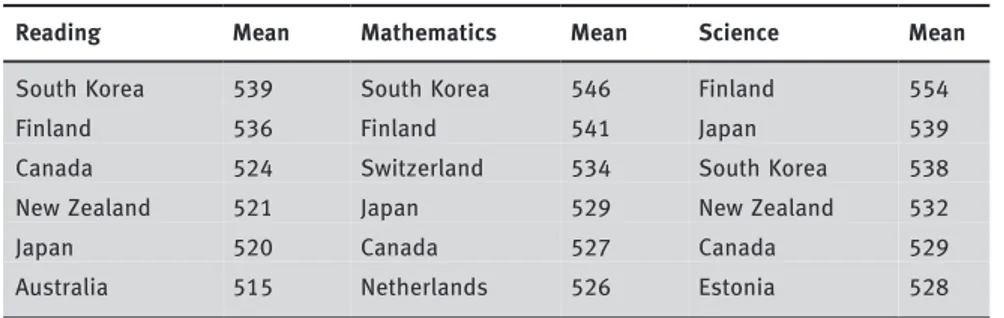
Cognitive strategy: Evaluating and reflecting Example 4: Level 4 task
Reading, mathematics and science results of 15-year-old students.
Table 1: The rankings of the competencies assessment in PISA 2009 (reading, mathematics and sciences).
Reading Mean Mathematics Mean Science Mean
South Korea 539 South Korea 546 Finland 554
Finland 536 Finland 541 Japan 539
Canada 524 Switzerland 534 South Korea 538
New Zealand 521 Japan 529 New Zealand 532
Japan 520 Canada 527 Canada 529
Table 1 (continued)
Reading Mean Mathematics Mean Science Mean
Netherlands 508 New Zealand 519 Australia 527
Belgium 506 Belgium 515 Netherlands 522
Norway 503 Australia 514 Germany 520
Estonia 501 Germany 513 Switzerland 517
Switzerland 501 Estonia 512 United Kingdom 514
Poland 500 Iceland 507 Slovenia 512
Iceland 500 Denmark 503 Poland 508
United States 500 Slovenia 501 Ireland 508
Sweden 497 Norway 498 Belgium 507
Germany 497 France 497 Hungary 503
Ireland 496 Slovakia 497 United States 502
France 496 Austria 496 Check Republic 500
Denmark 495 Poland 495 Norway 500
United Kingdom 494 Sweden 494 Denmark 499
Hungary 494 Check Republic 493 France 498
Portugal 489 United Kingdom 492 Iceland 496
Italy 486 Hungary 490 Sweden 495
Latvia 484 Luxembourg 489 Austria 494
Slovenia 483 United States 487 Latvia 494
Greece 483 Ireland 487 Portugal 493
Spain 481 Portugal 487 Lithuania 491
Check Republic 478 Spain 483 Slovakia 490
Slovakia 477 Italy 483 Italy 489
Israel 474 Latvia 482 Spain 488
Luxembourg 472 Lithuania 477 Luxembourg 484
Austria 470 Greece 466 Greece 470
Lithuania 468 Israel 447 Israel 455
Turkey 464 Turkey 445 Turkey 454
Chile 449 Bulgaria 428 Chile 447
Bulgaria 429 Romania 427 Bulgaria 439
Mexico 425 Chile 421 Romania 428
Romania 424 Mexico 419 Mexico 416
Source: PISA 2009
Statistically significantly above the OECD average.
Not statistically significantly different from the OECD average. Statistically significantly below the OECD average.
Write a news article, to be published in a major Portuguese daily newspaper (for example, the newspaper “Público”). Use the news lead basic structuring scheme (what happened, to whom, where, when, how and why).
Level 4 task example: Item characteristics and item classification
– Item characteristics:
Format of the media channel: Non continuous (table) Type of channel: Visual informative: Info graphic Source means: Printed
Purpose: Selecting, organizing and generating information, taking into account the nature of the means (press)
– Item classification: Dimension: Creative
Domain: Creating to communicate Cognitive strategy: Generating/creating
4 Method
The implementation of the empirical research was based on a quantitative ex-tensive methodology and involved the application of a questionnaire survey – for the examination of media practices and citizenship practices – and a Media and Information Literacy Test – for the evaluation of media and information literacy skills. In this article we describe only the construction and results of the Media and Information Literacy Test. The study was conducted using a quota sample of the adult population participating in different types of educa-tional training, namely primary, secondary and higher education programs in the greater Lisbon area. The selection of students was proportional to the weight in the population of each type of educational program. For the students enrolled in higher education, the sample was proportional to the weight of the major scientific fields (arts and humanities, social sciences, natural sciences, engineering, health and social protection). Data was collected by the research team who visited the educational institutions where adults were in training and administered the questionnaire and the paper-and-pencil test individually without time limit.
The media literacy profile of the participants drawn from the media practi-ces questionnaire revealed that the population sampled engaged in diverse me-dia literacy practices. For example, while some adults read newspapers every day, other rarely did so. Thus, the heterogeneity of the sample in terms of age, educational level and literacy profiles is characteristic of the adults in the
great-er Lisbon area. This in conjunction with the use of IRT methodology makes it possible to validate test items and to gain an understanding of the media litera-cy skills of adults.
4.1 Participants
The sample was comprised of about 500 adults attending some level of educa-tion (primary, secondary, higher) during the school year of 2011–2012 in the Greater Lisbon area. In our sample, 9.8 % of the respondents attended primary education, 15.6 % attended secondary education and 74.6 % attended different higher education courses and pursued different degrees. The respondents at-tending primary and secondary education were adults completing continuing education certification programs. The university level students came from dif-ferent institutions of higher education in Lisbon. At the time of the test, the ages of the respondents varied between 18 and 81, with an average age of 27 years old. There was a slight female dominance in this sample: 57.9 % of the respondents were women.
4.2 Procedure
We used Item Response Theory (IRT) for the purpose of constructing a scale that reflects the respondents’ skills in Media and Information Literacy. IRT is used to estimate the proficiency level of a respondent and to produce precise information about each test item. With IRT it is possible to represent the rela-tion between the probability of an examinee to respond correctly to an item and its latent factor in the field of knowledge to be evaluated. Thus, the relation established is expressed in such a way that the higher the latent factor, the higher the probability to answer correctly to the item. The relation between the performance in the item and the latent factor is described through an increas-ingly monotone function named Item Characteristic Curve (ICC).
We analyze the Media and Information Literacy Test data using IRT model-ling and specifically using the Generalized Partial Credit Model – GPCM (Mu-raki, 1992, 1997), which is theoretically adequate for polytomous items and in which the discrimination (α̂) and difficulty (β̂) parameters are considered fac-tors that influence the choice of answers and characterize respondents. The discrimination parameter tells us how effectively an item can discriminate be-tween highly proficient respondents and less-proficient respondents. Lower val-ues for the difficulty parameter are associated with easier items. The GPCM indicates that the probability of a student responding to the answer category k
is given as the conditional probability on categories k−1 and k, that is, it states the points in the latent factor scale where an answer becomes relatively more probable than the preceding one, in view of the fact that the respondent has completed the previous steps.
The item parameter and latent factor estimates, the performance (ability) in media and information literacy, are obtained through the application of the Marginal Maximum Likelihood (MML) estimation procedure using the EM algo-rithm (Baker and Kim, 2004). Estimation using this procedure is performed using the Parscale software (Muraki and Bock, 2002). In the analysis of the test items using IRT, we present the estimates of the discrimination and difficulty parameters. In order to validate the methodology, we also evaluated the ade-quacy of the theoretical model for the empirical data, the information function
of the test2– IFT – (Muraki, 1993) and the measurement error.
5 Results
In order to construct the media and information literacy scale, first the psycho-metric properties of the items are presented followed by the presentation of the features of the overall scale. Performing this two-step statistical analysis guarantees the reliable measurement of media and information literacy skills because the overall scale is composed of items of good quality.
5.1 Item parameters
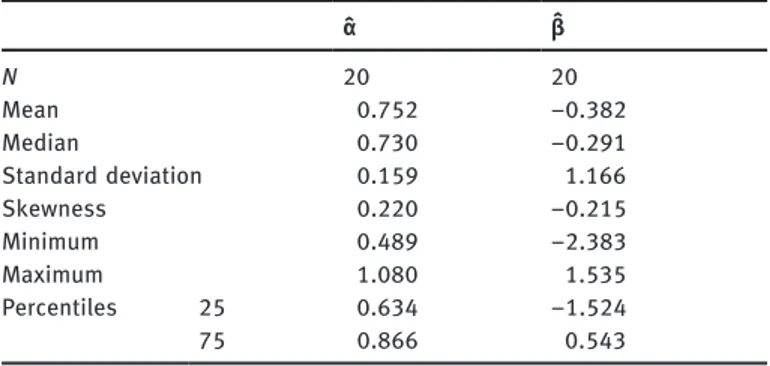
Descriptive statistics of the item parameter estimates – discrimination and diffi-culty – are shown in Table 2. Items 4, 5, 12, 13, 14, 15 and 20 have three answer categories (correct/partially correct and incorrect), while the remaining test items are dichotomous (correct/incorrect). The descriptive statistics of the item parameter estimates calculated using IRT show that the distribution of the item discrimination parameter estimate is asymmetric, the mean is equal to 0.752, the median is equal to 0.730, and skewness is equal to 0.220. Regarding the difficulty parameter, the distribution’s mean is equal to −0.382, the median is equal to −0.291 and has a negative skew (skewness = −0.215). Therefore, the distribution is asymmetric with a long tail to the left. These findings indicate that the 20 test items are mostly easy and of medium difficulty.
2 IFT is used to assess the performance levels where each of the tests is more or less discrimi-native.
Table 2: Descriptive statistics of the item parameter estimates. α̂ β̂ N 20 20 Mean 0.752 −0.382 Median 0.730 −0.291 Standard deviation 0.159 1.166 Skewness 0.220 −0.215 Minimum 0.489 −2.383 Maximum 1.080 1.535 Percentiles 25 0.634 −1.524 75 0.866 0.543
Table 3: Item parameter estimates.
Item α̂ β̂ 1 0.940 −1.908 2 0.489 0.215 3 0.668 −1.676 4 0.723 −2.383 5 0.809 −2.309 6 0.963 −0.773 7 0.882 −0.778 8 0.625 0.291 9 0.736 −1.520 10 0.593 −0.418 11 0.790 −1.534 12 0.507 1.535 13 0.570 0.161 14 0.953 1.024 15 0.828 0.633 16 0.861 −0.164 17 1.080 −0.558 18 0.654 0.869 19 0.724 0.514 20 0.637 1.131
The GPCM model estimates rendered the item parameter estimates shown in Table 3.
The items with the highest discrimination parameters are items 1, 5, 6, 7, 14, 15, 16 and 17, while the less discriminative are items 2, 10, 12 and 13, even though the latter have acceptable discrimination parameters. Regarding the
Table 4: Classification of the test items in terms of discrimination and difficulty parameters. Items classification
Discrimination Limits Items Number of items
Little discriminative < 0.4 – 0
Discriminative [0.4; 1[ 1, 2, 3, 4, 5, 6, 7, 8, 9, 10, 11, 12, 19 13, 14, 15, 16, 18, 19, 20
Very discriminative ≥ 1 17 1
Difficulty Limits Items Number of items
Easy [−3; −1[ 1, 3, 4, 5, 9, 11 6
Medium [−1; 1[ 2, 6, 7, 8, 10, 13, 15, 16, 17, 18, 19 11
Difficult [1; 3] 12, 14, 20 3
difficulty parameter estimates, larger β̂-values represent more difficult items. Thus, the most difficult items are items 12, 14 and 20, while the easiest are items 4 and 5.
Table 4 presents the item classification according to the estimates of the discrimination and difficulty parameters.
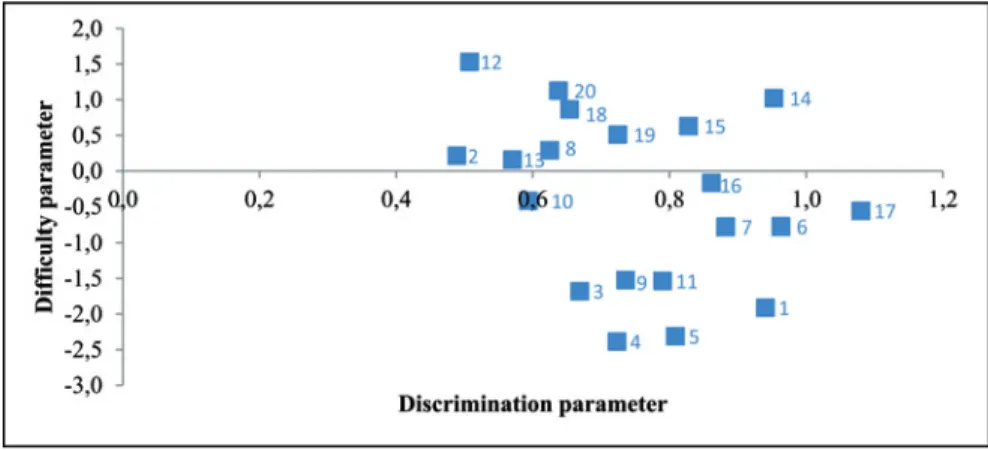
The graphic representation of the items’ dispersion, according to the dis-crimination and difficulty parameters, is shown in Figure 3.
These analyses indicate that almost all items are discriminative and that the discriminative items fall into all levels of difficulty. From the 19 items of medium discrimination, six items are easy (1, 3, 4, 5, 9 and 11), ten items are of medium difficulty (2, 6, 7, 8, 10, 13, 15, 16, 18 and 19) and three items are
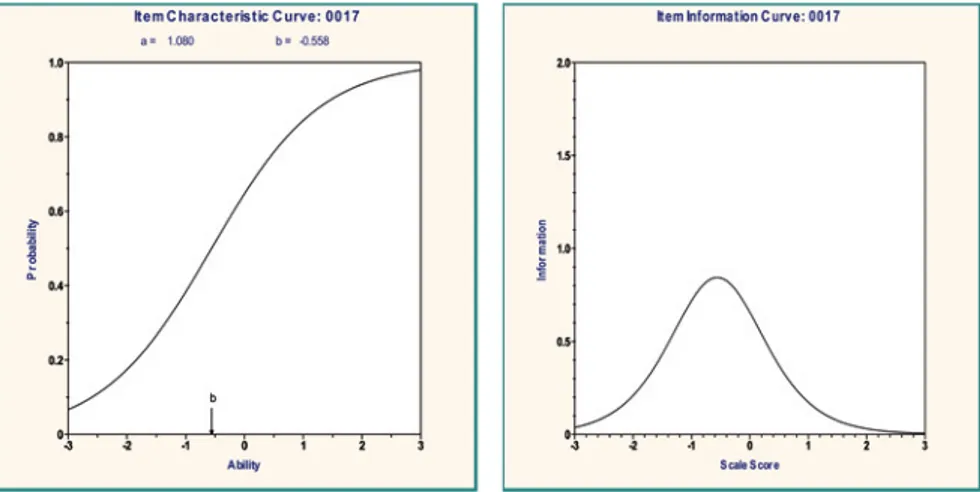
Figure 4: Item 17 characteristic curve and information function – 2 categories.
difficult (12, 14, 20). Item 17, which is very discriminative, is of medium diffi-culty.
Comparing the difficulty item parameters with item classification, 30 % of the items are easy, and all of them are from the “Knowing and Understanding” area of analysis. Of these, 20 % measure tasks related with “Locating and Iden-tifying”, and 10 % assess tasks related with “Integrating and Interpreting”. Ad-ditionally, 15 % of the items are difficult, and they were classified in the areas of “Critically Evaluate” and “Create to Communicate” (10 % and 5 %, respectively). Next, as an example we present the characteristic curve and the information function for two of the test items with two and three answer categories, respec-tively.
Item 17 (Figure 4) is dichotomous and was answered correctly by 67.2 % of the respondents. It can thus be considered an item of medium difficulty, which is confirmed by the difficulty parameter estimate, and by the observation of the horizontal axis of the item characteristic curve. The ICC of this item is “S”-shaped with a good power of discrimination between different levels of ability, which is corroborated by its estimate. It is an item of medium difficulty, and the slope of the ICC shows that the item presents a good discrimination among respondents with ability around −0.5. The item information function shows a strong contribution of item 17 for the information function of the test, namely for respondents with low and medium performance.
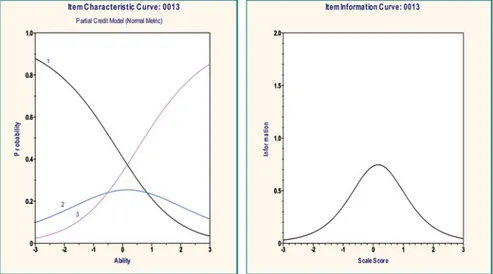
Item 13 (Figure 5) has three answer categories, and 38.9 % of the respon-dents answered the question correctly, 44.9 % gave an incorrect answer and 16.2 % obtained a partially correct item score. Therefore, and considering also
Figure 5: Item 13 characteristic curve and information function – 3 categories.
the difficulty parameter estimate, the item is of medium difficulty. Regarding the discrimination parameter estimate, this item is discriminative.
This item’s characteristic curve is composed of three curves referring to the item answer categories. As the figure shows, answer category 1 has higher probability for lower performance levels, category 2 demonstrates higher prob-ability for intermediate performance levels, although inferior to the other cat-egories, and that category 3 demonstrates higher probability for higher per-formance levels. Thus, the information function reflects a good contribution to the test, particularly for respondents presenting low and medium scores in the media and information literacy scale.
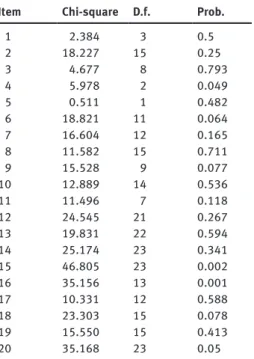
The analysis of the GPMC model adjustment to the data, based on the statis-tics of the chi-square test, shows that only items 4, 15 and 16 do not adjust to the model and that all the remaining are adjusted to the proposed model (Table 5).
The information function of the test (Figure 6) contributes with a larger amount of information mainly regarding respondents presenting a performance between −1 and 1. Since there is an increase in the measurement error for per-formance levels higher than 2, this suggests that this test contributes less dis-crinating respondents with a high performance level.
Table 5: Statistics of adjustment to the model.
Item Chi-square D.f. Prob.
1 2.384 3 0.5 2 18.227 15 0.25 3 4.677 8 0.793 4 5.978 2 0.049 5 0.511 1 0.482 6 18.821 11 0.064 7 16.604 12 0.165 8 11.582 15 0.711 9 15.528 9 0.077 10 12.889 14 0.536 11 11.496 7 0.118 12 24.545 21 0.267 13 19.831 22 0.594 14 25.174 23 0.341 15 46.805 23 0.002 16 35.156 13 0.001 17 10.331 12 0.588 18 23.303 15 0.078 19 15.550 15 0.413 20 35.168 23 0.05
Figure 6: Information function of the test and standard error of the test.
6 Media and information literacy scale
Table 6 presents the descriptive statistics of the respondents’ scores/ability in media and information literacy, estimated using IRT from the answers to the 20 items of the test.
Table 6: Descriptive statistics of the respondents’ scores distribution.
Scores in media literacy
N Valid 510 Missing 2 Mean .0000 Median .1804 Standard deviation 1.00098 Skewness −.697
Standard error of skewness .108
Amplitude 5.92
Minimum −3.25
Maximum 2.66
Percentiles 25 −.5486
75 .6966
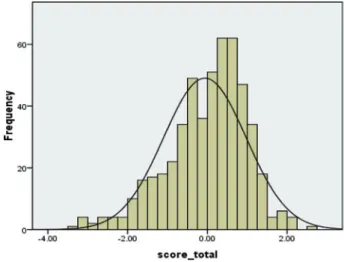
The distribution of the estimate of the students’ performance in media and information literacy, resulting from the GPCM model, is presented in the histo-gram below.
The previous table and figure show that the respondents’ scores in the test vary between −3.25 and 2.66. The distribution of the respondents’ scores is asymmetrical with a long tail to the left (skewness = −0.697 and standard er-ror = 0.108). The mean of the respondents’ scores is zero, and the median is equal to 0.18.
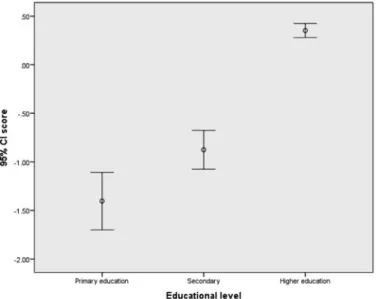
Figure 8: Error bars representing the 95 % confidence interval by educational level.
With respect to the differences in adults’ scores by socio-demographic charac-teristics, statistically significant differences were not observed between males and females (t = −1.372 with p > 0.05). For the comparison of the respondents’ scores by educational level (primary, secondary and higher education) statisti-cally significant differences were found among all the educational levels, as the error bars below show. The mean for the lowest educational level was −1.40, −0.88 for the intermedium level and 0.35 for the highest educational level. As expected, adults with a higher educational level perform better in media and information literacy.
7 Discussion and conclusions
We designed a media and information literacy test and analyzed it using IRT to measure the ability of respondents to deal with media information, to inter-pret it and to act with it/on it. The results indicate that almost all items are discriminative or very discriminative and fall into all levels of difficulty (diffi-cult, medium and easy), with a special incidence at the medium level. The analysis of the adjustment of the model to the data (chi-squared test) indicates that items present a good fit to the model, with the exception of three of the twenty items. Additionally, results indicate that the test contributes with a
larg-er amount of information regarding respondents with low and medium plarg-er- per-formance levels. That is, it contributes less to discriminate among respondents with a high performance level. Thus, this media and information literacy test is a methodologically appropriate tool that assesses empirically the underlying literacy skills’ theoretical framework. As such, it constitutes a valid instrument to measure adults’ ability to respond to and create media and information liter-acy content. Future efforts should address the need to design more items that pertain to creating media content. It is possible that if the test had included more difficult items with good discrimination parameters, it would have con-tributed more to discriminate respondents with a high performance level.
According to the conceptual framework, the three difficult items (#12, 14 and 20) reflect higher-order cognitive operations: the ability to critically evalu-ate content and the ability to generevalu-ate content (see Table 1). Thus, they required the respondents to act on the information. In this sense, the empirically tested information about these items is in accord with what was expected given the underlying conceptual framework. Tasks that require higher levels of informa-tion processing are more difficult, and items that call for identifying and inte-grating information are easier. As the examples of test items show, item 1 was defined as level 1, item 10 as level 2, and item 15 as level 3. The IRT analysis confirmed that the first is easy and the other two are of medium difficulty. That is, locating and identifying information (item 1) is easier than integrating and interpreting information (item 10) and this, in turn, is easier than evaluating content (item 15).
Considering the media and information literacy skills by gender, the find-ings show that no statistically significant differences were found between males and females. These results are partially in line with the findings from PIAAC (OECD, 2013), which showed that in half the countries surveyed, the differences on the literacy scale by gender are not statistically significant. However, it should be noted that PIAAC does not measure media and information literacy skills, and that so far Portugal did not participate in this survey. Conversely, we found a positive association between educational level and the respondents’ media and information literacy scores, and these results are consistent with findings from PIAAC. In this survey, as expected, people with lower levels of education also present lower literacy skill levels in all participating countries (OECD, 2013).
In this study, the application of IRT enabled the analysis of the test items, thus contributing to a better understanding of the respondents’ performance when submitted to this type of instrument. More specifically, the use of IRT to assess media and information literacy skills enabled the validation of the test items, highlighting the importance of the application of this statistical
proce-dure for the evaluation of the skills of respondents of different educational and age levels, as well as of adults in general. Importantly, because we used IRT, the test can be used on an item-by-item basis or as a bank of items for the assessment of media and information literacy skills. If these items are applied to other respondents, the estimates of the item parameters will be invariant.
Given that the respondents’ scores are estimated according to the character-istics of the items – difficulty and discrimination – this ensures that the respon-dents with the highest media literacy proficiency answered correctly the most difficult items. Thus, the use of IRT guarantees that an item level analysis of media literacy is measured properly. Using classical test theory, it would not have been possible to have information at the item level or to take into consid-eration item characteristics in the respondents’ scores. As such, IRT facilitates the interpretation of the scale produced and enables the comparison of the results from different groups of individuals, even when partially different tests are applied. The use of IRT also makes it possible to assess the evolution of a measurement across time, in this case the measurement of media and informa-tion literacy skills.
In short, this study makes some notable contributions to the field of media and information literacy. The aim of this project was to construct a media and information literacy test informed by assessment frameworks used in other large-scale studies. Findings show that it is possible to design good quality test items using the conceptual framework we adopted. Results also show that the test discriminates well among people with low and medium proficiency levels, but less well among people with higher ability levels. In this sense, if the aim is to capture the skill level of high-ability adults, it is desirable to design items that can discriminate among subjects at higher ability levels. Future research should address this issue and also try to incorporate tasks that assess digital media abilities. Our instrument included an item that called for writing a tweet, but did not test the ability to actually post it. However, research indicates that digital skills and competences can be intertwined with literacy skills. For exam-ple, in the 2012 digital PISA round, the higher the quality of internet navigation (e.g., number of clicks to relevant links), the higher students scored in reading, even after controlling for their print reading skills (OECD, 2015). A policy rele-vant message from this finding is that, as Hatlevik, Guðmundsdóttir and Loi (2015) highlight, the development of digital competences implies strategic use of information. In this sense, educational policies that encompass teaching dig-ital skills from an early age should be encouraged so that the citizens of tomor-row can critically interpret and create media messages.
In conclusion, the construction and analysis of the Media and Information Literacy Test, an instrument for the assessment of media and information
litera-cy skills, resulted in the creation of an “item bank” with information on the specific characteristics of each item. This bank – composed of a set of calibrat-ed, discriminative items with different levels of difficulty – enables the assess-ment of media and information literacy skills and can be used in different tests and/or moments. In this sense, the construction and application of this instrument is a significant methodological contribution to the assessment of media and information literacy knowledge. Therefore, this work provides a sci-entifically robust and methodologically valuable contribution to the research on media and information literacy skills.
Disclaimer: The views expressed are purely those of the writers and may not in
any circumstances be regarded as stating an official position of the European Commission.
References
Araújo, L., Morais, J., & Costa, A. 2013. Assessments of reading comprehension: Different measures, different explanatory variables and achievement. L1-Educational Studies in Language and Literature 13. 1–21.
Arke, E. 2005. Media literacy and critical thinking: Is there a connection? (PhD thesis). Pittsburgh: Duquesne University.
Arke, E. T., & Primack, B. A. 2009. Quantifying media literacy: Development, reliability and validity of a new measure. Educational Media International 46(1). 53–65.
Ashley, S., Maksl, A., & Craft, S. 2013. Developing a news media literacy scale. Journalism & Mass Communication Educator 68. 7–21.
Baker, F., & Kim, S. 2004. Item Response Theory: Parameter estimation techniques. New York: Marcel Dekker.
Buckingham, D. 2003. Media education: Literacy, learning and contemporary culture. Cambridge: Polity Press.
Council of Europe 2000. Media Education (Recommendation 1466).
Council of Europe 2002. Recommendation 12. Recommendation on education for democratic citizenship.
Council of Europe 2008. Recommendation of the Committee of Ministers to member states on measures to promote the respect for freedom of expression and information with regard to internet filters.
Deacon, D., Fenton, N., & Bryman, A. 1999. From inception to reception: The natural history of a news item. Media, Culture and Society 21. 5–31.
EAVI – European Association for Viewers Interests. 2009. Study on assessment criteria for media literacy levels. Final report. Brussels: European Commission.
EAVI – European Association for Viewers Interests. 2011. Media literacy: Testing and refining criteria to access media literacy levels in Europe. Final Report. Brussels: European Commission.
European Commission. 2007a. Communication from the Commission to the European Parliament, the Council, the European Economic and Social Committee and the Committee of the Regions – A European approach to media literacy in the digital environment (COM 2007. 833).
European Commission. 2007b. Media literacy: Do people really understand how to make the most of blogs, search engines or interactive TV? (IP/07/1970)
European Commission. 2008a. Council conclusions of 22 May 2008 on a European approach to media literacy in the digital environment.
European Commission. 2008b. Media literacy in a digital world. European Parliament resolution of 16 December 2008 on media literacy in a digital world (2008/2129 (INI)). European Commission. 2009a. Commission Recommendation of 20 August 2009 on media
literacy in the digital environment for a more competitive audiovisual and content industry and an inclusive knowledge society.
European Commission. 2009b. Council conclusions of 27 November 2009 on media literacy in the digital environment.
Fairclough, N. 1995. Media discourse. London: Edward Arnold. Forbes. Retrieved from www.forbes.com.
Gonnet, J. 2001. L’éducation aux médias. Les controverses fécondes [Media literacy. The fruitful controversies]. Paris: CNDP-Hachette Education.
Hatlevik, O. E., Guðmundsdóttir, & G. B., Loi, M. 2015. Examining factors predicting students’ digital competence. Journal of Information Technology Education: Research 14. 123–137. Retrieved 01–31–2017 from www.jite.org/documents/Vol14/
JITEV14ResearchP123-137Hatlevik0873.pdf.
Hobbs, R., & Frost, R. 2003. Measuring the acquisition of media literacy skills. Reading Research Quarterly 38. 330–352.
João, S. G., & Menezes, I. 2008. Construção e validação de indicadores de literacia mediática [Construction and validation of media literacy indicators]. Comunicação e Sociedade 13. 55–68.
Kirsch, I., Jungeblut, A., & Mosenthal, P. 1998. The measurement of adult literacy. In T. S. Murray, I. Kirsch, & L. Jenkins (Eds.), Adult literacy in OECD countries: Technical report on the first international adult literacy survey (pp. 105–134). Washington: US
Department of Education – National Center for Education Statistics. Livingstone, S. 2011a. Children’s media cultures in comparative perspective. In V.
Nightingale (Ed.), The handbook of media audiences (pp. 405–422). Malden: Wiley-Blackwell.
Livingstone, S. 2011b. Media literacy: Ambitions, policies and measures. London: Media@lse.
Lopes, P. 2014. Literacia mediática e cidadania: Práticas e competências de adultos em formação na Grande Lisboa [Media literacy and citizenship: Practices and competences of adults in further education in Greater Lisbon] (PhD thesis). Lisbon: ISCTE-IUL. Lopes, P. 2015. Avaliação de competências de literacia mediática: Instrumentos de recolha
de informação e opções teórico-metodológicas [Evaluation of media literacy competences: Instruments of information collection and theoretical-methodological options]. Revista Media & Jornalismo 15(27). 45–69.
Lopes, P., Pereira, S., Moura, P., & Carvalho, A. 2015. Avaliação de competências de literacia mediática: O caso português [Evaluation of media literacy competences: The
Martinsson, J. 2009. The role of media literacy in the governance reform agenda. Washington: The World Bank.
Mathieu, D. 2009. Cultural knowledge in news comprehension. Journal of Audience & Reception Studies 6(1). 77–117.
Mihailidis, P. 2008. Beyond cynicism. How media literacy can make students more engaged citizens (PhD thesis). Maryland: University of Maryland.
Morais, J. 2002. Influência da literacia e da escolaridade sobre a linguagem e a cognição [Influence of literacy and education on language and cognition]. In F. L. Viana, M. Martins & E. Coquet (Eds.), Leitura, literatura infantil e ilutração. Investigação e prática docente – 3 (pp. 45–62). Braga: Centro de Estudos da Criança da Universidade do Minho.
Morais, J. 2010. How learning to read changes the cortical networks for vision and language. Science 330. 1359–1364.
Muraki, E. 1992. A generalized partial credit model: Application of an EM algorithm. Applied Psychological Measurement 16. 159–176.
Muraki, E. 1993. Information functions of the generalized partial credit model. Applied Psychological Measurement 17. 351–363.
Muraki, E. 1997. A generalized partial credit model. In W. J. van der Linden & R. K.
Hambleton (Eds.), Handbook of Modern Item Response Theory (pp. 153–164). New York: Springer.
Muraki, E., & Bock, R. D. 2002. PARSCALE: IRT-based test scoring and item analysis for graded open-ended exercises and performance tasks (Version 3) [Computer software]. Chicago: Scientific Software.
OECD. 2013. OECD Skills Outlook 2013: First results from the survey of adult skills. OECD Publishing.
OECD. 2015. Students, computers and learning: Making the connection. Paris: OECD Publishing. Retrieved 01-19-2017 from http://dx.doi.org/10.1787/9789264239555-en. OECD. 2016. The survey of adult skills: Reader’s companion 2ndedition, OECD Skills Studies.
Paris: OECD Publishing.
Ofcom – Office of Communications. 2012. Ofcom children and parents media literacy audit 2011. London: Ofcom.
Ofcom – Office of Communications. 2013. Adults media use and attitudes report. London: Ofcom.
Ofcom – Office of Communications. 2016. Children and parents: Media use and attitudes report. London: Ofcom.
Primack, B. A., Gold, M. A., Switzer, G. E., Hobbs, R., Land, S. R., & Fine, M. J. 2006. Development and validation of a smoking media literacy scale for adolescents. Archives of Pediatric Adolescent Medicine 160(4). 369–374.
Quin, R., & McMahon, B. 1991. Media analysis: Performance in media in western Australian government schools. Western Australian Ministry of Education Report.
Quin, R., & McMahon, B. 1995. Evaluating standards in media education. Canadian Journal of Educational Communication 22(1). 15–25.
Rumelhart, D. E. 1977. Toward an interactive model of reading. In S. Dornic (Ed.), Attention and performance 6 (pp. 265–303). Hillsdale (NJ): Erlbaum.
Tuchman, G. 1978. Making news: A study in the construction of reality. New York: Free Press. UNESCO. 1982. Grünwald declaration on media education. Grünwald: UNESCO.
UNESCO. 1990. New directions in media education. Toulouse: UNESCO. UNESCO. 1999. Educating for the media and the digital age. Vienna: UNESCO.
UNESCO. 2002. Youth media education. Sevilha: UNESCO.
UNESCO. 2006. Regulation, awareness, empowerment: Young people and harmful media content in the digital age. Paris: UNESCO.
UNESCO. 2007. Paris agenda – Twelve recommendations for media education. Paris: UNESCO.
UNESCO. 2008. On media education. Paris: UNESCO.
UNESCO. 2009. Mapeamento de políticas de educação para os media no mundo – Visão, programas e desafios [Mapping of education policies for the media of the world – Vision, programs and challenges]. Paris: UNESCO.
UNESCO. 2011. Towards media and information literacy indicators. Paris: UNESCO. UNESCO. 2012. Pedagogies of media and information literacies. Moscow: UNESCO. UNESCO. 2013a. Media and information literacy for knowledge societies. Moscow: UNESCO. UNESCO. 2013b. Global media and information literacy assessment framework: Country
readiness and competencies. Paris: UNESCO.
Van Dijk, T. A. 1983a. Estructuras textuales de las noticias de prensa [Textual structures of print news]. Análisis. Quaderns de Comunicació i Cultura 7/8. 77–105.
Van Dijk, T. A. 1983b. Discourse analysis: Its development and application to the structure of news. Journal of Communication 33(3). 20–43.
Van Dijk, T. A. 1988. News analysis. Case studies of international and national news in the press. Hillsdale: Lawrence Erlbaum Associates Publishers.
Van Dijk, T. A. 1990. La noticia como discurso. Comprensión, estrutura e producción de la información [News as discourse. Comprehension, structure and production of information]. Barcelona: Paidós.
Van Dijk, T. A. 2002. El conocimiento y las noticias [Knowledge and news]. Quaderns de Filologia. Estudis de Comunicació 1. 249–270.
Van Dijk, T. A. 2008. Discourse and context: A sociocognitive approach. Cambridge: Cambridge University Press.
Van Dijk, T. A. 2009. Society and discourse: How social contexts influence text and talk. Cambridge: Cambridge University Press.
Zacchetti, M. 2011. Literacia mediática: Uma abordagem europeia [Media literacy: A European approach]. Congresso Literacia, Media e Cidadania. Braga.