University of Algarve
Faculty of Sciences and Technology
Effect of elevated CO
2concentrations and irradiance
on the photosynthetic performance of the seagrass
Cymodocea nodosa
Cátia José Abreu Freitas
Dissertation for Master’s degree in Marine Biology
Advisors: Isabel Barrote, FCT
João Silva, CCMar
Faro
2015
“Effect of elevated CO2 concentrations and irradiance on the photosynthetic performance
of the seagrass Cymodocea nodosa”
Declaração de autoria de trabalho
Declaro ser a autora deste trabalho, que é original e inédito. Autores e trabalhos consultados estão devidamente citados no texto e constam da listagem de referências incluída.
Cátia José Abreu Freitas
___________________________________
Direitos de cópia ou Copyright © Copyright: Cátia Freitas
A Universidade do Algarve tem o direito, perpétuo e sem limites geográficos, de arquivar e publicitar este trabalho através de exemplares impressos reproduzidos em papel ou de forma digital, ou por qualquer outro meio conhecido ou que venha a ser inventado, de o divulgar através de repositórios científicos e de admitir a sua cópia e distribuição com objetivos educacionais ou de investigação, não comerciais, desde que seja dado crédito ao autor e editor.
Acknowledgements
First, I would like to thank my two supervisors, Prof. Dra. Isabel Barrote and Dr. João Silva for all the help they gave me during my thesis and for having accepted me in this project. To Isabel, a special thank you not only for this thesis but for all over my academic career. You will always be an example to me.
An enormous thank you to:
• All Algae group, for the good time we’ve shared and for all the support on this journey. • Irene Olivé, for all the help, patience and every hour of questions answered during these months.
• Monya Costa, especially to her, for the support at the laboratory, for all the “out of hours working” and for her friendship.
• Karyna Pereira, Ana Pereira and Yianni Cetus for all the help in the field work and the good time we’ve shared in Ramalhete.
• The entire Ramalhete team that has always been available to help with whatever was needed, particularly to João Reis and Cristovão Nunes.
• My master's friends for all the fun, but especially to Magda for her friendship since the first day I’ve met her and for her words of comfort in all the most difficult situations. Thank you. • To my friends ever since I can remember, Fabiana, Barbara, Lusmar and Ana for their unconditional support throughout my life. To Faria, the one who always understands me and to Alexandre who will always be a reference for me, for his effort and hard work.
• To André Silva, my boyfriend and my partner, who shared all this work with me from the beginning. Thank you for always being the best, even in the most difficult moments. Your support was crucial.
And lastly, but most importantly, to my dear brothers, whom I have that special connection and to my father. To them I dedicate my thesis. Thank you for always supporting me.
Thank You! Cátia
Abstract
Currently, the large quantity of the anthropogenic carbon dioxide (CO2) emitted to the atmosphere is leading to ocean acidification (OA). Seawater pH is lowered as compared to pre-industrial era and a further decline is expected. Seagrasses are one of the most productive and important coastal and marine ecosystems on Earth. Understanding how these marine plants will respond to CO2 enrichment is decisive to future coastal ecosystems management. This experiment aimed to investigate how the photosynthetic ecophysiology of the seagrass
Cymodocea nodosa is affected by high CO2 concentrations, under different light intensity and quality. This work was conducted in a mesocosm controlled system during two weeks. Photosynthetic responses were quantified using an oxygen electrode and rapid light curves were performed with a Diving-PAM. Chlorophylls and carotenoids were accessed by spectrophotometry and high-pressure liquid chromatography. In low light intensity treatments, the increase in CO2 partial pressure (pCO2)resulted in a higher maximum photosynthetic rate (Pmax). The relative maximum electron transport rate (rETRmax) and the saturation irradiance (Ik) were significantly reduced in light limiting circumstances, regardless the pCO2. In contrast, the light utilization coefficient (α) increased. The concentration of Chl a and b as well as Chl a/b ratio were not affected by the different conditions of light and/or CO2. In general, distinct light conditions were likely to induce greater differences in C. nodosa responses than the increase in pCO2. Distinct spectrum wavelengths reaching seagrasses may play a key role in the photosynthetic process in low light conditions. Ratios between xanthophyll pigments and total chlorophyll revealed an increased investment on the xanthophyll pool and the trigger ing of the xanthophyll cycle as a response to high light intensity. All plant responses to changing environmental patterns should be interpreted carefully, once they may be highly species specific.
Keywords
Photosynthesis, Light, Cymodocea nodosa,Seagrass, High Carbon Dioxide
Institutions
The laboratory work was conducted in the “Algae: marine plant ecology research group” at the Centre of Marine Sciences (CCMar), located at Universidade do Algarve; field work was conducted at the Ramalhete Experimental Station (CCMar).
Resumo
Durante 800000 anos a concentração de dióxido de carbono (CO2) na atmosfera permaneceu entre 172-300 partes por milhão (ppm). No entanto, após a era industrial, a concentração de CO2 atmosférico sofreu um aumento sem precedentes para os níveis atuais de aproximadame nte 391 ppm de CO2, consequência da atividade antropogénica, como a queima de combustíve is fósseis. Atualmente, cerca de 30 % da totalidade de CO2 emitido para a atmosfera é absorvido pelo oceano, levando à diminuição do pH e alterando a química dos carbonatos na água, processo que resulta na acidificação do oceano. Apesar dos previstos impactos potencialme nte negativos da acidificação do oceano nos ecossistemas e organismos marinhos, as diferentes espécies não serão identicamente afetadas. As pradarias de ervas marinhas, angiospérmicas que se adaptaram a uma existência totalmente submersa, constituem um dos habitats marinhos e costeiros mais produtivos do planeta. São responsáveis pelo melhoramento da qualidade da água e promovem o aumento da biodiversidade disponibilizando habitat para outras espécies. No entanto, até à data, o efeito da acidificação do oceano na biologia e ecologia destas plantas marinhas é pouco conhecido, ainda que esteja prevista a estimulação positiva das taxas fotossintéticas e de crescimento com o aumento do CO2. Compreender como as pradarias de ervas marinhas serão afetadas pelo enriquecimento de CO2 na água será decisivo para a criação de futuras medidas de conservação e gestão de ecossistemas costeiros. O principal objetivo deste estudo foi o de investigar o efeito de elevadas concentrações de CO2 na ecofisiologia da fotossíntese de Cymodocea nodosa sob diferentes intensidades e qualidades de luz em condições ambientais controladas. Amostras de C. nodosa foram recolhidas na Baía de Cádiz, em Espanha e transportadas para a Estação de Experimental do Ramalhete (CCMar), Faro, Portugal, onde se desenvolveu toda a experiência. Rizomas terminais de C. nodosa foram aleatoriamente distribuídos em diferentes tanques contendo substrato arenoso. A experiênc ia compreendeu um período de aclimatação que precedeu o período experimental, este último com duração de duas semanas. Os parâmetros físico-químicos e os parâmetros fotossintét icos derivados da fluorescência da clorofila a foram monitorizados diariamente. Diferentes processos fisiológicos foram estudados de forma a elucidar como a estrutura e o funcioname nto dos sistemas de captura de energia luminosa variam em ambientes luminosos diferenciados. Foram realizadas curvas de resposta da fotossíntese à luz com base na libertação/consumo de oxigénio e com base na taxa de transporte de eletrões através de um elétrodo de oxigénio tipo Clark e de um fluorómetro Diving-PAM, respetivamente. As clorofilas foram quantificadas espectrofotometricamente e os carotenoides foram quantificados por cromatografia líquida de
alta eficiência (HPLC). Mediu-se também a eficiência fotoquímica máxima do fotossistema II (Fv/Fm). Em tratamentos com baixa intensidade luminosa o aumento da pressão parcial de CO2 resultou em maiores taxas fotossintéticas máximas (Pmáx), no entanto este aumento em Pmáx não se fez acompanhar pelo aumento da eficiência fotossintética (α). Perante níveis atuais de CO2 atmosférico e entre tratamentos com baixa intensidade luminosa o valor de Pmáx foi superior quando a qualidade espectral foi limitada ao comprimento de onda da luz azul. Os níveis elevados de CO2 na água aumentaram também as taxas de respiração no escuro quando comparado com as mesmas taxas a níveis de CO2 de referência, no entanto este aumento foi apenas significativo para plantas em tanques sem qualquer atenuação luminosa. A máxima taxa relativa de transporte de eletrões (rETRmáx) e a irradiância de saturação (Ik) foram significativamente reduzidas em condições de baixa intensidade luminosa, independenteme nte da concentração de CO2. Em tratamentos sem atenuação luminosa a rETRmáx foi alcançada apenas quando a intensidade da luz foi aproximadamente 150 µmolesfotões.m-2.s-1, ao contrário dos tratamentos onde a intensidade luminosa foi atenuada, em que a rETRmáx foi alcançada a baixas irradiâncias (a partir de 74.4 µmolesfotões.m-2.s-1) resultando num coeficiente da utilização da luz (α) significativamente superior. A eficiência fotoquímica máxima do fotossistema II foi significativamente superior em plantas aclimatadas a baixas intensidades luminosas. A intensidades luminosas naturais, o rácio Fv/Fm foi superior em plantas com elevada disponibilidade de CO2 na água. Relativamente ao pigmentos fotossintéticos, as concentrações de clorofila a (Chl a), b (Chl b) e clorofila total (Chl T) foram significativamente superiores em Cádiz do que após o período experimental, no entanto não se registaram alterações significativas no rácio de clorofila a/b (Chl a/b). Nos tratamentos sem atenuação da luz, a taxa de desepoxidação dos pigmentos do ciclo das xantofilas, violaxantina (V), anteraxantina (A) e zeaxantina (Z) - (AZ/VAZ) - foi significativamente superior do que nos tratamentos com baixas intensidades luminosas. O rácio entre os pigmentos do ciclo das xantofilas e a clorofila total [(VAZ)/ChlT] foi menor em plantas aclimatadas a baixa disponibilidade luminosa, independentemente do tratamento de CO2. De uma forma geral, os resultados obtidos sugerem que distintas condições luminosas induziram diferenças mais acentuadas na ecofisiologia da fotossíntese de C. nodosa do que o aumento da pCO2. RuBisCO é a enzima que catalisa a fixação primária do CO2 na fotossíntese, no ciclo de Calvin, em plantas C3. A maioria das espécies de ervas marinhas são classificadas como plantas C3, no entanto, há estudos que apontam para a ocorrência do metabolismo fotossintético C4 (ex. Cymodocea serrulata). No estado atual do conhecimento, em plantas C4 o aumento do CO2 não resulta em alterações na resposta fotossintética, uma vez que a fixação primária de carbono é catalisada pela enzima
fosfoenolpiruvato carboxilase (PEPC’ase), que ao contrário da RuBisCO não é afetada pela concentração de O2, minimizando a fotorrespiração e tornado a fotossíntese saturada para a atual concentração de carbono inorgânico (Ci). No entanto, e contrariamente ao que é ocasionalmente assumido, C. nodosa não apresentou respostas que indiquem um estado de saturação relativamente à atual concentração de carbono inorgânico uma vez que neste estudo o aumento do CO2 resultou em maiores taxas fotossintéticas máximas em ambientes com baixa intensidade luminosa. Os resultados obtidos indicam ainda que em condições lumino sas limitantes, a qualidade da luz poderá ter um papel-chave na resposta fotossintética da planta. A redução nas taxas relativas de transporte de eletrões, a diminuição da irradiância de saturação e o aumento do coeficiente de utilização de luz são típicos indicadores de plantas adaptadas a baixas intensidades luminosas. Adaptações fisiológicas de plantas de C. nodosa em diferentes locais e ambientes marinhos podem resultar em alterações na concentração dos pigmentos fotossintéticos, sem implicar uma perda de performance fotossintética ou uma alteração no seu estado fisiológico. Os rácios entre pigmentos fotossintéticos revelam o investimento na pool dos pigmentos do ciclo das xantofilas e a ativação do seu ciclo de desepoxidação/epoxidação como respostas a elevadas intensidades luminosas. As respostas de diferentes espécies de ervas marinhas à mudança nos padrões ambientais devem ser interpretadas cautelosamente uma vez que podem ser altamente específicas para cada espécie.
Contents
Introduction………...…1
Ocean Acidification………1
Effects of Ocean Acidification in Seagrasses………..………...3
Light, the Key Driver of Photosynthesis……….…4
Main Objectives………..…6
Material and Methods………...………...7
Model Species: Cymodocea nodosa………...7
Sampling Site……….….9
Experimental System (Mesocosm)………..….10
Physical-Chemical Parameters……….…12
Alkalinity………..…13
Photosynthetic Light Response Curves………13
Chlorophyll Fluorescence……….…16
Rapid Light Curves………...18
Mathematical Models: Photosynthetic Light Response Curves and Rapid Light Curves…..19
Photosynthetic Pigments Analysis………..………...…...20
Data Analysis………...……...21
Results……….…..22
Experimental Physical-Chemical Parameters………...………....22
Photosynthetic Light Response Curves………...………..25
Dark Respiration………...………....30
Rapid Light Curves ………....……….….31
Maximal Photochemical Efficiency of PSII ………...….….35
Photosynthetic Pigments……….…..35
Discussion……….40
Conclusions………..……….46
Bibliography………..47
Abbreviations list
(AZ) / (VAZ) - Xanthophyll de-epoxidation index
-car - β-carotene
[(VAZ)/ChlT] – Xanthophyll cycle pigments to total chlorophyll ratio ∆F - Proportion of open reaction centers
∆F/F’m - Effective quantum yield A - Antheraxanthin
C (x + c) – Carotenoids (xanthophylls and carotenes) C6H7NaO6 - Sodium ascorbate
CaCO3 - Calcium carbonate
Chl a - Chlorophyll a
Chl a/b - Chlorophyll a/b ratio Chl b - Chlorophyll b Chl T - Total chlorophyll Ci - Inorganic carbon CO2 - Carbon dioxide CO32- - Carbonate ion D - Heat
DIC - Dissolved inorganic carbon DO - Dissolved oxygen
F - Fluorescence
F’m – Maximum fluorescence in the light F0 – Basal fluorescence
Fm – Maximum fluorescence
Ft – Steady-state level of fluorescence
Fv/Fm - Maximal photochemical efficiency of PSII H+ - Hydrogen ion
H2CO3 - Carbonic acid
H2O - Water
HCl - Hydrochloric acid HCO3- - Bicarbonate ion
KCl – Potassium chloride L - Lutein N - Neoxanthin N2 - Nitrogen O2 - Oxygen OA – Ocean acidification P - Photochemistry
PAR - Photosynthetic active radiation pCO2 - Partial pressure of carbon dioxide
PEPC’ase - Phosphoenolpyruvate carboxylase Pmax – Maximum photosynthetic rate
PSII - Photosystem II Rd – Dark respiration
rETR – Relative electron transport rate
rETRmax - Relative maximum electron transport rate
RuBisCO - Ribulose-1,5-Bisphosphate Carboxylase/Oxygenase T - Taraxanthin
TA - Total alkalinity V - Violaxanthin
VAZ - Violaxanthin (V) + Anteraxanthin (A) + Zeaxanthin (Z) Z - Zeaxanthin
1
1. Introduction
The ocean covers about 71 % of the Earth's surface and supports the greatest biodiversity in the planet. It regulates climate and weather systems, plays a key role in the global carbon cycle and is recognized as one of the humanity’s most important natural resources (Costanza, 1999; Raven, 2005). Knowing how rapid changes on climate events are disturbing the whole marine ecosystems is crucial in order to predict severe risks involved and limit further negative impacts of anthropogenic activities (Hoegh-Guldberg and Bruno, 2010). One of the climate complications that currently is under focus concerns the increase of CO2 in the atmosphere, leading to a host of additional changes such as ocean acidification (OA) (Brierley and Kingsford, 2009; Doney et al., 2012).
During 800000 years the carbon dioxide (CO2) concentration in the atmosphere varied between 172-300 parts per million (ppm), but since the Industrial Revolution, the human activities are responsible for releasing gigatons of carbon to the Earth’s atmosphere annually, increasing those values (Lüthi et al., 2008; Brierley and Kingsford, 2009). It is predicted that the continuous and significant increase in the atmospheric concentration of CO2 will conduce to ocean acidification (Brewer, 2009). Significant changes in biodiversity and marine ecosystems function are expected to be major problems due to ocean acidification.
The influence of these climatic changes on seagrasses, organisms that are often labeled as
“ecosystem engineers”, is a topic of study as interesting as necessary these days. Seagrasses
are flowering plants that can form dense meadows. They play essential key multifunctio na l roles providing food and habitat, stabilizing sediments and improving water clarity, thus constituting one of the most productive coastal and marine ecosystems on Earth (Valentine and Duffy, 2006; Short et al., 2007; Unsworth and Cullen, 2010). However, at a global level, 29 % of seagrasses communities are already lost or degraded (Waycott et al., 2009).
1.1. Ocean Acidification
The ocean and the atmosphere exchange considerable amounts of CO2. Oceans used to be a source of CO2 to the atmosphere, but over the past 250 years and as a consequence of human activity such as the burning of fossil fuels (Cao et al., 2007), agricultural labor (e.g. deforestation) and cement production (Sabine et al., 2004; Feely et al., 2009; Duarte et al., 2013), atmospheric CO2 levels have experienced a large and rapid increment (Fig.1).
2
Figure 1: Monthly levels of CO2 globally averaged over marine surface sites since 2011. The dashed red line represents the monthly mean values, centered on the middle of each month. The black line represents the same, after correction for the average seasonal cycle. (Adapted
from: Ed Dlugokencky and Pieter Tans, NOAA/ESRL (www.esrl.noaa.gov/gmd/ccgg/trend s/).
Atmospheric CO2 values recorded range from roughly 278 parts per million (ppm) at pre-industrial era (Cao et al., 2007) to an annual average of 391 ppm in 2011 (Stocker et al. 2013). Accordingly to Intergovernmental Panel on Climate Change (IPCC) business-as-usua l forecasts, these atmospheric levels can achieve 936 ppm by 2100 in the worst case scenario (Stocker et al. 2013).
Currently, the ocean takes up large quantities of anthropogenic CO2 (nearly 30 %) (Feely et
al., 2004; Arnold et al., 2012) and although this helps limiting the level of CO2 in the atmosphere it is also responsible for the modification of the carbon chemistry balance both in the mixed layer and in the deep ocean (Sabine and Feely, 2007; Hofmann et al., 2010; Gattuso and Hansson, 2011).
When CO2 is absorbed by the ocean, it reacts with water molecules changing the proportions of carbonic acid (H2CO3), bicarbonate (HCO3-) and carbonate (CO32-). In aqueous medium, CO2 is slowly hydrated to H2CO3 which, at seawater pH, rapidly ionizes to HCO3- and CO32-.
3
This process increases the concentration of hydrogen ion (H+) leading to the decrease of the seawater pH (Ishimatsu et al., 2005), according to the equation (Branch et al., 2013):
Seawater pH has already decreased 0.1 units since the Industrial Revolution (Caldeira and Wickett, 2003, 2005; Orr et al., 2005; Doney et al., 2009). A few models scenarios anticipate the decrease of further 0.3-0.4 pH units until the end of the 21st century (Brierley and Kingsford, 2009; Gattuso and Lavigne, 2009), probably at a rate 100 times higher than any time over the past hundreds of millennia (Raven, 2005). Despite the evidence of chemical princip les and research studies supporting the potentially negative impacts of ocean acidifica t io n (Riebesell et al., 2000; Seibel and Walsh, 2001; Ishimatsu et al., 2005; Orr et al., 2005; Dupont
et al., 2010), undoubtedly not all marine species and habitats will be similarly affected and the
impact of high-CO2 water condition in its physiology and biochemistry is scarcely understood.
1.2. Effects of Ocean Acidification in Seagrasses
According to Beer et al. (2002), seagrasses appear to be photosynthetically limited by the current availability of CO2 concentration due to its low solubility and slow diffusion rates in seawater (4 to 5 orders of magnitude lower than in the air) (Zou and Gao, 2010). So, it is expectable that seagrasses meadows will become competitively advantageous with increased growth rates and productivity in acidified environments (Polunin, 2008; Doney et al., 2012; Koch et al., 2013). Seagrasses possess organs and tissues identical to the terrestrial plants (Kuo and den Hartog, 2006). However, given the environment in which they are inserted, the biochemistry of photosynthesis will be distinctly affected by elevated CO2 levels (Koch et al., 2013). Several seagrass species are also photosynthetically ineffective using HCO3- because bicarbonate is not directly usable by RuBisCO (Ribulose-1,5-Bisphosp ha te Carboxylase/Oxygenase) to convert it into organic carbon in the Calvin Cycle (Palacios and Zimmerman, 2007). Moreover, HCO3- represents 90 % of the total dissolved inorganic carbon
4
(DIC), at normal seawater pH of ~8.1, while CO2 and CO32- represent only 1 % and 9 % respectively (Feely et al., 2009; Branch et al., 2013).
RuBisCO is the enzyme involved in the primary carbon fixation in C3 plants and catalyzes the first step of the Calvin cycle in photosynthesis. In terrestrial C3 plants, RuBisCO activity seems to be decreased or not affected by elevated levels of CO2 (Pérez et al., 2005; Pandurangam et
al., 2006). Despite seagrasses have globally been regarded as C3 plants, photosynthet ic pathways are not well defined for some species. It has been suggested that C4 metabolis m probably occurs in some seagrasses. However this is not widely accepted mainly because the results obtained regarding the distinction between C3 and C4 metabolisms in seagrasses have to be interpreted with caution as they may reflect particular effects related to the aquatic environment (Touchette and Burkholder, 2000). Albeit the controversy surrounding the C3/C4 classification of seagrasses, Cymodocea nodosa (the study model specie in this thesis) has been proposed to be a C4 species (Beer et al., 1980).
The increase in CO2 levels will promote C3 marine plants photosynthetic pathways since RuBisCO is not substrate-saturated at the current CO2 concentration (Koch et al., 2013). However, in C4 photosynthetic metabolism the primary carbon fixation is catalysed by phosphoenolpyruvate carboxylase (PEPC’ase), which is not affected by O2 thus minimiz ing photorespiration and making photosynthesis saturated at actual atmospheric CO2 concentration.
1.3. Light, the Key Driver of Photosynthesis
When compared to terrestrial plants, seagrasses are exposed to significantly lower light regimes that are more similar to those of macrophytic algae (Casazza and Mazzella, 2002). Seagrasses vertical distribution ranges from the intertidal to more than 70 m deep (Duarte, 1991). Underwater light availability decreases with depth, limiting the vertical distribution of seagrasses that cannot survive below their light compensation point. Also, the spectral composition of light varies with the properties of water and depth. In general, red light is extinguished above 10 m, orange is extinguished above 30 m and only yellow, violet, green and blue reach higher depths (Kirk, 2011). Hence, light availability and quality have to be considered when studying the effects of ocean acidification on seagrasses photosynthesis.
Light drives photosynthesis and it is one of the major drivers of seagrasses growth (Ralph et
al., 2007). Seagrasses light requirements comprise up to 37 % of surface irradiance and
determine their limits of distribution both geographically and in depth (Zimmerman, 2003). For the photosynthetic process to be successful, light has to reach leaf epidermis and be captured
5
by the photosynthetic apparatus. However, natural and anthropogenic processes driving water eutrophication, are diminishing the penetration of light in water column and changing its optical properties resulting in ineffective CO2 assimilation and limited growth, particularly at the deepest edge of the meadow (Via et al., 1998; Duarte et al., 2007; Ralph et al., 2007). Unlike terrestrial plants, seagrasses leaves are devoid of specific tubular cells (that help with the light entrance into the leaves) and spongy mesophyll (that increases the optical path length). Nonetheless seagrasses possess effective light harvesting capacities (Cummings and Zimmerman, 2003; Ralph et al., 2007), located in the epidermis of the leaf blade which is the major site of photosynthesis with high concentrations of chloroplasts (Kuo and den Hartog, 2006). Pigment content, chloroplast location, morphology and physical properties of the leaf regulate its light absorbance (Ralph et al., 2007).
Chlorophylls a and b absorb in the red region of the spectra (650-700 nm), where they have maximum photosynthetic efficiency, and in the blue region of the spectra (400-500 nm), whereas green and yellow (500-600nm) are inefficient at driving photosynthesis (Ralph et al., 2007; Gallegos et al., 2009; Chartrand et al., 2012). In eutrophic and turbid waters, the photosynthetically active radiation (red and blue) is mainly removed by phytoplankto n chlorophyll that tends to absorb the same wavelengths as requested by plants (Gallegos et al., 2009). After a long literature review, Duarte et al. (2007) conclude that plant communit ies living in the deeper limits of the meadows but in clear waters have fewer light requireme nts (until threefold less) than those closest to the surface in turbid waters. These differences in light requirements may be associated with light quality, considering that high-energy blue light travels further through water column in clear waters, while in shallow and turbid waters the smaller blue wavelengths are quickly attenuated (Gallegos et al., 2009) and scattered by suspended and dissolved components that also play an important role in light attenuatio n (McPherson et al., 2011).
Apart from chlorophylls a and b, Casazza and Mazzella (2002) and Costa (2014) quantified the carotenoid pool constituted by β-carotene (-car) and the xanthophylls lutein (L) neoxanthin (N), taraxanthin (T), violaxanthin (V), antheraxanthin (A) and zeaxanthin (Z) in C. nodosa. Besides their structural functions in light harvesting complexes, carotenoids are precursors of vitamins and phytohormones, participate in light capturing and have important photoprotect ive functions (Cazzonelli, 2011). Xantophylls (V, A and Z) play a protective role against excess light by dissipating the excess energy as heat and thus preventing oxidative stress and
6
photosystem damage, through the de-epoxidation of V to A and Z in the xanthophyll cycle (VAZ cycle) (Jahns et al., 2009).
Under low light conditions, plants become limited by both energy and reducing power and consequently less carbon is fixed by seagrasses. Therefore, understanding how seagrasses cope with changes in light quantity and quality will allow a more accurate and detailed assessment of carbon budget adjustments. To the best of our knowledge, there is no published data regarding how the effects of elevated CO2 will affect seagrass photosynthetic performance under different light intensities and qualities. In spite of the putative consequences of light spectral quality on seagrass photosynthetic carbon acquisition, no experimental evidence has so far been obtained to clarify such relationship.
Ocean acidification rapidly became a global concern, especially because it’s biologica l, ecological and biochemical effects are largely unknown and hardly predictable for marine biota (Blackford, 2010). The inconsistency of the results obtained so far evidence that there is a substantial lack of knowledge about the structure and function of seagrasses photosynthet ic apparatus regarding metabolic pathways and physiological processes, leading to the need for further specific research studies. Understanding the effects of elevated availability of CO2, both at the physiological level and on the ecological function and distribution of seagrasses, will provide a better insight and the improvement of techniques for seagrass preservation and restoration.
1.4. Main Objectives
This thesis main goal was to investigate and understand the effect of high CO2 concentrations on the photosynthetic ecophysiology of the seagrass Cymodocea nodosa under different light intensities and spectral conditions in a mesocosm controlled environment. Essentia l physiological processes were evaluated in order to elucidate how the structure and functio ning of the photosynthetic light harvesting apparatus fits to the distinct light environments.
7
2. Material and Methods
Cymodocea nodosa specimens were randomly collected on the 21st of April 2015, during low tide, from the shallower inner bay of the Bay of Cádiz, Spain. Intact shoots with horizont a l rhizomes were excavated from the sediment, stored in seawater and in the dark, and transported to Ramalhete Experimental Station (CCMar) where the experiment was held in a mesocosm facility. A total of approximately 34 plant rhizomes were randomly distributed through each 24 different tanks and planted in sandy substrate. Each tank was supplied with water from Ria Formosa, continuously flowing through an open system. Cymodocea nodosa was mainta ined under current atmospheric and water conditions during 8 days (acclimation period) from the 22nd to the 29th of April, 2015. The experimental period began with the imposition of differe nt combinations of light intensity/quality and CO2 partial pressure during 16 days (from the 30th April to the 15th May).
During both acclimation and experimental period, CO2 concentrations, water physical-chemical parameters (such as temperature, pH, oxygen and salinity), irradiance, and chlorophyll-fluorescence-derived photosynthetic parameters were monitored on a daily basis.
Leaf samples were collected for pigments analysis at the time of collection, in Cádiz, at pre-dawn (PD) and noon after the acclimation period (T0) and at PD and noon at the end of the experiment (T1). Photosynthetic light response curves and rapid light curves (RLC) were done at the end of the experiment (T1).
2.1. Model Species: Cymodocea nodosa
Seagrasses are aquatic monocot angiosperms, worldwide distributed in most shallow and sheltered coastal waters. They consist of a unique group of flowering plants that can be found in the sea, where they are adapted to full submersion (Orth et al., 2006a).
The model species of this thesis, Cymodocea nodosa (Ucria) Ascherson, is a dense and highly productive seagrass species that belongs to Cymodoceaceae family which includes 5 genus:
Amphibolis, Cymodocea, Thalassodendron, Syringodium and Halodule (Orth et al., 2006b).
Four species of the genus Cymodocea are spread over the tropical and temperate seas: C.
angustata, C. rotundata, and C. serrulata in the Indo-Pacific Ocean, and C. nodosa througho ut
8
Madeira Island and Canary archipelago (Fig.2) (den Hartog, 1970; Green and Short, 2003; Alberto et al., 2005; Sandoval-Gil et al., 2012).
Figure 2: Global distribution of Cymodocea nodosa (Ucria) Ascherson (Cymodoceaceae)
(Adapted from: IUCN 2014).
Cymodocea nodosa is a perennial, fast-growing and dioecious tropical seagrass. Although
usually found in a broad range of marine environments, C. nodosa does not occur as often in the sea, where some meadow fragments can be found, as in coastal lagoons (Hemminga and Duarte, 2000; Procaccini et al., 2003; Espino et al., 2008; Boudouresque et al., 2009).
Cymodocea nodosa is an abundant species in the Mediterranean Sea and also in the remaining
area where it is distributed, and often appears mixed with other phanerogams such as Zostera
noltii and Z. marina (Ayala, 2010). It is considered an opportunistic, colonizer and pioneer
species, due to its wide vertical distribution, from upper subtidal limit to 50 m depth, high rates of clonal growth through horizontal vegetative propagation, which can reach several meters per year colonizing bare areas, and low demanding habitat requirements (Templado and Calvo, 2002; Marbá et al., 2004; Borum et al., 2004).
Given its high capacity to tolerate and adapt to several changes in the habitat conditions, C.
nodosa is the ideal species to study the effect of changes in environmental factors (Cancemi et al., 2002; Balestri and Lardicci, 2013) such as elevated CO2 and different light conditions on the photosynthetic performance, as it was done in this study. Moreover, C. nodosa has also been one of the most threatened seagrasses in the last 30 years, having its abundance significa nt ly diminished due to coastal and industrial devastation and consequent increased water turbidit y, reduced light penetration and lower photosynthetic rates (Luque and Templado, 2004; Tuya et
9
Despite of the several scientific publications regarding the effects of reduced irradiance on the growth and photosynthesis of C. nodosa (Olesen et al., 2002; Silva et al., 2013; Cabello-Pasini
et al., 2015) there is a lack of knowledge regarding the effects of ocean acidification together
with irradiance and light quality changes.
2.2. Sampling Site
The Bay of Cádiz (Fig. 3) is a semi-enclosed water body (Periáñez et al., 2013) located in southwest of Iberian Peninsula, Spain, between 36º23’ to 36º37’N and 6º08 to 6º15’W (Morris
et al., 2009) with approximately 28.5 km long and 13.5 km wide (Achab, 2013) and is divided
in two basins: (i) a deeper outer bay (surface ≈ 118 km2) opened to the Atlantic Ocean, and (ii) a shallower inner bay (surface ≈ 40 km2), under limited external marine influence with maximum depth of 11 m (Rueda and Salas, 2003; Achab, 2013). The inner bay is composed essentially of fine sand and mud where C. nodosa occurs in patches dispersed throughout the extensive intertidal areas and it’s also a habitat of singular relevance for local biodiversity (López de la Rosa et al., 2006; Morris et al., 2009). The water temperature in the Bay of Cádiz varies along the year, reaching a maximum of 26ºC in summer and a minimum of 12ºC in winter. Regarding salinity, the lower values of 32 psu (practical salinity units) are reached during the wet season while the higher values of 42 psu during the dry season (López de la Rosa
et al., 2006).
Figure 3: Bay of Cádiz, Spain. The yellow label on the map indicates the sampling site
10
Although C. nodosa is the second dominant seagrass specie in the Mediterranean Sea, this species has very low genetic diversity in the Portuguese coast, unlike C. nodosa meadows in the Bay of Cádiz (Ayala, 2010). Seagrass meadows with high genetic diversity have higher adaptive capacity under changing environmental conditions (Reynolds et al., 2012), which made C. nodosa specimens from Cádiz more appropriate for this experiment.
2.3. Experimental System (Mesocosm)
A controlled open system (Fig. 4) was built at Ramalhete field station to maintain C. nodosa rhizomes and shoots under manipulated CO2 and light conditions that allowed the study of the combined effects of high-CO2/low pH and light intensity and quality on seagrass physiolo gy. After the acclimation period, C. nodosa plants were kept under different carbon dioxide partial pressures (pCO2). Half of the tanks worked with a high pCO2 (pCO2 ≈ 1034.19 ± 23.96 atm) by adding commercial CO2 (named as “CO2” treatments), from a main reservoir with compressed CO2, metered by a partial pressured controlled solenoid valve. Thus it was simulated the water conditions predicted for the end of the century, without additiona l mitigation efforts, according to IPCC (IPCC Climate Change, 2014) report. The other half worked with an ambient pCO2 (pCO2 ≈ 370.81 ± 6.10 atm), without any CO2 addition (named as “REF” treatments).
Figure 4: Global view of the experimental system at Ramalhete Experimental Station (CCMar).
The same tanks were also maintained under different light intensities and qualities using different light filters (for both REF and CO2 treatments):
11
(i) High Light intensity treatments (HL): plants received 95 % of total daily irradiance availab le, both in CO2 and REF tanks. Tanks were covered with a greenhouse plastic, 95 % permeable to light (Solplast, S.A, Appendix I).
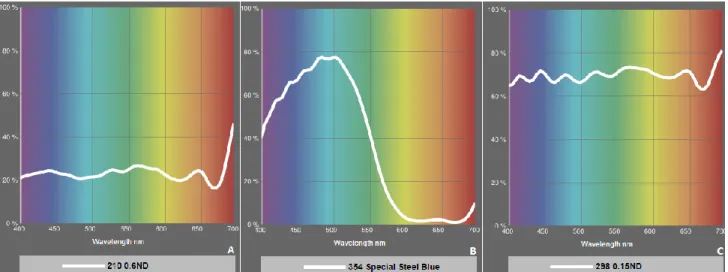
(ii) Low Light intensity treatments (LL): plants received ≈ 32-33 % of total daily irradiance reaching the HL treatments, both in CO2 and REF tanks. Plus the greenhouse plastic, these tanks were also covered with a 0.6 neutral density filter to reduce light intensity (2 stops) but not quality (LEE Filters, reference 210; Fig. 5 A).
(iii) Low Light intensity selective to specific Blue light wavelength treatments (LLB): plants received ≈ 24-26 % of total daily irradiance reaching the HL treatments, both in CO2 and REF tanks. Besides the greenhouse plastic, these tanks were also covered with a special steel blue filter (LEE Filters, reference 354; Fig.5 B), selective to specific blue light wavelength and a 0.15 neutral density filter that reduce light intensity (1/2 stop) (Lee Filters, reference 298; Fig.5 C).
Figure 5: Light transmitted (Y %) for each colour wavelength. A - 0.6 neutral density filter (LEE
Filters, reference: 210); B - special steel blue filter (LEE Filters, reference: 354); C - 0.15 neutral density filter (LEE Filters, reference: 298). Adapted from: LEE Filters.com;
In a total of 24 tanks, six different treatments were performed (REF- HL, REF- LL, REF – LLB, CO2 – HL, CO2 – LL and CO2 – LLB), four tanks each, randomly distributed (Fig.6).
The water from Ria Formosa was filtered with sand and ultraviolet light and pumped into cylindrical headtanks, with a flow of approximately 42 liters per hour. The mixture between
12
water and air or CO2 was done in these headtanks in order to obtain the desired pCO2 in each tank. Then, the mixed water was pumped to the HL, LL and LLB treatment tanks (with approximately 240 L of seawater each) containing C. nodosa plants. During the experime nt a l period, C. nodosa leaves were all cleaned on a daily basis to avoid epiphyte accumulation.
Figure 6: Study experimental design. Random distribution of the different light and pCO2 treatments for 24 tanks at Ramalhete field station. Rectangles represent the treatment tanks containing C. nodosa. Circles represent the headtanks where mixture between water and air or CO2 occurred.
2.4. Physical-Chemical Parameters
Water temperature (1), oxygen concentration (2), irradiance (3), and pH (4) were measured daily during both acclimation and experimental periods. 4 different sensors were used: (1)Hobo - HOBO Pendant® Temperature/Alarm Data Logger 64K - UA-001-64, ONSET ®; (2)Optode - Oxygen optode, MiniDO2T Logger, PME, EUA; (3)Irradiance ODYSSEY - PAR sensor, Odyssey Light logger; (4) Thermo Scientific™ Orion™ Star A221 pH Portable Meter. The ambient irradiance was recorded, near to the experimental site using an Irradiance PAR meter
13
sensor - Irradiance LICOR (Li-192SA, LiCor, EUA). Water samples for dissolved inorganic carbon analysis were taken every 3 days from each tank between 11a.m. and 1p.m.
To ensure the stability of pCO2, a Non-dispersive Infrared Gas Analyzer (IRGA: WMA-4, PP Systems, UK), was coupled to the system, in order to control the pCO2 in the CO2 main reservoir. A second IRGA (EGM-4, PP Systems, UK) coupled to a gas-exchange column (Mini-Module membrane contractor, Celgard, USA) was used each day in a different treatment tank (during ca. 24 h) to measure and monitor the pCO2 in the tank water’s.
2.5. Alkalinity
According to Dickson (1981), the total alkalinity of a seawater sample is defined as “the number of moles of hydrogen ion equivalent to the excess of proton acceptors over proton donors in 1 kg sample”. In other words, alkalinity is a chemical measurement of the water’s capacity to neutralize acids (Ohrel and Register, 2002; Emerson and Hedges, 2008).
Water samples from each of the tanks were collected for dissolved inorganic carbon (DIC) description trough pH and total alkalinity (TA) determination. Alkalinity was measured by potentiometric titration. The potentiometric titration method works by the addition of small quantities of hydrochloric acid (HCl) to the sample while monitoring the change in the pH until it reaches the endpoint pH (pH=3), which is already known to be after the equivalence point (pH ≈ 4.2) (Ohrel and Register, 2002). The equivalence point of the titration was calculated by employing a Gran linearization method (Gran, 1988). Below the equivalence point, all the alkaline compounds are unable to neutralize the acid and there is a linear relationship between the amount of acid added to the sample and the change of pH. Carbonate system parameters, as DIC concentration, were determined from total alkalinity, pH, temperature, and salinity of the sample through the Excel-based program CO2SYS.XLS 1.0 (Lewis and Wallace, 1998).
2.6. Photosynthetic Light Response Curves
Photosynthetic and respiratory rates of C. nodosa leaves were measured in a Clark type oxygen electrode system (DW3/CB1, Hansatech Instruments, Norfolk, United Kingdom; Fig.7).
14
Figure 7: Clark type oxygen electrode. Connection of incubation chambers to light
sources.
The oxygen electrode works coupled to an incubation chamber and is composed by a platinum cathode and a silver anode mounted on an epoxy resin disc. A teflon or polyethylene oxygen permeable membrane embedded in a saturated electrolyte solution (e.g. KCl) is placed to establish an electrolyte bridge between the cathode and the anode. The electrolyte is unifor m ly distributed by a paper spacer placed under the membrane. The polarization of the platinum cathode takes place by applying a small voltage. When this voltage is increased, occurs the reduction of the dissolved oxygen at the cathode and an electric current of low intensity is generated. This current is registered by a plotter fed with continuous paper flowing at a previously fixed velocity and is linearly related to the oxygen concentration in the solutio n, allowing its determination (Walker, 1987).
2.6.1. Principle of operation
Inside the plant, in specialized structures known as chloroplasts, the light energy captured by the pigment molecules in the antenna complexes of photosystems I and II is converted into chemical energy and reducing power that is used to obtain carbohydrates by the CO2 reduction in the Calvin Cycle. In this process part of the light energy is used to split the water molecule (water oxidation) into electrons that are used in the photosynthetic electron transport chain, protons that stay in the lumen of the thylakoids, and releasing oxygen (Lambers et al. 1998). The rate of oxygen evolution is proportional to the increase of current registered and is used to calculate the photosynthetic rate after the calibration of the oxygen electrode. As well, dark respiration (Rd) can be measured considering the rate of oxygen uptake in the absence of light, by covering the entire electrode with an opaque material.
15
2.6.2. Calibration
The calibration of the electrode was made by removing all the dissolved oxygen from the seawater by bubbling nitrogen (N2) into the incubation chamber. A baseline was recorded after the oxygen concentration reached zero, and the seawater from the incubation chamber was replaced by another 15 ml of O2 saturated filtered seawater. The saturation line was registered until stabilization. The calibration height is the difference between the base line and the line for oxygen saturated water and is related to the amount of oxygen that saturates the water at a certain temperature and salinity (Benson and Krause 1984).
Photosynthetic rates were calculated from the following equation (1):
Exp tg C O 1 g) ou (cm U 1 (s) 3600 (cm) 30 (cm) ml 15 ml 1000 ) mg/l ( A 2 1 2 Equation 1: Equation for calculating the oxygen evolution/uptake. A – Oxygen
release/consumption rate per area unit or per weight unit (mg O2/s/cm2 or g); [O2] – Oxygen concentration (mg/l); C1 – Calibration height (cm); - Angle of the registration line of oxygen release/consumption; 30/3600 – Paper speed in the plotter (cm/s); U – area (cm2) or weight (g) of the photosynthetic material; Exp – signal amplification.
Photosynthetic and respiratory rates of C. nodosa leaves were measured for each of the 6 different treatments (n=4 replicates, except for HL (REF and CO2) treatments to which n=3). For each photosynthetic light response curve (P-I curve), the electrode incubation chamber was filled with 15 ml of seawater from the corresponding treatment tank and a magnetic stirrer was used to ensure homogenization. Seawater was replaced whenever the light was changed, thus providing the renewal of CO2 for photosynthesis and avoiding oxygen supersaturation. The water temperature was maintained at 22 ºC by using an external thermostatic water-bath with a recirculation system (Julabo HC Julabo Labortechnik, Seelbach, Germany). A slide projector (Pradovit 150, Leica, Germany) equipped with a halogen lamp (Osram XENOPHOT 150W) was used as actinic light source. Neutral density filters (HL and LL leaves) and blue light filters (LLB leaves), the same used to manipulate light intensity and quality inside the treatment tanks, were combined and mounted on slide frames to provide different light quality and the
16
appropriate range of PAR intensities inside the incubation chambers. Two leaf segments of each replicate were clipped and attached vertically inside the incubation chamber, one next to the other for an equal exposure to the incident light. Leaf samples were submitted to increasing PAR intensities ranging between 17 to 2198 μmolphotons.m-2.s-1 (HL) 7 to 2198 μmolphotons.m-2.s -1 (LL) and 6 to 772 μmolphotons.m-2.s-1 (LLB). Each light level was imposed for the time necessary to generate a straight line with a consistent slope in the oxygen recording system. This slope was used to calculate the oxygen evolution/uptake (equation 1).
After incubation, the length and width of each fragment leaf was measured in order to normalize the photosynthetic rates to the leaf area.
2.7. Chlorophyll Fluorescence
Chlorophyll fluorescence parameters were measured with a Diving-PAM (Underwater Chlorophyll Fluorometer Pulse-Amplitude-Modulated (PAM), Walz, Germany) to both monitor the plants photosynthetic performance through the determination of their maxima l photochemical efficiency of PSII (Fv/Fm) and construct the rapid light curves (RLC).
2.7.1. Fluorescence Parameters for Assessment of Photosynthetic Performance
Fluorometers are widely used to evaluate the photosynthetic performance trough parameters such as maximal photochemical efficiency (Fv/Fm) of photosystem II (PSII) (Beer et al., 2001; Schreiber, 2004). The decrease of Fv/Fm is associated to stress and to the decrease of the photosynthetic performance. After excitation, chlorophyll relaxes emiting fluorescence (F), releasing energy as heat (D) using photoprotective mechanisms such as the xanthophyll cycle, Different mathematical models were applied to each P-I curve to determine which one adjusted better to our results. The best fitted model was chosen to calculate the maxima l photosynthetic rate (Pmax, µmolO2.m-2.s-1), the photosynthetic quantum efficiency at limit i ng irradiances (α, µmolO2/µmolphotons) and the saturation irradiance (Ik, µmolphotons.m-2.s-1) calculated as the ratio between Pmax and α for each treatment incorporating error propagation.
17
and using the excitation energy in photochemistry (P) (Krause and Weiss, 1991). The sum of this processes is 1 (F+D+P=1) and the increment in one of them is done at the expenses of the other(s) (Falbel et al., 1994; Maxwell and Johnson 2000). After dark-adaptation, all the reaction centers of the photosynthetic tissue are open, the components of the electron transport chain are oxidized and the photoprotective heat dissipating mechanisms (xanthophyll cycle) are relaxed. At this point, a weak measuring light (0.15 µmolphotons.m-2.s-1) is applied on the leaf tissue
with a PAM fluorometer. This weak light makes chlorophyll to fluoresce but is not strong enough to induce the electron transport chain. This fluorescence emission is called minim um or basal fluorescence (F0). F0 is normally quite stable, and represents the fluorescence emissio n when all the reaction centers are open, without beginning the photosynthetic process. Then, a short pulse of saturating light (>10,000 µmolphotons.m-2.s-1 during 0.4-0.8 s) is applied. At this
point all the reaction centers close, but the saturating light pulse doesn’t last for enough time to induce photochemical processes (P=0) and the fluorescence yield increases rapidly to its maximum (Fm), after what it slowly declines (Ralph and Gademann, 2005). The saturating light pulse also activates the heat dissipating mechanisms and this why the decrease in Fm is frequently considered to be related with the increase of D (as P=0) and results on the decrease of Fv/Fm. Fv/Fm is determined from the following equation (2) (Larkum et al., 2006).
𝐹𝑣
𝐹𝑚=
𝐹𝑚 − 𝐹0 𝐹𝑚
Equation 2: Maximal photochemical efficiency of PSII. Fv - variable fluorescence; Fm -
maximum fluorescence; F0 - basal fluorescence.
For each tank, two mature leaves from different shoots were marked to the daily measure of fluorescence parameters. Dark adaptation was done by fitting a dark adaptation clip to the leaf. After one hour and a half of dark acclimation fluorescence measuremnents took place.
18
2.8. Rapid Light Curves
Productivity can be estimated using rapid light curves, where the relative maximum electron transport rate (rETRmax, yy axis) is plotted as a function of photosynthetically active radiation (PAR, xx axis). These curves of rapid light response have been used in a wide range of seagrass studies (Ralph and Gademann 2005; Saroussi and Beer 2007).
In light-adapted tissues, the effective quantum yield (∆F/F’m) is measured by emitting a short-saturating pulse of light to light adapted leaves. It measures the efficiency of the photosystem II (PSII) photochemistry and gives information about the proportion of the light absorbed by chlorophyll associated with PSII that is used in photochemistry (i.e. PSII quantum yield in the light) (Mvungi, 2011) by the following equation (3) (Larkum et al., 2006):
∆𝐹 𝐹′𝑚=
𝐹′𝑚 − 𝐹𝑡 𝐹′𝑚
Equation 3: Effective Quantum Yield; ∆F - proportion of open reaction centers; F’m –
maximum fluorescence in the light; Ft – steady-state level of fluorescence.
F/F’m can be used to calculate the linear relative electron transport rate (rETR) by the following equation (4) (Silva et al., 2009):
𝑟𝐸𝑇𝑅 = ∆𝐹
𝐹′𝑚 × 𝑃𝐴𝑅
Equation 4: Relative electron transport rate. F/F’m – effective quantum yield; PAR –
photosynthetically active radiation.
Eight consecutive light levels of 13, 43, 92, 158, 234, 320, 464 and 628 μmolphotons.m-2.s- 1
were applied. The relative electron transport rate of C. nodosa leaves were measured in replicates (n=8, except for LL (REF and CO2) treatments, to which n=7) out of each of the 6 different treatments. Shoots chosen for RLC measurements were representative of the shoots observed at each tank.
19
2.9. Mathematical Models: Photosynthetic Light Response Curves and Rapid Light Curves
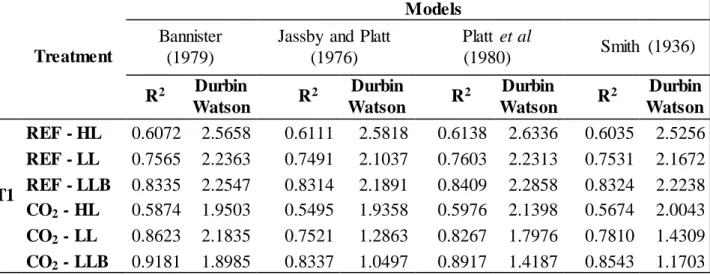
Some mathematical models were tested to determine the best fit to the set of gross photosynthetic rates-irradiance pairs in each of the treatments tested. The application of these mathematical models to the results obtained with the oxygen electrode involves the use of gross photosynthetic rates (net photosynthetic rate measured plus dark respiration) as one of their limitations is that they do not work with negative values. The mathematical models tested were developed by: Smith (1936), Jassby and Platt (1976), Platt et al (1980) and Bannister (1979). The same models were applied to rapid light curves. The selection of the mathematic model that best fit the overall responses in each treatment was determined according to the value of the correlation coefficient (R). Still, when the correlation coefficient was identical for more than one of the models tested, it was also used a Durbin-Watson statistic for autocorrelat io n, which function is to test the independence of residual values within each other. The Durbin-Watson parameter is equal to 2 when there is no autocorrelation. The deviation from this value indicate the degree of correlation among the residuals.
Curves were fitted using “SigmaPlot” (Copyright © 2008 Systat Software, Inc. Germany, Sigmaplot for Windows Version 11.0).
Different mathematical models were applied to each RLC to determine which one adjusted better to the results obtained. The best fitted model was chosen to calculate the maxima l relative electron transport rate (rETRmax, μmolelectrons.m-2.s-1), the light utilization coefficie nt (α, µmolelectrons/µmolphotons) and the saturation irradiance (Ik, µmolphotons.m-2.s-1) calculated as the ratio between rETRmax and α for each treatment incorporating error propagation.
20
2.10. Photosynthetic Pigments Analysis
C. nodosa frozen leaf samples (0.19 g – 0.22 g) were ground to powder with sodium ascorbate
(C6H7NaO6), to avoid pigments degradation, in liquid nitrogen. Photosynthetic pigments were extracted under dim light, in 100 % acetone buffered with calcium carbonate (CaCO3) (Abadía and Abadía, 1993). The extracts (5 ml) were filtered with LS 5.0 µm membrane and hydrophobic PTFE 0.2 µm filters.
The spectrophotometer measures the absorption of light at a particular wavelength by shining a beam of electromagnetic radiation onto a sample. It is a common and easy way to quantify several substances and is commonly used to quantify chlorophylls a and b and carotenoids present in a mixture (Dudek et al., 2014). Chlorophylls a and b and total carotenoids extracts were read spectrophotometrically, at three different wavelengths: 470 nm, 644.8 nm and 661.6 nm (Beckman-Coulter DU 650 spectrophotometer, Brea CA, USA). Quantification was done using the following equations (5, 6, and 7) of Lichtenthaler and Buschmann (2001):
5) Chl a (µg/ml) = 11.24 A661.6 – 2.04 A644.8 6) Chl b (µg/ml) = 20.13 A644.8 – 4.19 A661.6
7) C (x+c) (µg/ml) = (1000 A470 – 1.90 ca – 63.14 cb) /214
Equation 5: Chlorophyll a (Chl a); Equation 6: Chlorophyll b (Chl b);
Equation 7: Carotenoids (C (x+c); xanthophylls and carotenes);
However, when the amount of pigments to be analyzed is higher than 3, the estimation of individual pigment concentration through spectrophotometry is less efficient (Dudek et al., 2014), once chlorophylls and carotenoids have similar spectra and the absorption peaks of the different carotenoids are very close making it impossible to accurately identify each carotenoid by spectrophotometry (Dudek et al., 2014). Carotenoids (β-carotene, lutein, neoxanthin, taraxanthin, violaxanthin, antheraxanthin and zeaxanthin) were separated and quantified by high performance liquid chromatography (HPLC), as described in Larbi et al. (2004) after de las Rivas et al. (1989).
Liquid chromatography analysis was performed in an Alliance Waters 2695 separation module (Milford MA, USA), with a Waters 2996 photodiode array detector and a Waters
21
Novapak C18 radial 86100 mm compression column (4 mm particle size). The basic princip le of liquid chromatography application relies on the fact that, under the same circumstances each component in a mixture usually interacts with its environment distinctively from all other components (Bidlingmeyer, 1992). The extracted pigments were dissolved in a mixture of appropriate organic solvents (filtered and sonicated prior to use, R1: acetonitrile, methanol and triethylamine (TEA); and R2: acetonitrile, methanol, Milli-Q, acetate ethyl and TEA; mobile phase) and pumped through a column, in precise volumes (20 µl) regulated by an injector. In the course of the injection, extracts were maintained at 5 ºC and the column was kept at a constant temperature of 25 ºC. The mobile phase was forced through the packing material, and the pigments separation occurs as a function of their affinity for both the mobile and stationary phases. A detector recorded the concentration of each pigment that migrates at different rates, having different retention times within the column (Bidlingmeyer, 1992). The chromatogra m is the output of the HPLC and shows detector responses indicating the presence of the components as “peaks” whose area corresponds to a certain concentration after calibratio n (Malviya et al., 2009). For photosynthetic pigments quantification, the device was previous ly calibrated for each pigment by injecting known amounts of commercially available pure pigments (CaroteNature, Lupsingen, Switzerland) (de las Rivas et al. 1989).
2.11. Data Analysis
All data was statistically analyzed with the program “Sigmaplot” (Copyright © 2008 Systat Software, Inc. Germany, Sigmaplot for Windows Version 11.0). Before analyses, all data were tested for normality (Shapiro-Wilk tests) and homogeneity of variances and transformed when necessary.
A statistical t-test (p<0.001) was applied to detect differences in the physico-chemical data of pH, TA, DIC, pCO2 and inorganic carbon forms (CO2, HCO3- and CO32-), obtained from DIC analysis and used for system characterization.
Oxygen (optode) and pCO2 (IRGA) data obtained along the day were daily integrated for each day (daily dose) and analyzed with a t-test (p<0.001) to detect differences between REF and CO2 treatments. Differences in the irradiance reaching C. nodosa leaves in distinct light levels treatments (HL, LL and LLB) were analyzed by a non-parametric Kruskal-Wallis test (One Way Analysis of Variance on Ranks), with p<0.001, because data were not normalit y distributed.
22
One Way Analysis of Variance tests for each CO2 treatment were applied to detect differe nces in the fluorescence RLCs (rETRmax, α and Ik) and photosynthetic P-I curves (Pmax, α, Ik and Rd) derived parameters among light treatments (p<0.05). In case of significant effect detected, a posthoc Student-Newman-Keuls test was applied. In the case of Fv/Fm a two-way ANOVA test was applied. Once data failed the Two-Way ANOVA assumptions even after transformation, the p-value was lowered to 0.01 to minimize the risk of a Type 1 error (Underwood, 1997).
Differences in the concentration of chlorophylls (Chl a, Chl b and Chl T) and chlorophyll a/b ratio (Chl a/b) in C. nodosa leaves among the three sampling periods (Cádiz, T0 and T1) were tested with a one-way ANOVAs. Student-Newman-Keuls post-hoc test was used whenever significant differences were detected by one-way ANOVA. Since plants’ collection in Cádiz was at noon, only T0-noon and T1-noon data were considered in this analysis. Differe nces between T0 and T1 in plants harvested at pre-dawn were tested with a t-test.
A two-way ANOVA tests were conducted to detect significant effects of CO2, light and sampling period (pre-dawn and noon) on chlorophyll (Chl a, Chl b and Chl T) and xanthophyl l at the end of the experiment (T1). Whenever the variance test failed (for AZ/VAZ ratio), a t-test was used to detect differences between pre-dawn and noon sampling period for differe nt light treatments. When P<0,050 the effect tested was considered statistically significant.
3. Results
3.1. Experimental Physical-Chemical Parameters
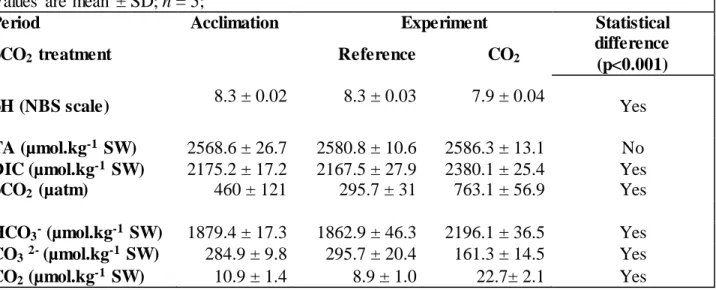
The concentration of CO2 and HCO3- increased in the high pCO2 tanks while CO3 2-concentration decreased, when compared to the reference treatments. As expected, pH was significantly lower in the high pCO2 tanks. Total alkalinity was not significantly differe nt among treatments (Table 1). On contrary, dissolved inorganic carbon was significantly differe nt between treatments, as projected in experimental design, ensuring the differences between distinct pCO2 conditions imposed.
23
Water salinity remained constant at 36 psu throughout the experiment and between differe nt treatments. The maximum and minimum mean water temperature registered was 27.3 and 20.4 ºC, respectively (Fig. 8A). Daily averaged integrated PAR at the surface of the mesocosm was 52 molphotons.m-2.d-1 with ca. 14 hours of light photoperiod (Observatório Astronómico de Lisboa, 2015) and a maximum mean value of 1791.5 µmolphotons.m-2.s-1 (Fig. 8B). Despite the fluctuations, the irradiance values exhibited a typical diurnal pattern with low irradiances in the morning, highest irradiances from midday until the early afternoon and a decrease in irradiances as the day progressed. Low light (LL) and low blue light (LLB) treatments received 32 – 33% and 24 - 26% of the irradiance reaching the high light (HL) treatments, respectively. The light intensity reaching HL treatment was statistically different (p<0.001) from the light intens it y reaching both LL and LLB treatments. On the other hand, no statistically differences were found in the intensity of light between both low light treatments (LL and LLB). Thus, the differe nces between these two treatments can be attributed to the light quality.
The daily fluctuation in pCO2 values in the experimental tanks followed the expected trend with higher values at night, when respiration surpasses photosynthesis, and the opposite during the day, when photosynthesis is higher than respiration. CO2 partial pressure decreased ca. 50% on the reference treatments and ca. 63% on CO2 enriched treatments (Fig. 8C). As the CO2 and O2 evolution related with photosynthesis and respiration are opposite, pCO2 and dissolved oxygen (DO) varied inversely along the day, with higher values between 11 a.m. and 6 p.m. DO values were similar in both treatments throughout the day and no significant differe nces between the different pCO2 treatments (REF and CO2) were found.
Table 1. Carbonate system parameters during acclimation and experimental periods; Statistica l
differences were determined in the experimental period between Reference and CO2 treatments. Values are mean ± SD; n = 5;
Period Acclimation Experiment Statistical
difference (p<0.001)
pCO2 treatment Reference CO2
pH (NBS scale) 8.3 ± 0.02 8.3 ± 0.03 7.9 ± 0.04 Yes
TA (µmol.kg-1 SW) 2568.6 ± 26.7 2580.8 ± 10.6 2586.3 ± 13.1 No
DIC (µmol.kg-1 SW) 2175.2 ± 17.2 2167.5 ± 27.9 2380.1 ± 25.4 Yes
pCO2 (µatm) 460 ± 121 295.7 ± 31 763.1 ± 56.9 Yes
HCO3- (µmol.kg-1 SW) 1879.4 ± 17.3 1862.9 ± 46.3 2196.1 ± 36.5 Yes
CO32- (µmol.kg-1 SW) 284.9 ± 9.8 295.7 ± 20.4 161.3 ± 14.5 Yes