Food Science and Technology
DO:
D https://doi.org/10.1590/1678-457X.31716
OSSN 0101-2061 (Print) OSSN 1678-457X (Dnline)
1 Introduction
Turkey is one of the major honey producers in terms of quantity, variety and quality. Ot is in the second place as of number of beehives (~ 4.4 million) and the fourth place as of amount of honey production (~ 102 000 tons/year) in the world (Turkish Statistical Onstitute, 2015). Turkey has a very diverse indigenous flora for flower honey production thanks to more than 10 000 flower types suitable for the nectar forage (Nakilcioğlu & Ötleş, 2015). Ot is leader in pine honey production by having almost 92% of the world’s production (Yücel, 2013). Honey is an important commodity in Turkey for its social and economic impacts. Almost 182 000 families live off the honey production and it has a share of almost 6% in animal production revenue of Turkey (Saner et al., 2011).
Moisture is critical for honey as for other foods. Moisture content is taken as a key indicator for the maturity, density, viscosity, state, stability, and important for the quality and processing characteristics of honey. Honey is accepted and assessed, or rejected based on its moisture content in the industry. Not the moisture content but the water activity is responsible for the quality and process attributes of honey as in other foods (Zamora & Chirife, 2006). However, since measuring the moisture content (MC) is much more practical and economical than measuring the water activity (aw), in the industry honey is evaluated in terms of water by determining MC. Refractometry is the effective method used to measure MC of honey.
The best possible way to assess honey quality with regard to water is being knowledegable about its aw and MC, and establishing a correlation between them. The correlation could be established to study a wide range of aw and MC using moisture sorption isotherms (MSO) which is mostly sigmoidal in shape. Ot could also be established to work a narrow range of aw and MC for practical purposes which corresponds to a portion of the MSO obtained at the same temperature. A considerable amount of effort has been spent for practical purposes for honeys from various geographies in the world (Table 1). Some of these works revealed significant linear correlations between aw and MC and some resulted in no correlation. Among them, the largest one was conducted by Gleiter et al. (2006) using 294 samples, and the longest one was conducted by Cavia et al. (2004) using samples harvested during 3 years.
Contrary to the importance of Turkey in the World’s honey production and significant contribution of honey to Turkey’s socio economical state, a comprehensive work revealing the relationship between aw and MC was not conducted for Turkish honeys yet to the best knowledge of the authors. Kayacier & Karaman (2008) reported some aw and MC data for some selected Turkish honeys. This workwas not aiming to find a correlation between them, and in fact the data was too limited to deduce such a correlation. Ot was about rheological and physicochemical characteristics of selected Turkish honeys.
Correlation between water activity and moisture content of Turkish
flower and pine honeys
Seher SERİN1, Kamile Nazan TURHAN2, Mahir TURHAN1
Received 07 Dec., 2016 Accepted 28 Nov., 2017
1 Department of Food Engineering, University of Mersin, Ciftlikkoy, Mersin Turkey 2 Department of Food Engineering, Izmir University of Economics, Balcova, İzmir Turkey
*Corresponding author: [email protected]
Abstract
Water activity (aw) and moisture content (MC) of Turkish liquid flower and pine honeys were determined. Samples (706 flower and 257 pine) were collected during the honey harvesting seasons of 2010-2014 from 137 apiaries in locations with different climatic conditions all over the land. Up to date, this work is the first one seeking for a correlation between aw and MC for Turkish honeys, and also it is the largest and longest one among similar works to the best of the researchers’ knowledge. The ranges of aw and MC values of the Turkish honeys were in agreement with the literature. aw was determined between 0.470 and 0.563 for the flower honeys, and between 0.492 and 0.589 for the pine honeys. MC was measured between 15.0 and 20.4% (m/m) for the flower honeys and between 15.1 and 20.4% (m/m) for the pine honeys. Statistically different linear regression equations (aw versus MC) fitted data of the flower and pine honeys with significantly high coefficients of determinations (R2> 0.848), small mean absolute errors (< 1.39%) and no biases. The linear equations were analogous to equations giving the correlation between aw and MC for other honeys in the literature.
Keywords: water activity; moisture content; flower honey; pine honey; Turkey.
The purpose of the current work is to search for a correlation between aw and MC of Turkish honeys to contribute to survey efforts to identify its characteristics. Ot is the first work looking for such a relationship between aw and MC in Turkish honeys, and it is the largest (964 samples) and longest one (4 years) compared to works conducted for other honeys up to date to the best knowledge of the workers.
2 Materials and methods
Cleaned honey samples were donated to our laboratory by a commercial honey plant in water and air proof jars. Honeys were obtained from 237 different apiaries during the honey harvesting seasons of 2011-2014. Apiaries were selected from different geographical locations in order to avoid obtaining samples from the same sources and to ensure the representation of Turkish honeys. Flower honeys were sunflower (147), clover (64), cotton(71), citrus (129), chesnut (85), wild flower (113), thyme (42) and mixtures of two or more of them (56). Pine honeys were from pinaries in western Turkey (the Aegean Region), mainly Mugla province.
Honey samples were analyzed for aw and MC immediately after receiving. aw and MC of 706 flower and 257 pine honey samples were determined. aw was measured at 20 oC using a water activity instrument (Novasina, AW Sprint, TH-500, Switzerland). Ot was calibrated by saturated salt solutions provided by the supplier for every 30 measurements. MC was determined as percentage by mass (m/m) at 20 °C using a hand refractomer (ATC, Hong Kong). Both measurements were performed in triplicate, and evaluations were made using mean values.
Statistical analyses were conducted using SPSS for Windows Ver. 16.0 (P < 0.05) and honey samples were classified through the Discriminant Function Analysis in the SPSS.
3 Results and discussions
3.1 aw and MC of Turkish flower and pine honeys
aw and MC of flower honey samples were determined between 0.470 and 0.563, and 15.0% and 20.4%, respectively
(Table 1). aw and MC of pine honey samples were
between 0.492 and 0.589 and 15.1% and 20.4%, respectively (Table 1). For the stability of honey, aw should be at most 0.60, and MC is advised to be lower than 20% (Zamora et al., 2006) excluding honeys produced under humid or tropical conditions. Any flower or pine honey sample did not exceed the 0.6-limit for aw and limited number of samples exceed the 20%-limit for MC (Figure 1). However, aw values not greater than 0.6 can be taken as an indicator for good apiery practices in Turkey, especially with regard to harvesting and keeping honey at proper conditions.
Kayacier & Karaman (2008) and Şenyuva et al. (2009) reported aw and MC data for some liquid Turkish honeys. Kayacier & Karaman (2008) measured aw and MC of three monoflower honeys between 0.51 and 0.52, and 16.3 and 17.9%, respectively. They determined aw and MC of one pine honey sample to be 0.52 and 16.6%, respectively. Şenyuva et al. (2009) reported aw between 0.44 and 0.61 for 5 honeydew honey samples, and between 0.361 and 0.661 for 65 flower honey samples. The span
of the aw values and MC values obtained in this work are in good agreement with ones obtained for other Turkish honeys in the literature.
3.2 Comparision with other honeys in the literature in terms
of aw and MC
Summary of works giving correlations between aw and MC of liquid honeys from different locations in the world is tabulated in Table 1. The minumum and maximum aw values were found to be 0.41 (Adenekan et al., 2010) and 0.691 (Cavia et al., 2004) for flower honeys, respectively. For flower honeys, the smallest and greatest MC was 13.1% (Lazaridou et al., 2004) and 22.6% (Gleiter et al., 2006), respectively. The range of aw and MC values obtained in this work is considered to be in good agreement with those obtained in other works in the literature for flower honeys.
For honeydew honeys in the literature, the minumum and maximum aw values were 0.438 (Abramovic et al., 2008) and 0.663 (Lazaridou et al., 2004), respectively (Table 1). For them, the smallest and highest MC values were 12.6% and % 18.9% (Lazaridou et al., 2004), respectively (Table 1). As in flower honeys, the findings of this work for honeydew honeys (pine honeys) are reasonably in good agreement with findings of works on honeydew honeys in the literature.
Though Turkish pine honey has already been compared with other honeydew honeys in the literature in terms of aw and MC, it also was compared particularly with Greek pine honeys since Turkey and Greece are the only pine honey producers in the world. The mean aw and MC values for Turkish pine honeys were determined to be 0.532 ± 0.022 and 17.4 ± 1.3%, respectively. For Greek pine honeys, mean values of aw and MC were calculated to be 0.588 ± 0.028 and 15.8 ± 1.4%, respectively (Lazaridou et al., 2004). The aw and MC of Greek pine honeys exhibited a distribution between 0.559 and 0.663, and 13.9% - 18.9%, respectively (Table 1). As in the previous comparisions with other honeys in the literature, it can readily be concluded that Turkish and Greek pine honeys are comparable in terms of mean values and ranges of aw and MC.
3.3 Correlation between aw and MC for Turkish flower and
pine honeys
aw exhibited a linear variation versus MC for honey samples in aggregate (Figure 1). Multidiscriminant Function Analysis gathered data for flower and pine honeys apparently in two separate groups (Figure 2). So, the analysis revealed that flower and pine honeys are from different populations (P < 0.05) (Figure 2) in terms of the aw-MC correlation. Namely, each honey has its own aw-MC correlation. Based on the multidiscriminant analysis the variation of aw versus MC was separately evaluated.
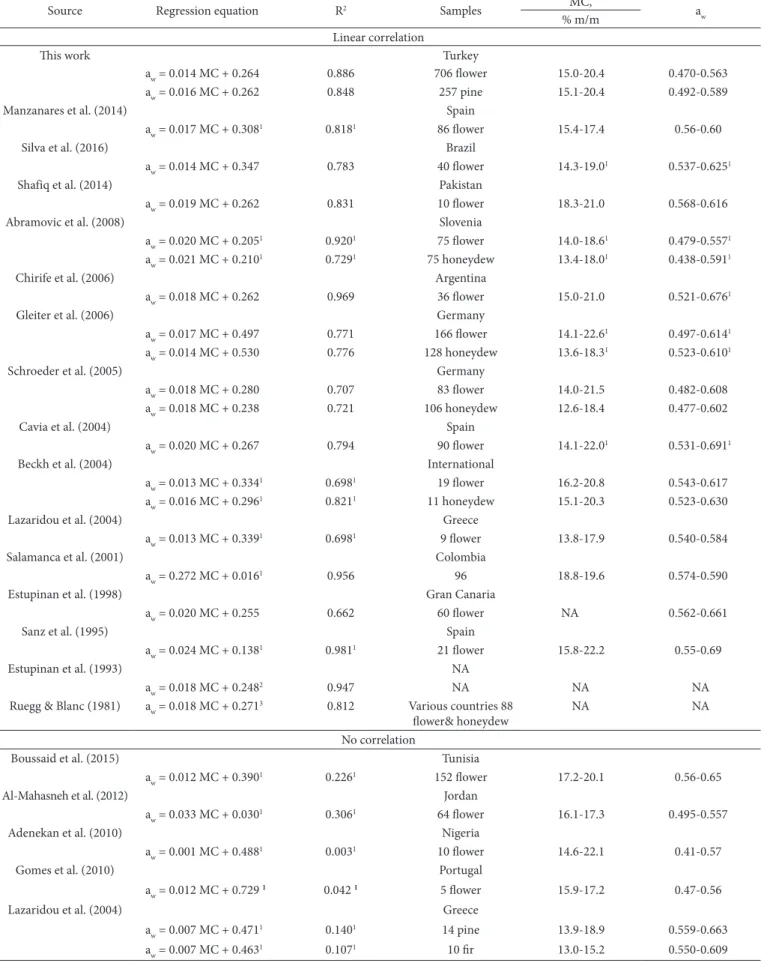
Table 1. Works looking for a correlation between water activity (aw) and moisture content (MC) of liquid honeys.
Source Regression equation R2 Samples MC, a
w
% m/m Linear correlation
This work Turkey
aw = 0.014 MC + 0.264 0.886 706 flower 15.0-20.4 0.470-0.563
aw = 0.016 MC + 0.262 0.848 257 pine 15.1-20.4 0.492-0.589
Manzanares et al. (2014) Spain
aw = 0.017 MC + 0.3081 0.8181 86 flower 15.4-17.4 0.56-0.60
Silva et al. (2016) Brazil
aw = 0.014 MC + 0.347 0.783 40 flower 14.3-19.01 0.537-0.6251
Shafiq et al. (2014) Pakistan
aw = 0.019 MC + 0.262 0.831 10 flower 18.3-21.0 0.568-0.616
Abramovic et al. (2008) Slovenia
aw = 0.020 MC + 0.2051 0.9201 75 flower 14.0-18.61 0.479-0.5571
aw = 0.021 MC + 0.2101 0.7291 75 honeydew 13.4-18.01 0.438-0.5911
Chirife et al. (2006) Argentina
aw = 0.018 MC + 0.262 0.969 36 flower 15.0-21.0 0.521-0.6761
Gleiter et al. (2006) Germany
aw = 0.017 MC + 0.497 0.771 166 flower 14.1-22.61 0.497-0.6141
aw = 0.014 MC + 0.530 0.776 128 honeydew 13.6-18.31 0.523-0.6101
Schroeder et al. (2005) Germany
aw = 0.018 MC + 0.280 0.707 83 flower 14.0-21.5 0.482-0.608
aw = 0.018 MC + 0.238 0.721 106 honeydew 12.6-18.4 0.477-0.602
Cavia et al. (2004) Spain
aw = 0.020 MC + 0.267 0.794 90 flower 14.1-22.01 0.531-0.6911
Beckh et al. (2004) Onternational
aw = 0.013 MC + 0.3341 0.6981 19 flower 16.2-20.8 0.543-0.617
aw = 0.016 MC + 0.2961 0.8211 11 honeydew 15.1-20.3 0.523-0.630
Lazaridou et al. (2004) Greece
aw = 0.013 MC + 0.3391 0.6981 9 flower 13.8-17.9 0.540-0.584
Salamanca et al. (2001) Colombia
aw = 0.272 MC + 0.0161 0.956 96 18.8-19.6 0.574-0.590
Estupinan et al. (1998) Gran Canaria
aw = 0.020 MC + 0.255 0.662 60 flower NA 0.562-0.661
Sanz et al. (1995) Spain
aw = 0.024 MC + 0.1381 0.9811 21 flower 15.8-22.2 0.55-0.69
Estupinan et al. (1993) NA
aw = 0.018 MC + 0.2482 0.947 NA NA NA
Ruegg & Blanc (1981) aw = 0.018 MC + 0.2713 0.812 Various countries 88
flower& honeydew
NA NA
No correlation
Boussaid et al. (2015) Tunisia
aw = 0.012 MC + 0.3901 0.2261 152 flower 17.2-20.1 0.56-0.65
Al-Mahasneh et al. (2012) Jordan
aw = 0.033 MC + 0.0301 0.3061 64 flower 16.1-17.3 0.495-0.557
Adenekan et al. (2010) Nigeria
aw = 0.001 MC + 0.4881 0.0031 10 flower 14.6-22.1 0.41-0.57
Gomes et al. (2010) Portugal
aw = 0.012 MC + 0.729 1 0.042 1 5 flower 15.9-17.2 0.47-0.56
Lazaridou et al. (2004) Greece
aw = 0.007 MC + 0.4711 0.1401 14 pine 13.9-18.9 0.559-0.663
aw = 0.007 MC + 0.4631 0.1071 10 fir 13.0-15.2 0.550-0.609
A common linear equation was obtained using all data points altough the multi discriminant analysis revealed that the honeys were from different populations. Ots slope (0.015) and intercept (0.251) were pretty close to those of specific regression equations for flower and pine honeys and parallel to them (Figure 1). The correlation of the common equation was weaker than those of the specific equations (R2 = 0.715 versus R2 = 0.886 and R2 = 0.848) (Figure 1). Deviation of calculated aw values from the experimental ones was determined using both specific and common regression equations. The mean of absolute errors were 1.00% and 1.32% in case of the flower honey for the specific and common regression equation, respectively. On case of the pine honey, it was 1.39% and 3.23% for the specific and common regression equation, respectively.
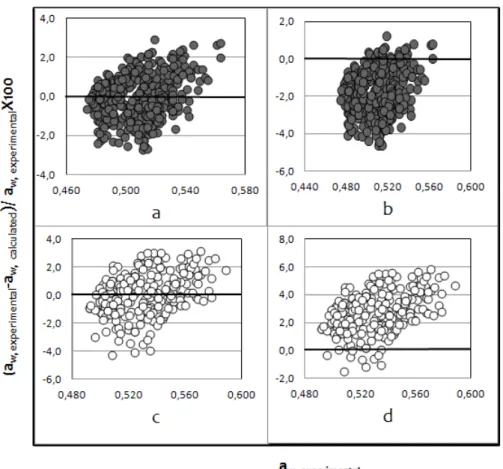
Percent residues of aw
(
aw, experimental−aw calculated, aw, experimentalx100)
are presented in Figure 3 for flower and pine honeys using specific and common regression equations. On case of specific equations, residues showed no bias and randomly scattered around the abscissa between -4.49% and 5.03% for the flower honey (Figure 2a) and between 4.13% - 4.66% for the pine honey (Figure 2c). On case of common equation, they showed relatively biased distribution around the abscissa for both honeys. Deviations piled up below the abscissa for the flower honey between -5.83% and 3.78% (Figure 2b) and above it for the pine honey between -0.91% - 7.55% (Figure 2d).
The common equation could be supposed to be practical and dependable to calculate aw from MC, or vice versa, despite of the discriminant analysis above, due to its small means of absolute error for both flower honey (1.39%) and pine honey (3.23%). However, evident bias of residues around the abscissa would make its use technically erroneous (Figure 3).
3.4 Comparision with other honeys in the literature in terms
of the correlation between aw and MC
Previous works conducted under similar conditions to those in this work (at 20 °C and/or 25 °C using a refractometer and a water activity instrument) for other honeys from various geographies in the world showed either a linear correlation or no correlation between aw and MC (Table 1).
A considerable number of previous works for other honeys showed a significant positive linear correlation between aw and MC as in this work (Table 1). On some, the correlation was quite strong with R2 ≥ 0.90 (Abramovic et al., 2008; Chirife et al., 2006; Salamanca et al., 2001; Sanz et al., 1995; Estupinan et al., 1993). For flower honeys, the slope was between 0.013 (Lazaridou et al., 2004) and 0.024 (Sanz et al., 1995), and the intercept was between 0.138 (Sanz et al., 1995) and 0.497 (Gleiter et al., 2006). For honeydew honeys, the slope was between 0.014 (Gleiter et al., 2006) and 0.021 (Abramovic et al., 2008), and the intercept was between 0.238 (Schroeder et al., 2005) and 0.53 (Gleiter et al., 2006). The slope and intercepts for Turkish flower and pine honeys were within the ranges of slopes and intercepts for other honeys in the literature. The comparativeness of slopes points that aw of honeys harvested in different geographies and at different times give almost the same response against the varying MC.
Figure 1. Variation of aw versus MC and fit of regression equations for
Turkish liquid flower and pine honeys.
Figure 2. Discrimination analysis for Turkish liquid flower and pine
honeys.
This work did not conform to some previous works. Data of Boussaid et al. (2015), Al-Mahasneh et al. (2012), Adenekan et al. (2010), Gomes et al. (2010) and Beckh et al. (2004) exhibited no correlation between aw and MC with insignificant R2 values for flower honey samples (Table 1). The same was observed by Lazaridou et al. (2004) for 24 honeydew samples. (Table 1). Though Turkish and Greek pine honeys were comparaple with respect to mean values and limits of aw and MC values, they were not comparative with respect to correlation between aw and MC. aw of Greek honeys did not exhibit a correlation versus MC (Table 1; Lazaridou et al., 2004).
4 Conclusions
Turkish liquid flower and pine honeys showed parallel positive linear correlations for aw versus MC. The flower honeys have lower aw values than pine honeys at the same MC. This work is in close agreement with considerable amount of works in the literature in terms of values of aw and MC, and the correlation between them.
Acknowledgements
Authors gratefully acknowledge ANAVARZA Bal, Kozan-Adana, Turkey for donating honey samples.
References
Abramovic, H., Jamnik, M., Burkan, L., & Kac, M. (2008). Water activity and water content in Slovenian honeys. Food Control, 19(11), 1086-1090. http://dx.doi.org/10.1016/j.foodcont.2007.11.008.
Adenekan, M. D., Amusa, N. A., Lawal, A. D., & Dkpeze, V. E. (2010). Physico-chemical and microbiological properties of honey samples obtained from Obadan. Journal of Microbiology and Antimicrobials, 2(8), 100-104.
Al-Mahasneh, M. A., Rababah, T. M., Amer, M., & Al-Dmoush, M. (2012). Modeling physical and rheological behavior of minimally processed wild flowers honey. Journal of Food Processing and
Preservation, 38(4), 21-30.
Beckh, G., Wessel, P., & Lüllmann, C. (2004). Natürliche Bestandteile des Honigs: Hefen und Deren Stoffwechselprodukte–Teil 2: Der Wassergehalt und die Wasseraktivität als Qualitatsparameter mit Bezug zum Hefewachstum. Deutsche Lebensmittel-Rundschau, 1, 14-17. Boussaid, A., Chouaibi, M., Rezig, L., Missaoui, R., Donsí, F., Ferrari,
G., & Hamdi, S. (2015). Physicochemical, rheological, and thermal properties of six types of honey from various floral origins in Tunisia.
International Journal of Food Properties, 18(12), 2624-2637. http://
dx.doi.org/10.1080/10942912.2014.1001072.
Cavia, M. M., Fernáez-Muiño, M. A., Huidobro, J. F., & Sancho, M. T. (2004). Correlation between moisture and water activity of honeys harvested in different years. Journal of Food Science, 69(5), 368-370. http://dx.doi.org/10.1111/j.1365-2621.2004.tb10699.x.
Figure 3. Percent residues from specific equations (a-flower honey, c-pine honey) and common equation (b-flower honey, d-pine honey) regressed
Chirife, J., Zamora, M. C., & Motto, A. (2006). The correlation between water activity and % moisture in honey: Fundamental aspects and application to Argentine honeys. Journal of Food Engineering, 72(12), 287-292. http://dx.doi.org/10.1016/j.jfoodeng.2004.12.009. Estupinan, S., Sanjuan E, & Millan, R. (1993). Agua y actividad de agua
en mieles artesanales. determinación y significado. Boletín Informativo
de la Asociación de Apicultores de Gran Canaria, 2(3), 27-29.
Estupinan, S., Sanjuan, E., Millan, R., & Gonzales-Cortes, M. A. (1998). Calculo y aplicacion de modeles de prediccion de actividad de agua en mieles artesanales. Microbiologie-Aliments-Nutrition, 16(4), 259-264. Gleiter, R. A., Horn, H., & Osengard, H. D. (2006). Onfluence of type and
state of crystallization on the water activity of honey. Food Chemistry, 96(3), 441-445. http://dx.doi.org/10.1016/j.foodchem.2005.03.051. Gomes, S., Dias, L. G., Moreira, L. L., Rodrigues, P., & Estevinho, L. (2010). Physicochemical, microbiological and antimicrobial properties of commercial honeys from Portugal. Food and Chemical
Toxicology, 48(2), 544-548. PMid:19909782. http://dx.doi.org/10.1016/j.
fct.2009.11.029.
Kayacier, A., & Karaman, S. (2008). Rheological and some physicochemical characteristics of selected Turkish honeys. Journal of Texture Studies, 39(10), 17-27. http://dx.doi.org/10.1111/j.1745-4603.2007.00127.x. Lazaridou, A., Biliaderis, C. G., Bacandritsos, N., & Sabatini, A. G. (2004). Composition, thermal and rheological behaviour of selected Greek honeys. Journal of Food Engineering, 64(9), 9-21. http://dx.doi. org/10.1016/j.jfoodeng.2003.09.007.
Manzanares, A. B., García, Z. H., Galdón, B. R., Rodríguez, E. R., & Romero, C. D. (2014). Physicochemical characteristics of minor monofloral honeys from Tenerife, Spain. Food Science and Technology
(Campinas), 55, 572-578.
Nakilcioğlu, E., & Ötleş, S. (2015). Yüzyılları deviren organik bir gıda: Bal. Dünya Gıda, 1, 93-98. Retrieved from http://www.dunyagida. com.tr/yazar.php?id=20&nid=3895
Ruegg, M., & Blanc, B. (1981). The water activity of honey and related sugar solutions. Lebensmittel-Wissenschaft + Technologie, 14(10), 1-6. Salamanca, G. G., Perez, F. C., & Serra, B. J. A. (2001). Determinacion de
la actividad de agua en mieles colombianas de las zonas de Bocaya y
Tolima. Francia: Apiservices Galerıa Apícola Virtual. Retrieved from
http://www.apiservices.com/articulos/salamanca/actividad_agua.htm Saner, G., Yücel, B., Yercan, M., Karaturhan, B., Engindeniz, S., Çukur, F., & Kösoğlu, M. (2011). Organik ve konvansiyonel bal üretiminin teknik ve ekonomik yönden geliştirilmesi ve alternatif pazar olanaklarının
saptanması üzerine bir araştırma: İzmir İli Kemalpaşa İlçesi örneği (no.
195). İzmir: Gıda Tarım ve Hayvancılık Bakanlığı Tarımsal Ekonomi ve Politika Geliştirme Enstitüsü Yayın. Retrieved from http://www.tepge. gov.tr/Dosyalar/Yayinlar/d7f9a8235bf54fc799dbc9bad3e3ad8d.pdf Sanz, S., Gradillas, G., Jimeno, F., Perez, C., & Juan, T. (1995). Fermentation problem in Spanish North-Coast honey. Journal of Food Protection, 58(5), 515-518. http://dx.doi.org/10.4315/0362-028X-58.5.515. Schroeder, A., Horn, H., & Pieper, H. J. (2005). The correlation
between moisture content and water activity (aw) in honey. Deutsche
Lebensmittel-Rundschau, 101(4), 139-142.
Şenyuva, H. Z., Gilbert, J., Silici, S., Charlton, A., Dal, C., Gürel, N., & Çimen, D. (2009). Profiling Turkish honeys to determine authenticity using physical and chemical charasteristics. Journal of Agricultural
and Food Chemistry, 57(9), 3911-3919. PMid:19326859. http://
dx.doi.org/10.1021/jf900039s.
Shafiq, H., Shahid, A., & Farid, M. Z. (2014). Physico-chemical properties of honey produced in the central region of punjab, Pakistan. Life
Sciences Leaflets, 52(3), 40-51.
Silva, V. M. D., Carvalho, L. A. D., Dliveira, N. L. D., Torres, R. D. A. Fo, & Resende, J. V. D. (2016). Rheological and thermal properties of selected Brazilian honeys from various floral origins. Journal of
Texture Studies, 47(3), 208-219. http://dx.doi.org/10.1111/jtxs.12174.
Turkish Statistical Onstitute – TSO. (2015). Statistical data for turkish
animal products. Ankara. Retrieved from http://tuikapp.tuik.gov.
tr/hayvancilikapp/hayvancilik.zul
Yücel, B. (2013). Ülkemizin dünya’ya armağanı: Çam balı. Petek, 10, 7-10. Zamora, M. C., & Chirife, J. (2006). Determination of water activity
change due to crystallization in honeys from Argentina. Food Control, 17(9), 59-64. http://dx.doi.org/10.1016/j.foodcont.2004.09.003. Zamora, M. C., Chirife, J., & Roldan, D. (2006). Dn the nature of relationship