(Annals of the Brazilian Academy of Sciences) ISSN 0001-3765
www.scielo.br/aabc
In-flight absolute calibration of the CBERS-2 CCD sensor data
FLÁVIO J. PONZONI1, JURANDIR ZULLO JUNIOR2 and RUBENS A.C. LAMPARELLI2 1Instituto Nacional de Pesquisas Espaciais, Divisão de Sensoriamento Remoto,
Avenida dos Astronautas 1758, 12227-010 São José dos Campos, SP, Brasil
2Universidade Estadual de Campinas, Centro de Pesquisas Meteorológicas e Climáticas Aplicadas à Agricultura, Cidade Universitária “Zeferino Vaz”, 13083-970 Campinas, SP, Brasil.
Manuscript received on May 25, 2006; accepted for publication on July 7, 2007; presented byALCIDESN. SIAL
ABSTRACT
Since the first images of the sensors onboard of CBERS-2 (China-Brazil Earth Resources Satellite) satellite were made available by the National Institute for Space Research (INPE), users have asked information about the conversion of image digital numbers to physical data (radiance or reflectance). This paper describes the main steps that were carried out to calculate the in-flight absolute calibration coefficients for CBERS-2 CCD level 2 (radiometric and geometric correction) images considering the reflectance-based method. Remarks about the preliminary evaluation of these coefficients application are also presented.
Key words: absolute calibration, CBERS-2, CCD, reflectance.
INTRODUCTION
Brazil and China have performed an important joint space program that includes the development of remote sensing satellites. The most important of them is the China-Brazil Earth Resources Satellite (CBERS).
The first satellite developed (CBERS-1) was launched on October 14th 1999 with great success by the Chinese Long March 4B launcher from the Taiyuan Satellite Launch Center in China. Its orbit was Helios-synchronous at a 778 km altitude and it performed about 14 revolutions a day obtaining a complete coverage of the Earth in 26 days. The second satellite (CBERS-2) was launched successfully from the same launch center on October 21st2003, which carries the identical payload as CBERS-1.
The unique characteristics of CBERS-1 and 2 are their multi-sensor payloads with different spatial resolu-tions and image collecting frequencies. These features were specially designed to resolve the broad range of
Corrrespondence to: Flávio Jorge Ponzoni E-mail: [email protected]
space and time scales involved in Brazilian and Chinese ecosystems. CBERS has three on-board sensors: the WFI (Wide Field Imager), High Resolution CCD Camera (CCD), and the Infrared Multispectral Scanner (IRMSS). The spectral coverage and the swath width of these sen-sors are summarized in the Table I.
The CCD (High Resolution CCD Camera) collects 113 km wide images strip with 20 m spatial resolution. Since this camera has a sideways pointing capability of
±32 degrees, it is capable of taking stereoscopic
im-ages of a certain region. In addition, any phenomenon detected by the WFI may be “zoomed in” by the oblique view of the CCD camera with a maximum time lag of 3 days. The two spectral bands of the WFI are also present in the CCD camera that allows complementary data from two sensors with different spatial resolutions.
TABLE I
Spectral coverage of the CBERS-2 sensors.
Parameter CCD IRMSS WFI
0.51–0.73 (PAN) 0.50–1.10 (PAN) 0.63–0.69 0.45–0.52 1.55–1.75 (SWIR) 0.76–0.90 Spectral bands (µm) 0.52–0.59 2.08–2.35 (SWIR)
0.63–0.69 10.4–12.5 (TIR) 0.77–0.89
Spatial resolution 20 m 80 m (PAN & SWIR) 260 m 160 m (TIR)
Swath width (FOV) 113 km (8.32◦) 120 km (8.78◦) 885 km (60◦)
Temporal resolution 26 days 26 days 3–5 days
in 2003, several improvements had been performed in ground stations and image processing algorithms and the new images from CBERS-2 were distributed in China and in Brazil.
The success of any remote sensing program is di-rectly related to the knowledge of both spectral and radio-metric characteristics of the sensor from which the data will be available (Thome et al. 2004). A good example of that is the Landsat 5 Thematic Mapper (TM) sensor, whose radiometric characteristics have been evaluated and updated continuously over the its lifetime (Slater et al. 1987, Thome et al. 1997, 2004, Teillet et al. 2001). Chander et al. (2004) have updated the calibration pro-cedure of Landsat 5 TM data. Ponzoni et al. (2004) have also presented new absolute calibration coefficients for Landsat 5 TM using the Salar de Uyuni as a test site. The access of that knowledge and revised calibration proce-dures have allowed to convert the Digital Numbers (DN) of the TM images in physical data like radiance or re-flectance, which can be related to biophysical and geo-physical parameters.
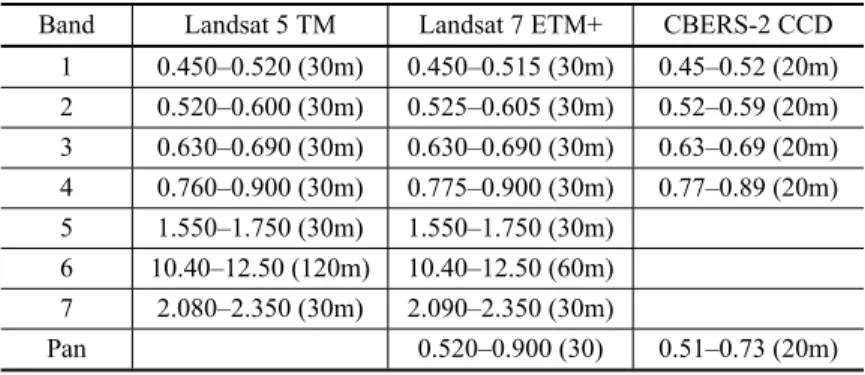
The Brazilian remote sensing user’s community (including several scientific agencies and universities) has explored that relationship since the beginning of the nineties using TM as the main source of data. So, it will be quite encouraging if the same could be done with CBERS-2 images, mainly with the CCD data, since the data between the two sensors are quite similar as can be observed in Table II.
Since the launch of CBERS-2 users have asked in-formation about how to convert the DN to physical data. This conversion could be performed using the pre-launch
sensors calibration or by the internal calibration proce-dure specific for each sensor, but due the lack of reliable pre-launch data it was decided to carry out in-flight ab-solute calibration of the CBERS-2 sensors data using the reflectance-based method at least to allow the men-tioned conversion rather than the evaluation of the sen-sors themselves.
This paper describes the complete procedure to cal-culate the in-flight absolute calibration coefficients for CBERS-2 CCD images using a reference surface located in the north-east region of Brazil to allow the conversion of the DN to physical values.
MATERIALS AND METHODS
THEREFERENCESURFACE
There are no ideal calibration sites in Brazil, few sites were identified in the west part of the State of Bahia (northeast region of Brazil) that have the following pos-itive characteristics:
1. The region presents lower cloud cover indices dur-ing winter time;
2. The altitude is about 850 m over the sea level;
3. Sand is the dominant soil (relative high reflectance);
4. During the winter time, large areas of economical crops are prepared to plant and they present enough dimensions for CBERS-2 sensors calibration pro-poses;
TABLE II
Comparison between Landsat 5 TM, Landsat 7 ETM+ and CBERS-2 CCD spectral range-spatial resolution.
Band Landsat 5 TM Landsat 7 ETM+ CBERS-2 CCD 1 0.450–0.520 (30m) 0.450–0.515 (30m) 0.45–0.52 (20m) 2 0.520–0.600 (30m) 0.525–0.605 (30m) 0.52–0.59 (20m) 3 0.630–0.690 (30m) 0.630–0.690 (30m) 0.63–0.69 (20m) 4 0.760–0.900 (30m) 0.775–0.900 (30m) 0.77–0.89 (20m) 5 1.550–1.750 (30m) 1.550–1.750 (30m)
6 10.40–12.50 (120m) 10.40–12.50 (60m) 7 2.080–2.350 (30m) 2.090–2.350 (30m)
Pan 0.520–0.900 (30) 0.51–0.73 (20m)
6. The reference surfaces present enough isotropy dur-ing the calibration time;
7. The spectral/spatial uniformity is about 6-8%;
8. The region is one of the most arid region of the Brazilian territory;
9. As the reference surfaces are located within farms, there are a lot of roads, thus the access is very easy.
For the reference surface (test site) selection only surfaces covered with bare soil were considered. The spectral characterization of the test site included the spec-tral homogeneity and the isotropy evaluation according to the procedures adopted by Lamparelli et al. (2003).
CALIBRATIONCOEFFICIENTSDETERMINATION
Field data
The selected reference surface was located in Santo Anto-nio farm and the calibration point was defined in latitude –12◦06’46.2” and longitude –46◦00’51.0”.
The calibration campaign was performed on 16 Au-gust 2004 during which two kinds of radiometric mea-surements were carried out: (i) BRFs (Bidirectional Re-flectance Factors) from the reference surface using the ASD FieldSpec radiometer running from 400 nm to 2500 nm (to register the bidirectional radiance from the surface) and a reference panel covered by Spectralon (to allow the irradiance estimation); and (ii) the direct irra-diance from the Sun using a CIMEL 317 sunphotometer running in five spectral bands: B1 1.010 to 1.030 µm;
B2 0.860 to 0.880µm; B3 0.660 to 0.680µm; B4 0.430
to 0.450µm and B5 0.926 to 0.946µm, which data were
utilized in the atmosphere characterization by using the derived aerosol transmittance (τaer) and the water vapor content (UW) estimations based on the same steps de-scribed by Ponzoni et al. (2004) for the in-flight absolute calibration procedure of the Landsat 5 TM sensor.
The first step in both sets of radiometric measure-ments was the central point definition in the reference surface. This was accomplished by a GPS device with an estimated positioning error of 2m taking into account the distance of the borders.
During the CBERS-2 flight over the study area the radiometric measurements (to determine the BRFs) were carried out taking the central point as a cross centre. Forty BRFs values were determined around the central point (ten for each cross axis). Arithmetic averages (one for each spectral band) of these forty BRF values were determined. At the same time, measurements of the di-rect irradiance were performed every 10 minutes with the sunphotometer CIMEL 317.
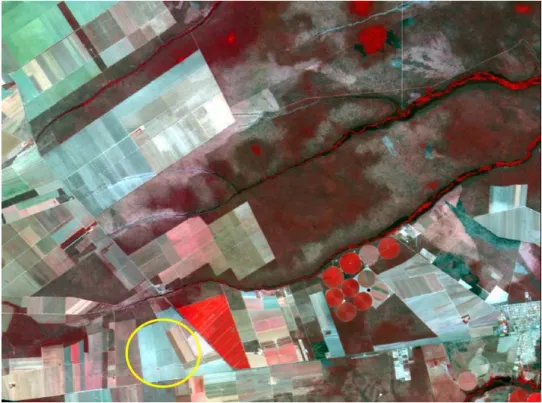
Figure 1 shows a CBERS-2 CCD color composition in which is possible to notice the dominant landscape at the calibration test site. The yellow ring indicates the specific reference surface utilized during the calibration campaign of August 2004.
Image data and calibration coefficients determination
Fig. 1 – CCD-2 (green), CCD-3 (blue) and CCD-4 (red) color composition from the calibration test site. Yellow ring indicates the reference surface.
were then compared with the apparent radiances (in each CCD spectral band) determined from the BRFs collected in the field (average from the forty BRFs measurements) by the 5S atmospheric correction code application de-scribed by Tanré et al. (1990).
The idea was to calibrate the CCD data at level 2 (relative calibration and geometrically corrected), which is the product that is distributed by INPE to the Brazilian remote sensing users.
CCD images from 16 August 2004 (155/113 orbit/ row CBERS-2 WRS reference) were downloaded from the CBERS-2 catalogue at the INPE’s web site and they were georeferenced using the near neighborhood criteria to minimize the georeferencing influence in the DN val-ues according Ponzoni et al. (2004). The authors have also concluded that there is not significant influence of the georeferencing procedure in the DN values of the original images.
The determination of calibration coefficients was based on DNs from the central point localized in the CCD images. The relationship between DNs and the
apparent radiance calculated from the BRFs values was established by the equation below:
CCλ= D Nλ Lapaλ
(1)
where:CCλis the Calibration Coefficient for CCD spec-tral bandλ(λ=1,2,3,4 and 5);
DNλis the digital number from the CCD images in spec-tral bandλ(λ=1,2,3,4 and 5);
Lapaλis the apparent at-sensor radiance determined from the BRF in CCD spectral bandλ(λ=1,2,3,4 and 5)
given by W.m−2.sr−1.µm−1.
Calibration coefficients
The main objective of the calibration coefficients was the conversion of the DN to apparent radiance (or appar-ent reflectance). Therefore the equation 1 can be rewrit-ten as:
Lapaλ= D Nλ CCλ
(2)
equation 3:
ρapaλ=
π×CCD Nλ λ ×D
2 Esunλ×cos(zen)
(3)
where: D= Earth-Sun distance in astronomic units (for 08/16/2004,D= 0.97513);
π= 3.1415927;
Esunλ= Solar Exoatmospheric Irradiance in the top of the atmosphere in bandλ(λ=1,2,3,4 and 5);
cos(zen)= cosine of the solar zenith angle at the image
acquisition time.
For the preliminary evaluation of the calibration coefficients obtained, equation 3 was applied to the CCD images from 16 August 2004 to convert its digital num-bers in apparent BRFs. The same procedure was carried out with the CBERS-2 IRMSS data (also from 16 August 2004), whose calibration coefficients were determined by Ponzoni et al. (2006). The IRMSS and CCD converted data were used to create a unique graph.
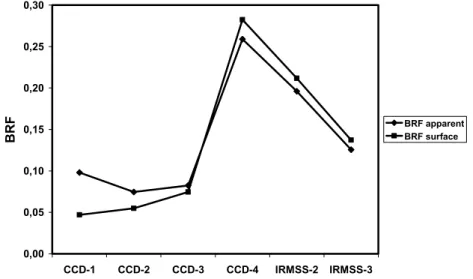
IRMSS and CCD images from São José dos Campos region (south-east of Brazil) acquired were the field data collected on September 20, 2004 were also converted to BRF and a similar graph was created.
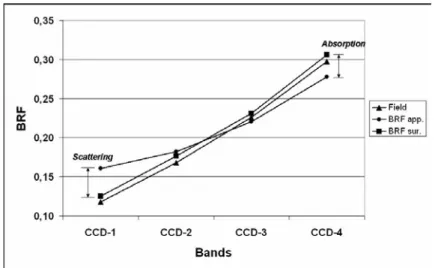
The preliminary evaluation included the visual com-parison of the graph lines for (i) BRF calculated from the field data (BRF field), (ii) the apparent BRF (direct IRMSS data conversion – BRF apparent) and (iii) the surface BRF (BRF surface) determined from the 5S at-mospheric correction code.
RESULTS AND DISCUSSION
REFERENCESURFACE
According to Scott et al. (1996), the BRF values higher than 0.3 in the entire spectral range were preferred. The selected reference surface did not present BRF>0.3 in
the visible region, in spite choosing a brighter surface. Teillet et al. (2001) have presented reflectance spectral curves from the Railroad Valley Playa (spectrally char-acterized in June 1, 1999) and Niobrara, Nebraska (spec-trally characterized in June 2, 1999). The first one pre-sented reflectance higher than 0.3 approximately from 0.50µm to 1.85µm and the second one did not present
reflectance higher than that value in almost all the spec-tral range considered (from 0.30µm to 2.50µm). In spite
of that, data from Niobrara test site have been considered in several vicarious calibration campaigns.
Thome et al. (2004) have compared results from dif-ferent teams that have collected data in these two differ-ent test sites for updating the TM/Landsat-5 and ETM+/ Landsat-7 absolute calibration coefficients. They con-cluded that the differences in the results from the two test sites were about 3% to 5%, depending upon spectral band and experience of the personal involved. The authors did not conclude that a darker reference surface as Niobrara is unqualified for calibration purposes. Based on these experiences it was decided to carry out the CBERS-2 CCD data calibration campaign.
Considering the spatial homogeneity, averaged Co-efficient of Variation of the spectral measurements were 10.9% (CCD_1), 11.4% (CCD_2), 11.4% (CCD_3), 10.2% (CCD_4) and 9.3% (CCD_5), indicating that the surface is not enough radiometrically homogeneous as suggested by Scott et al. (1996) (Coefficient of Varia-tion lower than 5%). For the reference surface isotropy evaluation no tendency was identified in spite of having changes in the illumination geometry during approxi-mately the 2 hours of radiometric measurements in the field.
CALIBRATIONCOEFFICIENTS
The BRFs determined in the field were used with the 5S atmospheric correction code resulting in apparent ra-diances that were utilized in the calibration coefficients determination.
The geometric illumination conditions and the at-mospheric data estimated from the 5S atat-mospheric cor-rection code are presented in Table III.
Table IV summarizes the radiometric data from the reference surface and from the atmosphere in each CCD spectral band, the digital counts at the central point (from the images) and the calibration coefficients determined.
The preliminary evaluation of these calibration co-efficients (CC) included the comparison with coco-efficients determined during pre-launch calibration tasks per-formed in laboratory and described by Zhang et al. (2001). Table V presents the pre-launch and the cali-bration coefficients calculated.
TABLE III
Geometric illumination conditions and the atmospheric data estimated from the 5S atmospheric correction code.
Geometric conditions
Date 16 August 2004
Universal time – H 13.72
Solar zenith angle –θsun 44.45◦ Solar azimuth angle –ϕsun 54.19◦ View zenith angle –θsat 0.00◦ View azimuth angle –ϕsat 0.00◦ Atmospheric code data
Water content – Uw 2.440 g/cm2 Ozone content – UO z 248 Dobson
Aerosol type Continental
laboratory data (no images). Those calculated in 16th August 2004 were based on images that were submitted to the relative calibration.
Another comparison was made between the cali-bration coefficients determined by Chinese researchers that carried out similar calibration campaigns in the Gobi desert (China) almost at the same time the Brazilian cam-paigns were performed. The Chinese results are pre-sented on Table VI.
The calibration coefficients calculated in China were based also on images in which the relative cali-bration was applied, but there are differences between the procedures adopted in Brazil and in China to gen-erate these images. These differences are explained by different criteria in the gain and bias definitions. The percentage values presented on Table VI represent the relative differences between the calibration coefficients determined in Brazil and those determined in China.
In Figure 2 the differences between the BRF curve acquired in the field (BRF field) and the apparent BRF (BRF app) were coherent considering the scattering phe-nomena in the visible region and the absorption in the infrared region. The surface BRF (BRF sur) calculated from the 5S atmospheric correction code presented sim-ilar values to the BRF field, indicating that both the cali-bration coefficients and the atmospheric characterization were satisfactory.
The application of the calibration coefficients in the images allowed the spectral characterization of the selected targets.
CONCLUSIONS
The conversion of the DN to BRF values for CCD level 2 data has helped to spectrally characterize objects consid-ering the spectral range of all CBERS-2 sensors. Calibra-tion coefficients are now also available for the CBERS-2 CCD data users. However, it is suggested that additional validation tests, including correlation analysis of field and image-derived radiometric data, have to be carried out.
Different approaches using vegetation, soil, miner-als geology and chemical quality of water data have miner-also to be considered in future validation tasks.
ACKNOWLEDGMENTS
The authors are grateful to the Fundação de Amparo à Pesquisa do Estado de São Paulo (FAPESP) for the financial support; to the graduate students from Facul-dade de Engenharia Agrícola of the UniversiFacul-dade Esta-dual de Campinas (FEAGRI/UNICAMP), Mr. Júlio Cé-sar Dalla Mora Esquerdo, Mrs. Gláucia Ramirez and Mrs. Liane Weber; to Dr. Marina de Fátima Vilela from the Centro de Pesquisas do Cerrado, Empresa Brasileira de Pesquisa Agropecuária (CPAC/EMBRAPA) and to Dr. Angélica Giarolla, from the Centro de Previsão do Tempo e Estudos Climáticos, Instituto Nacional de Pes-quisas Espaciais (CPTEC/INPE), for important help during field work and for intellectual contributions.
RESUMO
Desde o início da distribuição de imagens dos sensores do satélite CBERS-2 (China-Brazil Earth Resources Satellite) por parte do Instituto Nacional de Pesquisas Espaciais (INPE), a comunidade de usuários solicitava informação sobre a con-versão dos números digitais em valores físicos (radiância ou reflectância). Este artigo descreve os principais passos ado-tados no cálculo dos coeficientes de calibração absoluta para as imagens disponibilizadas no nível 2 de correção (correções radiométrica e geométrica) da câmera CBERS-2 CCD, con-siderando o método baseado na reflectância de uma superfície de referência. São apresentados também alguns resultados da avaliação preliminar da aplicação desses coeficientes na con-versão mencionada.
TABLE IV
Radiometric data from the reference surface and from the atmosphere in each IRMSS spectral band, the digital counts at the central point and the calibration coefficients determined.
CCD spectral bands CCD_1 CCD_2 CCD_3 CCD_4 CCD_Pan
(µm) 0.450 0.520 0.630 0.770 0.510
(µm) 0.520 0.590 0.690 0.890 0.730
Gas total transmittance – tg 0.984 0.935 0.940 0.921 0.927
Top of the atmosphere Irradiance (W/m2/µm) 1934.03 1787.10 1548.97 1069.21 1664.33 Surface Irradiance (W/m2/µm) 1215.29 1145.90 1021.67 702.97 1068.06
Surface Reflectance –ρ 0.118 0.168 0.226 0.298 0.204
Apparent Reflectance –ρapa 0.160 0.175 0.219 0.275 0.201
Apparent Radiance – Lapa(W/m2/sr/µm) 70.34 70.97 77.11 66.77 76.18 Digital number in the central point – NDcp 71 137 89 142 112
Calibration coefficients – CC 1.009 1.930 1.154 2.127 1.483
TABLE V
Comparison of the calibration coefficients calculated from pre-launch and the vicarious calibration campaign.
CCD_1 CCD_2 CCD_3 CCD_4 CCD_Pan
Pre-launch 0.98 1.59 1.20 2.29 1.25
16th August 2004 1.009 1.930 1.154 2.127 1.483
TABLE VI
Calibration coefficients determined by Chinese researchers from the Gobi desert (China).
CCD_1 CCD_2 CCD_3 CCD_4
19th August 2004 0.9917 (1.72%) 1.6761 (13.16%) 1.0096 (12.51%) 2.0613 (3.09%) 25th Augus 2004t 1.0292 (–2.00%) 1.7254 (10.60%) 1.0356 (10.26%) 2.1515 (–1.15%)
Obs.: The calibration coefficients for band 5 were not presented.
0,00 0,05 0,10 0,15 0,20 0,25 0,30
CCD-1 CCD-2 CCD-3 CCD-4 IRMSS-2 IRMSS-3
B
R
F BRF apparent
BRF surface
Fig. 3 – BRF data from a seasonal forest (in São José dos Campos region) extracted from the IRMSS and CCD images (20 September 2004).
REFERENCES
CHANDER G, HELDER DL, MARKHAM B, DEWALD JD, THOMEKJ, MICIJEVICEANDRUGGLESA. 2004. Landsat 5 TM reflective-band absolute radiometric cali-bration. IEEE Trans Geosc Rem Sen 42: 2747–2760. LAMPARELLI RAC, PONZONI FJ, PELLEGRINO GQ,
ZULLOJRJANDARNAUDY. 2003. Spectral characteri-zation of the “Salar de Uyuni” (Bolívia) for orbital optic sensors calibration proposes. IEEE Trans Geos Rem Sen 41: 1461–1468.
PONZONI FJ, ZULLO JRJ, LAMPARELLI RAC, PEL-LEGRINOGQANDARNAUDY. 2004. In-flight absolute calibration of the Landsat 5 TM on the test site Salar de Uyuni. IEEE Trans Geosc Rem Sen 42: 2761–2766. PONZONI FJ, ZULLOJRJANDLAMPARELLIRAC. 2006.
In-flight absolute calibration of the CBERS-2 IRMSS sen-sor data. Int J Rem Sen 27: 799–804.
SCOTTKP, THOMEKJANDBROWNLEEMR. 1996. Eval-uation of the Railroad Valley Playa for use in vicarious calibration. Proc SPIE Conf, 2818 p.
SLATERPN, BIGGARSF, HOLMRG, JACKSONRD, MAO Y, MORANMS, PALMERJMANDYUANB. 1987. Re-flectance- and Radiance-Based Methods for the In-Flight Absolute Calibration of Multispectral Sensors. Rem Sen Environ 22: 11–37.
TANRÉD, DEROOC, DUHAUTP, HERMANMAND MOR-CRETTEJJ. 1990. Description of a computer code to sim-ulate the satellite signal in the solar spectrum: the 5S code. Int J Rem Sen 11: 659–668.
TEILLET PM, BARKER BL, MARKHAM RR, IRISH G, FEDOSEJEVSJCANDSTOREYJC. 2001. Radiometric cross-calibration of the Landsat-7 ETM+ and Landsat-5 TM sensors based on tandem data sets. Rem Sen Environ 78: 39–54.
THOME KJ, MARKHAM B, BARKER J, SLATER P AND BIGGARS. 1997. Radiometric Calibration of Landsat. Photog Eng Rem Sen 63: 853–858.
THOMEKJ, HELDER DL, AARON D AND DEWALD JD. 2004. Landsat-5 TM and Landsat-7 ETM+ absolute ra-diometric calibration using the reflectance-based method. IEEE Trans Geosc Rem Sen 42: 2777–2785.