Revista Brasileira de
Engenharia Agrícola e Ambiental
Campina Grande, PB, UAEA/UFCG – http://www.agriambi.com.br
v.22, n.10, p.696-701, 2018
Calibration of a soil moisture sensor with disturbed
and undisturbed soil samples from Bahia
DOI: http://dx.doi.org/10.1590/1807-1929/agriambi.v22n10p696-701
João G. A. Lima
1, Aureo S. de Oliveira
2, Luciano da S. Souza
2, Neilon D. da Silva
2& Paula C. Viana
2A B S T R A C T
The objective of this study was to evaluate the models proposed by manufacturers and in the literature with respect to soil moisture measurement and to evaluate the performance of the CS616 sensor in the calibration of disturbed and undisturbed soil samples. These calibrations were performed using linear and quadratic models. Disturbed samples were collected in São Gabriel/BA, six samples placed in pots, whereas undisturbed samples were collected in Cruz das Almas/BA, three samples directly collected in the area and placed in a container. A calibration was performed between 21/12/2016 and 08/01/2017. The models proposed in the literature and by manufacturers differed in the estimation of volumetric soil moisture. Disturbed soil samples had higher data dispersion than undisturbed samples, due to factors such as grain size and bulk density, which influence the calibration data. The CS616 sensor had satisfactory performance in the calibration of disturbed and undisturbed samples, with excellent fit of the soil moisture data. Using soil moisture contents obtained by the CS616 sensor, without a previous calibration, may lead to errors in the results, confirming the need for a specific calibration for each type of soil.
Calibração de sensor de umidade com amostras
deformadas e indeformadas de solos da Bahia
R E S U M O
Objetivou-se com este trabalho avaliar os modelos propostos por fabricantes e na literatura quanto à obtenção da umidade do solo, bem como avaliar o desempenho do sensor CS616 quanto à calibração de amostras de solo deformadas e indeformadas, cujas calibrações foram realizadas a partir de modelos do tipo linear e quadrático. As amostras deformadas foram coletadas em São Gabriel, acondicionadas seis amostras em vasos, enquanto as amostras indeformadas foram coletadas em Cruz das Almas, três amostras retiradas diretamente da área, acondicionadas em um recipiente. A calibração foi realizada entre 21/12/2016 e 08/01/2017. Os modelos propostos na literatura e por fabricantes apresentaram diferenças quanto à estimativa da umidade volumétrica do solo. Amostras de solo do tipo deformadas apresentaram maior dispersão nos dados em comparação com amostras indeformadas, devido a fatores como granulometria e densidade do solo que influenciam nos dados da calibração. O sensor CS616 apresentou desempenho satisfatório quanto à calibração de amostras deformadas e indeformadas, com excelente ajuste dos dados de umidade do solo. As utilizações de valores de umidade do solo obtidos a partir do sensor CS616, sem uma calibração prévia, podem acarretar erros nos resultados, confirmando a necessidade de uma calibração específica para cada tipo de solo.
Key words:
soil water content
time domain reflectometry soil physics
Palavras-chave:
umidade do solo
reflectometria no domínio do tempo física do solo
1 Universidade Federal Rural da Amazônia. Tomé-Açu, PA. E-mail: [email protected] (Corresponding author) - ORCID: 0000-0002-2237-3364
2 Universidade Federal do Recôncavo da Bahia/Centro de Ciências Agrárias, Ambientais e Biológicas/Núcleo de Engenharia de Água e Solo. Cruz das Almas,
BA. E-mail: [email protected] - ORCID: 0000-0001-7661-551X; [email protected] - ORCID: 0000-0002-6795-7697 ; [email protected] - ORCID: 0000-0002-5558-8898; [email protected] - ORCID: 0000-0002-9022-6868
Introduction
The knowledge on the water content in a soil profile is essential for any study involving the soil-water-plant-atmosphere system (Santana et al., 2012). According to Gubiani et al. (2015), direct and indirect methods can be used to obtain soil water content. Direct methods consist in the analysis of soil samples collected in the field and have the characteristics of being destructive and time-consuming regarding the results. On the other hand, indirect methods are mostly automated and provide detailed measurements of soil water content through temperature, moderation of neutrons, thermal neutralization, electric resistance, frequency domain reflectometry (FDR) and time domain reflectometry (TDR).
Various authors have applied indirect methods to obtain soil moisture (Francesca et al., 2010; Antonucci et al., 2011; Calamita et al., 2012), and the TDR technique stands out with wide acceptability in comparison to the other methods. TDR allows for continuous and high-frequency readings without operational limitations related to radioactivity such as the moderation of neutrons (Calderón, 2010).
In the TDR technique, soil water content is determined by measuring the soil dielectric constant (ka), assessing the round-trip travel time of electromagnetic waves propagated through a guiding probe (Cai et al., 2017). To use these sensors with accuracy, it becomes necessary to perform a specific calibration for the type of soil to be studied, since the calibration data provided by the manufacturer are generic and directed to soils with different proportions of porosity, contents of mineral and organic materials, types of clay and salinity level.
In this context, this study aimed to evaluate models proposed by manufacturers and found in the literature to determine soil moisture, and to evaluate the performance of a CS616 sensor for calibration, using disturbed and undisturbed soil samples from the Bahia state.
Material and Methods
The study was carried out from 21/12/2016 to 08/01/2017 at the Federal University of Recôncavo da Bahia (UFRB), in the municipality of Cruz das Almas, Bahia, Brazil (12º 44’ 39” S; 39º 06’ 23” W; 225 m a.s.l.). The local climate is Af according to Köppen’s classification (Alvares et al., 2013).
Disturbed samples were collected in the municipality of São Gabriel (11º 13’ 45” S, 41º 54’ 43” W, 649 m), where the BSh climate prevails (Alvares et al., 2013) according to Köppen’s climate classification. The soil was collected in the 0-20 cm layer. Disturbed samples were pounded to break up clods, oven dried, sieved and then placed in six plastic pots with individual volume of 12,000 cm3, perforated at the bottom to allow drainage of the excess water.
Undisturbed soil samples were also collected in the 0-20 cm layer in a soil profile located at the UFRB campus of Cruz das Almas. The area is cultivated with Brachiaria decumbens and, from the soil pit wall, three samples were collected using a mold box made of galvanized steel plate with size of 40 x 20 x 12 cm, i.e., a final volume of 9,600 cm3. The mold boxes were previously perforated on all sides to allow the excess water to
be drained without significant soil loss, during the saturation of the samples in the calibration of the moisture sensor. Undisturbed samples were monoliths carefully collected in the above-mentioned layer with proper tools. The molds were individually weighed before soil sampling.
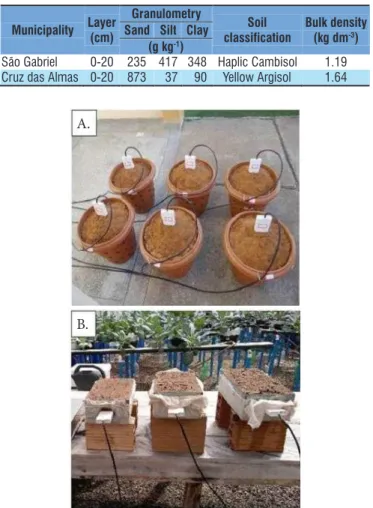
The physical characteristics of the soils from both sites are presented in Table 1. The analyses were carried out at the Laboratory of Soil Physics of Embrapa Cassava & Tropical Fruits, Cruz das Almas-BA, following methodologies described in Donagema et al. (2011).
The calibration of the moisture sensor with the disturbed samples (Figure 1A) was carried out in a semi-open environment to guarantee natural drying of the soil and began after the samples were saturated for 24 h. After saturation, the CS616 sensors (Campbell Scientific Inc., Utah, USA-CSI) were inserted into the pots. Data acquisition consisted in weighing the buckets with soil on precision scale and reading the round-trip travel time of the electromagnetic wave, using a CR1000 data logger (Campbell Scientific. Inc., Logan, Utah, USA-CSI). Data acquisition frequency decreased with the progress of the natural drying of the soil in the buckets and continued until the measurements became virtually constant.
The calibration of the CS616 sensor with the undisturbed samples (Figure 1B) was conducted in protected environment
Figure 1. CS616 sensor calibration with disturbed samples from São Gabriel (A) and undisturbed samples from Cruz das Almas (B)
Municipality Layer (cm)
Granulometry
Soil classification
Bulk density (kg dm-3)
Sand Silt Clay (g kg-1)
São Gabriel 0-20 235 417 348 Haplic Cambisol 1.19 Cruz das Almas 0-20 873 37 90 Yellow Argisol 1.64 Table 1. Physical characteristics of the soils collected in the municipalities of São Gabriel and Cruz das Almas, both in Bahia
A.
(greenhouse). After 24-h saturation, the metal rods of each sensor were introduced in the soil blocks at the medium depth (10 cm) and parallel to the bottom of the metal box. This method of insertion prevented the rods from touching the walls. Data acquisition followed a similar procedure to that adopted with disturbed samples.
In both cases (disturbed and undisturbed samples), volumetric moisture was obtained by Eq. 1:
where:
Pi and Oi - predicted and observed values; P and O - average values;
SSResidual - sum of squared errors; and, n - number of observations.
Forty six and thirty two measurements were taken in the soils from São Gabriel and Cruz das Almas, respectively, using six and three replicates in each one of these situations. The data shown represent the means of the replicates.
Results and Discussion
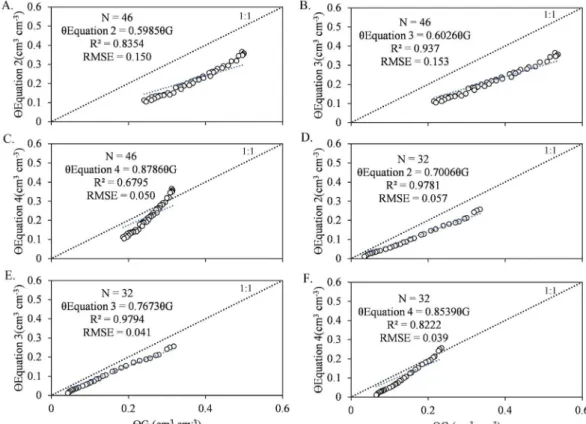
Figure 2 shows volumetric moisture data (cm3 cm-3) obtained by gravimetry (θG) in comparison to those estimated by Eqs. 2, 3 and 4 for disturbed (A, B and C) and undisturbed (D, E and F) soil samples.
In the comparative analysis between the R2 values, based on the 1:1 line between the data measured and estimated by the models, for each type of disturbed sample (Figures 2A, B and C), a good fit was obtained when Eq. 2 and 3 were used, with R2 values of 0.8354 and 0.9370, respectively. However, for Eq. 4 the value was lower (0.6795). Regarding the R2 in undisturbed soil samples (Figures 2D, E and F), a good fit was observed for all equations, with values of the order of 0.9794 (Eq. 3), 0.9781 (Eq. 2) and 0.8222 (Eq. 4).
Regarding the RMSE for disturbed soil samples, the best performance was obtained with Eq. 4 (0.050 cm3.cm-3). With Eqs. 2 and 3, RMSE was equal to 0.150 and 0.153 cm3 cm-3, respectively. The same trend was found in the undisturbed soil samples, and the best result was obtained using Eq. 4 (0.039 cm3 cm-3); for Eq. 2 and 3, RMSE was equal to 0.057 and 0.041 cm3 cm-3, respectively, agreeing with Rudiger et al. (2010), who obtained RMSE values from 0.058 to 0.049 cm3 cm-3.
For comparison purposes, RMSE values in both types of samples were different; they were better in the undisturbed type of sample than in the disturbed type of sample. Possibly, the less satisfactory results of RMSE in disturbed soil samples obtained with Eq. 2 and 3 occurred because the equations suggested by the CSI have been developed for soils with clay content below 300 g kg-1.
According to Figure 2, among the models it can be noted that Eq. 4 had the best results, underestimating by approximately 14 and 17% the volumetric moisture contents (cm3 cm-3) obtained by gravimetry (θG) for disturbed and undisturbed soil samples, θv M M V = − 1 2 where:
θv - volumetric soil moisture, cm3 cm-3; M1 - mass of wet soil, g, at each measurement;
M2 - mass of dry soil obtained at the end of the experiment after drying the soil in the oven at 105 oC; and,
V - soil volume, cm3.
In the specific case of the soil in the buckets, where at first the soil volume was unknown, a sample with known volume was collected from the center of the soil mass to determine bulk density (kg dm-3). Soil moisture based on volume was then obtained as a product between soil moisture based on weight and bulk density.
The data obtained through gravimetry were compared with Eqs. 2 (linear model), 3 (quadratic model), suggested by the CSI, and 4, in this case a model developed by Vaz et al. (2013), for disturbed and undisturbed samples:
θ= −0 4677. +0 0283. µsec
θ=00007µ 2−0 0063µ −0 0663
. sec . sec .
θ=01527µ 0 5−0 5783 . sec. .
where:
μsec - period in microseconds.
Then, linear (Eq. 5) and polynomial quadratic (Eq. 6) models were fitted to the gravimetric data in both types of sample.
θv =aµsec+b
θv =aµsec +bµsec+c
2
where:
a, b and c - fitting coefficients.
Calibration equations were evaluated based on the coefficient of determination (R2; Eq. 7) and test of significance of the coefficients of the models fitted. Simple linear regression was used to compare measured volumetric moisture with volumetric moisture estimated by the models fitted, assessing the efficiency of the calibration model through the standard error of the estimate (SEE, Eq. 8) and root-mean-square errors (RMSE; Eq. 9). R2, SEE and RMSE are defined as follows:
R
P P O O
P P O O
Figure 2. Statistical results for the disturbed soil samples from São Gabriel (Eq. 2 - A; Eq. 3 - B and Eq. 4 - C) and undisturbed soil samples from Cruz das Almas (Eq. 2 - D; Eq. 3 - E; Eq. 4 - F)
respectively, with RMSE values of 0.050 cm3 cm-3 (disturbed samples) and 0.039 cm3 cm-3 (undisturbed samples), but with less satisfactory results for R2, 0.6795 and 0.8222, for disturbed and undisturbed soil samples, respectively. Among the models developed by the CSI, Eq. 3 had the best fit.
Volumetric moisture contents (cm3 cm-3) were underesti-mated by the models developed by the CSI, manufacturer of the CS616 sensor, as shown in Figures 2A, B, D and E. However, when estimated by the model proposed by Vaz et al. (2013) there was an overestimation of the moisture contents close to saturation (Figures 2C and F). These results corroborate those obtained by Francesca et al. (2010) in the calibration of a soil from the 0-0.20 m layer. Opposite results were found by Stangl et al. (2009), Udawatta et al. (2011) and Sharma et al. (2017), who reported an overestimation of up to 67% in the moisture contents using the models suggested by the CSI (Eq. 2 and 3).
The results obtained here suggest the need for a specific calibration for the type of soil to be studied, since the models suggested in the literature and by manufacturers are not limited to a single type of soil. This ratifies the idea that wrong estimates of soil moisture content may have negative impacts on studies on drainage, irrigation management, hydrography and soil water dynamics.
The calibration of disturbed and undisturbed soil samples using a linear model (A) and a quadratic model (B) is found in Figure 3. Differences were found between the applied models. When the linear model (Figure 3A) was used in the calibration of both types of samples, a satisfactory fit was obtained, with coefficient of determination (R2) of the order of 0.9816 and 0.9947 for disturbed and undisturbed samples, respectively. In the linear model, the coefficients were significant at a confidence level above 99%. For the quadratic model (Figure 3B), higher accuracy was found compared with the linear
Figure 3. Calibration of disturbed soil samples (São Gabriel) and undisturbed soil samples (Cruz das Almas) using a linear model (A) and a quadratic model (B)
disturbed samples, with values of about 1%. This corroborates with a previous study (Stangl et al., 2009), which demonstrates that the differences between linear and quadratic models were small or did not improve the estimate of moisture content.
Regardless of the model used, the results found in the present study agree with those obtained by Vaz et al. (2013), who observed R2 values from 0.95 (soil with high salt content) to 0.98 (organic soil) in the calibration of CS616 sensors under laboratory conditions using undisturbed samples. Under the same conditions of the previously cited study, Udawatta et al. (2010) obtained R2 between 0.91 and 0.96. Francesca et al. (2010), calibrating CS616 sensors under field conditions, obtained lower R2 values, of the order of 0.90. Therefore, this suggests that the calibration carried out in the present study for both types of samples was consistent with the data found in the literature.
According to the individual behavior of each sample, disturbed samples (SEE = 0.0097 cm3 cm-3; linear model and 0.0073 cm3 cm-3; quadratic model) had higher data dispersion in relation to the associated curve (Figure 3), compared with the undisturbed samples (SEE = 0.0052 cm3 cm-3; linear model and 0.0041 cm3 cm-3; quadratic model). This is justified because the change in soil structure has direct influence on the values of bulk density, leading to higher variability in moisture contents. Silva et al. (2008) claimed that greater dispersion in moisture data is directly related to higher variability in bulk density. Manieri et al. (2007), calibrating a spiral TDR probe in disturbed soil samples, observed greater data dispersion in comparison to the data obtained in the present study for SEE, between 0.0600 and 0.0630 cm3 cm-3.
For a same value of travel time (µsec), higher volumetric moisture content was found in undisturbed samples than in disturbed samples (Figure 3), which is due to two factors: grain size and bulk density. Regarding grain size, the results corroborate those reported by Udawatta et al. (2011), who compared three types of soil in Novelty, MO, EUA, and observed that soils with greater proportions of sand had higher volumetric moisture contents at a same value of µsec. Almeida et al. (2012), studying the influence of bulk density on the estimate of volumetric moisture in a Red Yellow Latosol obtained with the CS616 sensor, observed a similar behavior, in which the sample with lower bulk density had lower θ value at a same value of µsec, in comparison to a sample with higher bulk density.
Volumetric moisture contents (cm3 cm-3) obtained by gravimetry (θG) during the calibration for disturbed samples did not reach a level close to the residual moisture (Figure 3). This probably occurred because of the higher clay content in the disturbed samples and because they were placed in plastic pots with smaller contact surface, reducing the loss of water through evaporation.
Conclusions
1. Using models proposed in the literature and by the CS616 sensor manufacturer, without previous calibration, may lead to errors in the results, confirming the need for a specific calibration for each type of soil.
2. The sensor CS616 had satisfactory performance in the calibration of disturbed and undisturbed samples, with excellent fit of the soil moisture data and travel time in the linear and quadratic models.
Literature Cited
Almeida, C. A. B. de; Antonino, A. C. D.; Pimentel, R. M. de M.; Lira, C. A. B. de O.; Lima, J. R. de S. Influência da densidade na estimativa da umidade volumétrica em um latossolo vermelho-amarelo. Revista Brasileira de Geografia Física, v.5, p.1056-1068, 2012. https://doi.org/10.26848/rbgf.v5i5.232894
Alvares, C. A.; Stape, J. L.; Sentelhas, P. C.; Gonçalves, J. L. M.; Sparovek, G. Koppen’s climate classification map for Brazil. Meteorologische Zeitschrift, v.22, p.711-728, 2013. https://doi. org/10.1127/0941-2948/2013/0507
Antonucci, F.; Pallottino, F.; Costa, C.; Rimatori, V.; Giorgi, S.; Papetti, P.; Menesatti, P. Development of a rapid soil water content detection technique using active infrared thermal methods for in-field applications. Sensors, v.11, p.10114-10128, 2011. https:// doi.org/10.3390/s111110114
Cai, L.; Gao, D.; Hong, N. Measurement of moisture content using time domain reflectometry during the biodrying of sewage sludge with high electrical conductivity. Drying Technology, v.35, p.108-115, 2017. https://doi.org/10.1080/07373937.2016.1162169
Calamita, G.; Brocca, L.; Perrone, A.; Piscitelli, S.; Lapenna, V.; Melone, F.; Moramarco, T. Electrical resistivity and TDR methods for soil moisture estimation in central Italy test-sites. Journal of Hydrology, v.454, p.101-112, 2012. https://doi.org/10.1016/j. jhydrol.2012.06.001
Calderón, V. J. V. Interpretação dos resultados de ensaios TDR para a determinação do teor de umidade dos solos. São Carlos: USP, 2010. 117p. Dissertação Mestrado
Donagema, G. K.; Campos, D. V. B. de; Calderano, S. B.; Teixeira, W. G.; Viana, J. H. M. (org.). Manual de métodos de análise do solo. 2.ed. rev. Rio de Janeiro: Embrapa Solos, 2011. 230p. Documentos, 132
Francesca, V.; Osvaldo, F.; Stefano, P.; Paola, R. P. Soil moisture measurements comparison of instrumentation performances. Journal of Irrigation and Drainage Engineering, v.136, p.81-89, 2010. https://doi.org/10.1061/(ASCE)0733-9437(2010)136:2(81) Gubiani, P. I.; Reinert, D. J.; Reichert, J. M.; Gelain, R. N. Condição
de contorno para calibração de reflectómetro usado para medição de água no solo. Ciência Rural, v.45, p.1412-1417, 2015. https:// doi.org/10.1590/0103-8478cr20140907
Manieri, J. M.; Vaz, C. M. P.; Maria, I. C. de. Sonda espiral de TDR para a medida da umidade no perfil do solo. Revista Brasileira de Ciência do Solo, v.31, p.191-198, 2007. https://doi.org/10.1590/ S0100-06832007000200001
Rudiger, C.; Western, A. W.; Walker, J. P.; Smith, A. B.; Kalma, J. D.; Willgoose, G. Towards a general equation for frequency domain reflectometers. Journal of Hydrology, v.383, p.319-329, 2010. https://doi.org/10.1016/j.jhydrol.2009.12.046
Santana, J. A. V.; Coelho, E. F.; Silva Junior, J. J.; Santana Junior, E. B.; Veinromber Junior, L. A. A. Desempenho de sondas de TDR manufaturadas de diferentes comprimentos de hastes. Revista Brasileira de Ciência do Solo, v.36, p.1123-1129, 2012. https:// doi.org/10.1590/S0100-06832012000400007
Silva, C. R. da; Andrade Júnior, A. S. de; Souza, C. F. Aspectos práticos na utilização da técnica de capacitância: Desafios e aprendizagem. In: Souza, C. F. (ed.) Aplicações de técnicas eletromagnéticas para o monitoramento ambiental. Taubaté: UNITAU, 2008. Cap.1, p.25-45. Stangl, R.; Buchan, G. D.; Loiskandl, W. Field use and calibration of
a TDR-based probe for monitoring water content in a high-clay landslide soil in Austria. Geoderma, v.150, p.23-31, 2009. https:// doi.org/10.1016/j.geoderma.2009.01.002
Udawatta, R. P.; Anderson, S. H.; Motavalli, P. P.; Garrett, H. E. Calibration of a water content reflectometer and soil water dynamics for an agroforestry practice. Agroforestry Systems, v.82, p.61-75, 2011. https://doi.org/10.1007/s10457-010-9362-3 Vaz, C. M. P.; Jones, S.; Meding, M.; Tuller, M. Evaluation of standard