Vol.58, n.1: pp. 1-11, January-February 2015 http://dx.doi.org/10.1590/S1516-8913201502621
ISSN 1516-8913 Printed in Brazil
BRAZILIAN ARCHIVES OF BIOLOGY AND TECHNOLOGY A N I N T E R N A T I O N A L J O U R N A L
Purification of C-phycocyanin from Spirulina platensis in
Aqueous Two-Phase Systems using an Experimental Design
Francine Silva Antelo
1, Jorge Alberto Vieira Costa
2and Susana Juliano Kalil
3*1Laboratório de Cinética e Termodinâmica dos Processos Degradativos; Escola de Química e Alimentos;
Universidade Federal do Rio Grande - Campus Santo Antônio da Patrulha; Santo Antônio da Patrulha - RS - Brasil. 2Laboratório de Engenharia Bioquímica; Escola de Química e Alimentos; Universidade Federal do Rio Grande; Rio Grande - RS - Brasil. 3Laboratório de Microbiologia; Escola de Química e Alimentos; Universidade Federal do Rio Grande - Campus Carreiros; Rio Grande - RS - Brasil
ABSTRACT
C-phycocyanin from Spirulina platensis was purified in aqueous two-phase systems (ATPS) of polyethylene glycol (PEG)/potassium phosphate, varying the molar mass of the PEG. Results using a full factorial design showed that an increase in the concentration of salt and decrease in the concentration of PEG caused an increment in the purification factor for all the ATPS studied. Optimization of the conditions of the purification was studied using a central composite rotatable design for each molar mass of PEG. The ATPS composed of 7% (w/w) PEG 1500 or 4% (w/w) PEG 8000 (g/gmol) and 23 or 22.5% (w/w) of phosphate resulted a purification factor of 1.6-fold for C-phycocyanin, with total and 57% recovery, respectively. Process conditions were optimized for the purification factor for the system with PEG 1500. The ATPS with 4% (w/w) PEG 4000 or 4% (w/w) PEG 6000 and 21% (w/w) phosphate resulted purification factors of 2.1 and 2.2-fold, recovering 100% and 73.5%, respectively of C-phycocyanin in the top phase.
Key words: C-phycocyanin, Purification Factor, Protein, Polyethylene glycol
*Author for correspondence: [email protected]
INTRODUCTION
C-phycocyanin is an accessory photosynthetic pigment of the phycobiliprotein family, which also
includes the alophycocyanins (blue) and
phycoerythrins (red) (Vonshak 1997; Chaiklahan et al. 2011). It is the biggest component of the phycobiliprotein family, representing about 20% on dry weight of the cell protein and is used as a natural dye in food and cosmetics (Cohen 1986; Yoshida et al. 1996). It shows therapeutic
properties such as anti-inflammatory and
hepatoprotective effects, as well as anti-oxidant capacity (Romay et al. 1998). Several methods have been used for the purification of C-phycocyanin, especially that from Spirulina, such
as ammonium sulfate precipitation, membrane processes and different chromatographic methods (Minkova et al. 2003; Silveira et al. 2007; Chaiklahan et al. 2011; Bermejo and Ramos 2012). C-phycocyanin with a purity of 0.7 is considered as food grade, 3.9 as reactive grade and above 3.9 as analytical grade (Herrera et al. 1989; Rito-Palomares et al. 2001).
The purification processes are generally long and complex and time and solvent consuming; efficiency and low toxicity have limited the application of some methods (Wu et al. 2014). In the past, traditional protein purification methods have been used, including ion exchange gel filtration chromatography, affinity chromatography,
precipitation, salting out and electrophoresis, but they are expensive and not suitable for mass production. Furthermore, due to the poor stability, proteins in the conditions of acids, alkali or heating are easily denatured (Gutowski et al. 2003; Freire et al. 2012; Shahriari et al. 2013; Zeng and Wang 2013). Hence, the aqueous two-phase system (ATPS), a simple and economic system, has been studied. This system is a better alternative for many biomolecules in bioseparation processes, especially in the early downstream stages, and consists of the mixture of two polymers or of one polymer with a salt in a determined concentration, which assures the formation of two phases at equilibrium (Albertson 1986; Marcos et al. 1999). The high water content of an aqueous two-phase system (ATPS) provides a neutral and non-toxic environment favorable to biological activities. The short processing time, desirable separation efficiency, low pollution load, low cost and possibility of recycling and reuse of its components make the ATPS a very competitive technique compared to other methods (Wu et al. 2014).
The partition of an enzyme or protein in this kind of system is influenced by several factors such as the molecular mass of the polymer, salt or polymer concentration, system pH and temperature, size and the hydrophilic or hydrophobic nature of the bio-molecule (Sebastiao et al. 1996; Silva et al. 2002; Saravanan et al. 2008). Due to their complexity, ATPS purification studies are mostly empirical, and thus, the best conditions are generally obtained by the systematic variation of factors such as the molecular mass of the polymer, salt concentration and pH. The use of an experimental design can propose the variations to use.
The use of the experimental design technique seeks to reduce the number of tests without harming the quality of the information and allows for the simultaneous study of several
variables. The technique provides the
determination of the reliability of the results,
research steps in an iterative process of
adding new tests, and selection of the
variables that influence the process with just a few trials but still drawing conclusions from quality results. The factorial design is a useful analytical strategy and its main application is in the screening of relevant variables in a given system. After the screening process of the most significant variables, experiments are carried out
that allow for refinement and a better
understanding of the system under the study (Montgomery 1991; Barros Neto et al. 1995). The present work aimed to study and optimize the purification of the C-phycocyanin extracted from Spirulina platensis using aqueous two-phase
systems of polyethylene glycol/potassium
phosphate, aiming for purity above 0.7. The influence of molecular mass was evaluated using PEG 1500, 4000, 6000 and 8000 (g/gmol), and also of the percentages of salt and polymer with respect to the purification factor and protein recovery in each system, using an experimental design and response surface methodology.
MATERIALS AND METHODS
Culture conditions of Spirulina platensis
The cyanobacterium S. platensis LEB 52 culture was grown in outdoor 450 L capacity photo-bioreactors using Zarrouk’s synthetic medium (Zarrouk, 1966), diluted to 20%, with an initial biomass concentration of 0.30 (g/dm3) (Costa et al. 2000). Samples were taken every 24 h to determine the biomass concentration via optical
density measurements at 670 nm in a
spectrophotometer (FEMTO spectrophotometer 700 Plus) according to Costa et al. (2002). At the end of cultivation, the biomass was recovered by filtration, pressing and extrusion, and then dried at 50°C for 6 h, frozen at -18°C, ground in a ball mill and sieved (the perforations on the sieve being 150 mesh).
C-phycocyanin extraction
C-phycocyanin was extracted using the conditions established by Silveira et al. (2007). After extraction, the suspension was centrifuged and vacuum filtered and the supernatant collected.
Polyethylene glycol (PEG) molar mass
Four molar masses of polyethylene glycol: 1500, 4000, 6000 (Labsynth LTDA, Diadema, SP, Brazil) and 8000 (g/gmol) (Sigma Chemicals, St Louis, MO, USA) were used in the PEG/potassium phosphate systems for the purification of C-phycocyanin.
Preparation of the aqueous two-phase systems
potassium phosphate. The phosphate stock solution consisted of a mixture of appropriate amounts of KH2PO4 and K2HPO4 (Labsynth) in
order to obtain pH 6.0. The quantities of bottom and top phases were calculated from the phase composition obtained using the corresponding phase diagram. A 4 g mass of a clarified crude extract of C-phycocyanin was added to the system and made up to 20 g by the addition of water. The systems were vortex-mixed (Phoenix AP 56) and
centrifuged (Presvac DCS 16 RV) at 3400 rpmfor
20 min to speed up the phase separation.
After reaching equilibrium, the top and bottom phases were separated and their volumes measured. The absorption of part of each phase was read in a spectrophotometer (Cary 100 Conc UV Visible Spectrophotometer and Quimis Q 108 D) at 280, 615, 620 and 652 nm. The reference systems for each trial were prepared without the addition of the crude C-phycocyanin extract, and after separation the absorption of the phases were read at 280 nm.
Experimental designs
The effects of the percentages of polyethylene glycol and potassium phosphate on the purification factor and C-phycocyanin recovery were evaluated using four full 22 factorial designs with three repetitions at the central point, one full factorial design for each PEG molar mass: 1500, 4000, 6000 and 8000 (g/gmol).
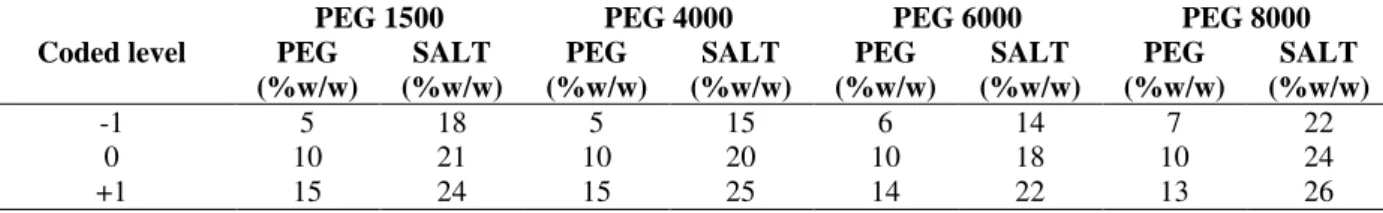
The study range for the optimization or maximization of the conditions of the purification process of C-phycocyanin using ATPS was established from the effects of the percentages of the different PEG molecular masses: 1500, 4000, 6000 and 8000 (g/gmol) and of the potassium phosphate on the purification factor and protein recovery. Four 22 central composite rotatable designs (CCRD) with four axial points and three repetitions at the central point were used. Tables 1 and 2 present the coded levels used in the four full factorial designs and in the four CCRD for each of the ATPS studied. The analyses were carried out in triplicate and the same C-phycocyanin crude extract was used in all the experiments.
Table 1 - Values for the coded levels used in the four full factorial designs.
Coded level
PEG 1500 PEG 4000 PEG 6000 PEG 8000
PEG (%w/w)
SALT (%w/w)
PEG (%w/w)
SALT (%w/w)
PEG (%w/w)
SALT (%w/w)
PEG (%w/w)
SALT (%w/w)
-1 5 18 5 15 6 14 7 22
0 10 21 10 20 10 18 10 24
+1 15 24 15 25 14 22 13 26
Table 2 - Values for the coded levels used in the four CCRD.
Coded level
PEG 1500 PEG 4000 PEG 6000 PEG 8000
PEG (%w/w)
SALT (%w/w)
PEG (%w/w)
SALT (%w/w)
PEG (%w/w)
SALT (%w/w)
PEG (%w/w)
SALT (%w/w)
-1.41 2.8 20.2 2.4 20.2 2.8 18.6 2.8 21.9
-1 4 21 4 21 4 19 4 22.5
0 7 23 8 23 7 20 7 24
+1 10 25 12 25 10 21 10 25.5
+1.41 11.2 25.8 13.6 25.8 11.2 21.4 11.2 26.1
Analytical procedures
phycocyanin concentration (PC): The C-phycocyanin concentration was defined as shown in Equation 1, according to Bennett and Bogorad (1973):
34 . 5
] 474
. 0
[OD615 OD652
PC = − × (1)
Where: PC is the C-phycocyanin concentration (mg/cm3), OD615 is the optical density of the
sample at 615 nm and OD652 is the optical density
of the sample at 652 nm.
C-phycocyanin purity (EP): The C-phycocyanin purity was calculated spectrophotometrically using Equation 2 (Abalde et al. 1998).
280 620
OD
OD
Where: OD620 is the optical density of the sample
at 620 nm and OD280 is the optical density of the
sample at 280 nm. This relationship is indicative of the purity of the C-phycocyanin extract with respect to most forms of contaminating proteins. The absorbance at 620 nm indicates the maximum absorption of C-phycocyanin, while that at 280 nm is due to the total concentration of proteins in the solution.
Purification factor (PF): The purification factor was calculated using Equation 3.
c p
EP
EP
PF
=
(3)Where EPp is the purity of the extract after the
purification process and EPc is the purity of the
crude extract.
Recovery (RC): The recovery (%) of the extraction was calculated using Equation 4.
100 * ] [
] [
_ext in crude
phase phase
V PC
V PC
RC
× ×
= (4)
Where PCphase is the concentration of
C-phycocyanin in the phase considered (mg/cm3), PCcrude_ext is the concentration of C-phycocyanin in
the crude extract (mg/cm3), Vphase is the volume of
the phase considered (cm3) and Vin is the initial
volume of extract added (cm3).
C-phycocyanin partition coefficient (Kpart): The
partition coefficient for C-phycocyanin was calculated using Equation 5 (Albertson 1986).
bot top part
PC
PC
K
=
(5)Where: PCtop and PCbot are, respectively, the
C-phycocyanin concentrations in the top and bottom phases (mg/cm3).
Volume ratio (Vr): The volume ratio was given by the ratio between the volumes in the top and bottom phases (Bermejo et al. 2002):
bot top
V
V
Vr
=
(6)Where Vtop is the volume of C-phycocyanin in the
top phase (cm3) and Vbot the volume of
C-phycocyanin in the bottom phase (cm3), after the purification process.
Statistical Analysis
The statistical analyses of the estimated effects of
each variable and the optimization or
maximization of the conditions of the purification process were carried out considering a 95% level of confidence (p<0.05). The responses surfaces and contour diagrams were drawn according to Box et al. (1978).
RESULTS AND DISCUSSION
Full factorial design (22 trial plus + three central points)
Table 3 shows the design matrix for the systems with PEG 1500, 4000, 6000 and 8000 and potassium phosphate, with the coded values and the responses for the purification factor and protein recovery. Table 4 shows the volume ratios (Vr) and partition coefficients (Kpart) for the same
seven trials. The tie line length (TLL) concept is frequently used in ATPS processes. TLL represents the straight lines connecting the points in the diagram that represent the composition of the two phases in equilibrium (Silva and Loh 2006). However, the use of an experimental design provides other compositions that do not use the TLL concept, expanding the area of two-phase compositions to be explored.
The PEG 1500/potassium phosphate system, composed of 5% (w/w) of polymer and 24% (w/w) of salt gave a purification factor of 1.6-fold with 78% of protein recovery, representing a level of purity above 0.7 as desired. Benavides and Rito-Palomares (2004) obtained a similar result in the
purification of the phycoerythrin from
Porphyridium cruentum using an ATPS composed
of PEG 1450/potassium phosphate with 17.6% (w/w) of polymer and 10.9% (w/w) of salt. This result was obtained for the lowest Vr amongst the systems, of 0.4, indicating the tendency for better target-protein purification with a low volume of the top phase, rich in PEG.
with the lowest Vr values, around 0.6. It should be pointed out that for the ATPS composed of PEG with molar masses of 1500, 4000 and 8000, there was a correlation between the value for Kpart and
the percentage of salt in the systems. For the
designs studied, the lowest values for Kpart
appeared in the trials with the lowest salt level, i.e., with the lowest amount of potassium phosphate in the system, where the C-phycocyanin tended to migrate to the bottom phase.
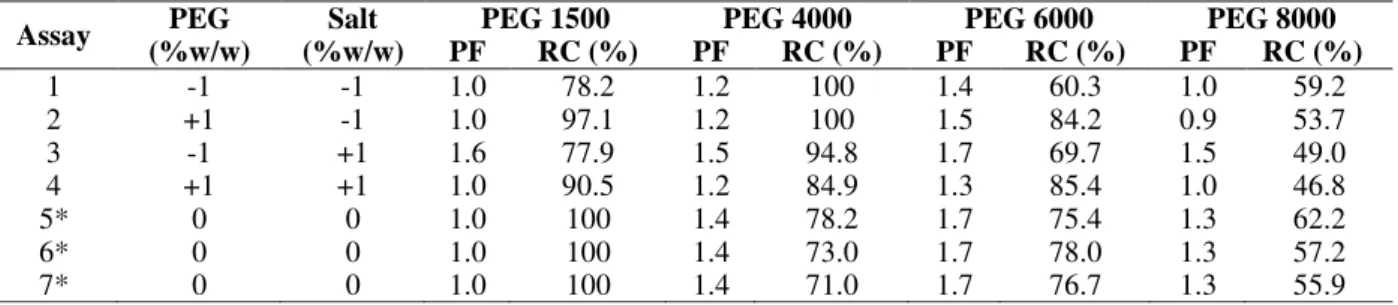
Table 3 - Matrix of the full factorial design (22 trial + 3 central points) for the coded values of the systems with polyethylene glycol 1500, 4000, 6000 and 8000 plus potassium phosphate, with the results obtained for purification factor (PF) and recovery (RC) of C-phycocyanin, in the top phase of the trials.
Assay PEG
(%w/w)
Salt (%w/w)
PEG 1500 PEG 4000 PEG 6000 PEG 8000
PF RC (%) PF RC (%) PF RC (%) PF RC (%)
1 -1 -1 1.0 78.2 1.2 100 1.4 60.3 1.0 59.2
2 +1 -1 1.0 97.1 1.2 100 1.5 84.2 0.9 53.7
3 -1 +1 1.6 77.9 1.5 94.8 1.7 69.7 1.5 49.0
4 +1 +1 1.0 90.5 1.2 84.9 1.3 85.4 1.0 46.8
5* 0 0 1.0 100 1.4 78.2 1.7 75.4 1.3 62.2
6* 0 0 1.0 100 1.4 73.0 1.7 78.0 1.3 57.2
7* 0 0 1.0 100 1.4 71.0 1.7 76.7 1.3 55.9
* central point.
Table 4 - Matrix of the CCDR (22 trial + 4 axial points + 3 central points) for the coded values of the systems with polyethylene glycol 1500, 4000, 6000 and 8000 plus potassium phosphate, with the results obtained for volume ratio (Vr) and partition coefficient (Kpart).
Assay PEG
(%w/w)
Salt (%w/w)
PEG 1500 PEG 4000 PEG 6000 PEG 8000
Vr Kpart Vr Kpart Vr Kpart Vr Kpart
1 -1 -1 1.4 3.03 1.4 47.6 0.6 > 100 0.8 24.6
2 +1 -1 1.6 > 100 1.5 ∝ 1.4 ∝ 0.9 ∝
3 -1 +1 0.4 > 100 0.6 98.5 0.5 ∝ 0.5 18.5
4 +1 +1 1.1 > 100 1.2 > 100 0.7 ∝ 0.6 ∝
5* 0 0 1.0 ∝ 0.7 > 100 0.5 ∝ 0.7 > 100
6* 0 0 1.1 ∝ 0.6 > 100 0.6 ∝ 0.7 47.7
7* 0 0 1.0 ∝ 0.6 > 100 0.6 ∝ 0.7 > 100
*: central point; >100: value over 100; ∝: value tending to infinity.
In the analysis of the effects (see Table 5), it was observed that with 95% confidence, the change in salt percentage from level -1 to level +1 had a positive effect on the C-phycocyanin purification factor in the four systems studied; i.e., an increase in the percentage of potassium phosphate caused an increase in the protein purification factor. The change in polymer percentage from level -1 to level +1 had a negative effect on the C-phycocyanin purification factor for all the ATPS, an increase in the percentage of PEG causing a decrease in this response.
A decrease in the volume of the top phase, for which the C-phycocyanin showed affinity, resulted in an increase in its concentration, and the possible exclusion of part of its contaminants to the bottom phase, causing a possible increase in the purity and in the protein purification factor. Thus, an increase in the concentration of salt in the ATPS and
decrease in the concentration of PEG could be equally related to a gain in purity of the C-phycocyanin and of its purification factor.
AccordingtoNagaraja and Iyyaswami (2013), the
Table 5 - Main effects of the variables of polymer percentage and salt percentage and the interaction between them, on the purification factors and recoveries of C-phycocyanin in the ATPSs containing polyethylene glycol 1500, 4000, 6000 and 8000/potassium phosphate.
1500 4000 6000 8000
Purification factor
PEG -0.6* -0.2* -0.2* -0.3* SALT 0.6* 0.2* 0.1* 0.2* PEGxSALT -0.6* -0.2* -0.3* -0.2*
Recovery
PEG 4.7 -5.0 19.8* -3.9 SALT 7.6 -10.1 5.3* -8.5 PEGxSALT -14.2 -5.0 -4.1* 1.6 *p<0.05 (significant at a 95% confidence level).
For the recovery of C-phycocyanin in the system containing PEG 6000, where the effects of the percentages of PEG and salt and of their interaction were statistically significant at 95% confidence, an increase in the percentage of PEG from level -1 to level +1 resulted a positive effect, contrary to that detected for the purification factor. This showed that the higher the purity of the
desired target-protein, the lower the recovery, because there was a greater tendency to lose the protein together with the contaminants as the purification process intensified. The increases in the concentration of PEG and potassium phosphate from level -1 to level +1 still had a positive effect on the recovery of C-phycocyanin for the ATPS composed of PEG of with a molar mass of 6000.
Optimization using a CCRD (22 trial + four axial points + three central points)
The optimization step is very important to obtain the best results for purity. Since C-phycocyanin is a product with a high aggregated value, optimization minimizes significant losses during recovery. Table 6 presents the CCRD matrix for the 1500, 4000, 6000 and 8000 PEG plus potassium phosphate systems, with the coded values and experimental responses for the
purification factor and for C-phycocyanin
recovery. The volume ratios and partition coefficients are shown in Table 7.
Table 6 - Matrix of the CCRD for the coded values of the systems of polyethylene glycol 1500, 4000, 6000 and 8000/potassium phosphate, with the results obtained for the C-phycocyanin purification factor (PF) and recovery (RC) in the top phase of the trials.
Assay (%w/w)PEG (%w/w)Salt PEG 1500 PEG 4000 PEG 6000 PEG 8000 PF RC (%) PF RC (%) PF RC (%) PF RC (%)
1 -1 -1 1.3 95.2 2.1 100 1.2 82.8 1.6 57.1
2 +1 -1 1.1 97.8 1.1 77.8 1.2 73.0 1.0 74.5
3 -1 +1 1.1 100 1.3 100 2.2 73.5 1.4 86.8
4 +1 +1 1.1 86.6 1.1 79.1 1.1 51.2 1.1 75.9
5 -1.41 0 1.3 97.8 1.2 90 1.4 94.8 1.3 83.8
6 +1.41 0 1.1 91.9 1.0 84.1 1.0 93.4 1.0 76.2
7 0 -1.41 1.3 86.0 1.0 82.3 1.2 79.5 1.1 71.0
8 0 +1.41 1.5 86.7 1.3 67.1 1.3 68.5 1.1 72.1
9* 0 0 1.5 100 1.0 70.7 1.2 88.5 1.2 78.6
10* 0 0 1.6 100 1.0 77.7 1.3 80.2 1.2 73.1
11* 0 0 1.6 97.8 1.1 71.0 1.2 90.0 1.2 67.5
*central point.
Table 7 - Matrix of the CCRD for the coded values of the systems of polyethylene glycol 1500, 4000, 6000 and 8000/potassium phosphate, with the results obtained for volume ratio (Vr) and partition coefficient (Kpart).
Assay PEG
(%w/w)
Salt (%w/w)
PEG 1500 PEG 4000 PEG 6000 PEG 8000
Vr Kpart Vr Kpart Vr Kpart Vr Kpart
1 -1 -1 0.6 > 100 0.5 > 100 0.6 73.6 0.4 9.1
2 +1 -1 1.0 > 100 1.0 49.3 0.8 > 100 0.8 > 100 3 -1 +1 0.6 > 100 0.6 > 100 0.7 27.9 0.7 > 100
4 +1 +1 0.7 > 100 0.7 ∝ 0.4 > 100 0.7 > 100
5 -1.41 0 0.5 ∝ 0.5 > 100 0.6 32.2 0.6 78.6
6 +1.41 0 0.9 ∝ 0.9 ∝ 1.0 ∝ 0.7 ∝
7 0 -1.41 0.7 77.3 0.7 > 100 0.7 > 100 0.6 > 100 8 0 +1.41 0.5 > 100 0.5 > 100 0.6 > 100 0.5 > 100
9* 0 0 0.7 ∝ 0.7 > 100 0.7 > 100 0.7 > 100
10* 0 0 0.6 > 100 0.6 ∝ 0.7 > 100 0.6 > 100
11* 0 0 0.6 ∝ 0.6 > 100 0.7 > 100 0.6 > 100
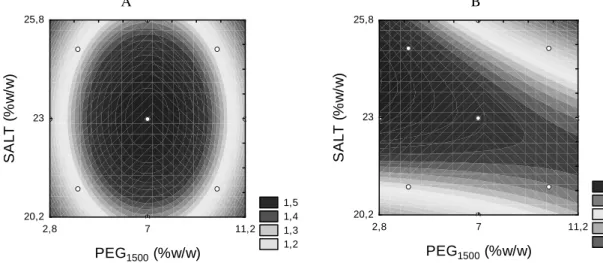
Results showed that in the trials with PEG 1500, the highest purification factors of 1.6 and 1.5-fold with the best protein recoveries, corresponded to the central points, composed of 7% (w/w) PEG and 23% (w/w) potassium phosphate. Thus, the optimization of the conditions of the purification process was achieved because the region of maximum purification factor coincided with the extreme point of curvature of surface response (see Fig. 1A). The coded quadratic models were evaluated in order to determine the correlation between the PEG and salt percentages and the purification factor and recovery of C-phycocyanin. Equations 7 and 8 showed the coded responses for purification factor (PF) and C-phycocyanin recovery (RC), respectively, with correlation coefficients of 0.88 and 0.90. PEG1500 and SALT
represented the concentration of polyethylene glycol 1500 g/gmol (%, w/w) and salt (%, w/w) for the range studied. The variance analyses (see Tables 8 and 9), where the F tests showed values 3.2 and 3.4-fold higher, respectively, than the
listed F-values, statistically validated the models and allowed for the construction of the response surfaces and contour diagrams presented in Figure 1.
PF = 1.57 – 0.22*[PEG1500] 2
– 0.12*[SALT]2 (7)
RC (%) = 98.23 – 2.38*[PEG1500] – 5.09*[SALT]
2
– 4.02*[PEG1500]*[SALT] (8)
According to the models obtained, the purification factor for C-phycocyanin could be predicted as a function of the percentages of PEG 1500 and potassium phosphate making up the ATPS, while the protein recovery was defined by the interaction between both the variables. In the PEG 1500/potassium phosphate system, Figure 1A indicated a range of PEG concentration between
4.6 (w/w) and 9.3% (w/w) and range of salt
between 21 (w/w) and 25% (w/w) as the optimal region for the purification of C-phycocyanin, reaching a purification factor of 1.5-fold. In this region, the recovery of C-phycocyanin was around 95 to 100% (Fig. 1B).
A
1,5 1,4 1,3 1,2
2,8 7 11,2
PEG1500 (%w/w) 20,2
23 25,8
S
A
L
T
(
%
w
/w
)
B
100 95 90 85 80
2,8 7 11,2
PEG1500 (%w/w) 20,2
23 25,8
S
A
L
T
(
%
w
/w
)
Figure 1 - Contour diagram for the C-phycocyanin purification factor (a) and recovery (b) in the polyethylene glycol 1500/potassium phosphate system with experimental points.
Table 8 - ANOVA for the C-phycocyanin purification factors in the polyethylene glycol/potassium phosphate systems with PEG molecular masses of 1500, 6000 and 8000.
Source of variation
Sum of squares Degrees of freedom Mean square F-ratio*
1500 6000 8000 1500 6000 8000 1500 6000 8000 1500 6000 8000 Regression 0.30 0.63 0.20 2 2 1 0.15 0.32 0.20 14.46 8.69 17.66
Residual 0.08 0.29 0.10 8 8 9 0.01 0.04 0.01
Error 0.08 0.29 0.10 8 8 9
Total 0.38 0.93 0.30 10 10 10 Correlation coefficient for PEG 1500: R = 0.88, F0.95,2,8 = 4.46
Correlation coefficient for PEG 6000: R = 0.83, F0.95,2,8 = 4.46
Correlation coefficient for PEG 8000: R = 0.81, F0.95,1,9 = 5.12
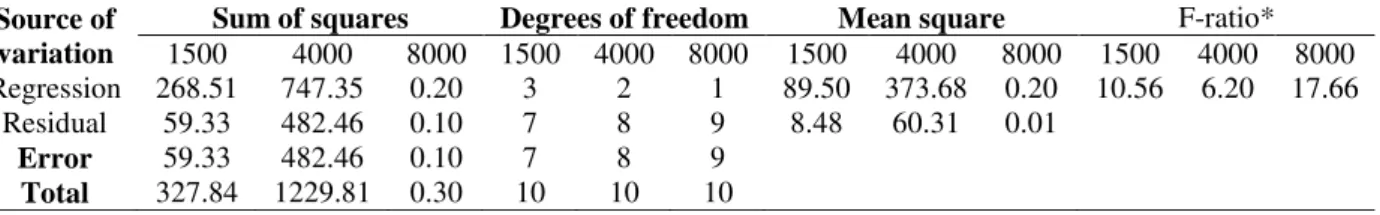
Table 9 - ANOVA for the recovery of C-phycocyanin in polyethylene glycol/potassium phosphate potassium, for the molecular masses of PEG 1500, 4000 and 8000.
Source of variation
Sum of squares Degrees of freedom Mean square F-ratio* 1500 4000 8000 1500 4000 8000 1500 4000 8000 1500 4000 8000 Regression 268.51 747.35 0.20 3 2 1 89.50 373.68 0.20 10.56 6.20 17.66
Residual 59.33 482.46 0.10 7 8 9 8.48 60.31 0.01
Error 59.33 482.46 0.10 7 8 9
Total 327.84 1229.81 0.30 10 10 10 Correlation coefficient for PEG 1500: R = 0.90, F0.90,3,7 = 3.07
Correlation coefficient for PEG 4000: R = 0.78, F0.90,2,8 = 3.11
* F-ratio (regression/residual)
For the PEG 4000/potassium phosphate system, the best purification factor was obtained with 4% (w/w) of PEG and 21% (w/w) of salt, reaching 2.1-fold (purity of 1.12) with a Vr of up to 0.6 and total recovery of the target-protein (Tables 6 and 7). In this case, maximization provided a 40% increase in the purification factor as compared to the result obtained in the previous experimental design, of 1.5-fold. This was referred as maximization because the best C-phycocyanin purification factor or recovery was not achieved in the central conditions of the proposed design. The statistical analysis of the results for the C-phycocyanin purification factor (data not shown) only allowed to obtain the effects of the PEG and potassium phosphate percentages on this response, since a statistically significant model could not be obtained. At 95% confidence, the percentages of PEG 4000 and salt presented a negative effect on the C-phycocyanin purification factor. For both the variables, the change from level -1 to level +1 resulted a decrease in the C-phycocyanin purification factor. However, the interaction between the variables positively influenced the response. The coded model for the recovery of C-phycocyanin (RC) in the ATPS with PEG 4000, with a correlation coefficient of 0.78, was validated using the F test, where the calculated F was 2-fold higher than that shown in the Table 9, as shown in Equation 9. PEG4000 represented the
concentration of polyethylene glycol 4000 g/gmol (%, w/w) for the range studied.
RC (%) = 75.81 – 6.43*[PEG4000] +
8.26*[PEG4000]2 (9)
According to the model obtained, in the PEG 4000/potassium phosphate system, the recovery of C-phycocyanin could be predicted from the quadratic model exclusively from the percentage of polymer involved, with no influence of the salt percentage on the response. The model made it
possible to construct the response surface and respective contour diagram (data not shown), which made it clear that for a determined percentage of PEG, the recovery of C-phycocyanin remained the same for the entire range of potassium phosphate percentage studied.
For the PEG 6000/potassium phosphate system, the best C-phycocyanin purification factor of 2.2-fold (purity of 1.24) was obtained with a
composition of 4% of polymer and 21% (w/w) of
the salt. Thus, a maximization of experimental conditions was achieved and this purification factor was 30% higher than the maximum value obtained before, of 1.7-fold with 73.5% of recovery (Tables 7 and 8). Thus, once again it was observed that the purification process was better in the systems with low polyethylene glycol and high potassium phosphate concentrations. These results were better than those achieved by Liu et al. (2012), who obtained purification factors between 1.44 and 1.64-fold and recoveries of around 60% for the C-phycocyanin from S. platensis using a single extraction in an aqueous two-phase system, which was also composed PEG 6000 and potassium phosphate (pH 7.0) with 34% (w/w) TLL. The values were also higher than those found by Silva et al. (2009), of 1.7-fold with purity between 0.57 and 0.89, using a precipitation technique as the early downstream stage. This was due to the use of an experimental design, which permitted the optimization of the conditions of the purification process or maximization of the purification factor. A simple and efficient purification procedure can significantly reduce the overall costs and affect process viability.
Equation 10 presents the coded model for the C-phycocyanin purification factor (PF) with a correlation coefficient of 0.83. PEG6000 and SALT
variance analysis by way of the F test, where the calculated F-value was 1.9-fold higher than the listed F-value (Table 8).
PF = 1.31 – 0.21*[PEG6000] –
0.27*[PEG6000]*[SALT] (10)
From Equation 10, the polymer percentage and its interaction with the salt concentration predicted the model for the C-phycocyanin purification factor in the PEG 6000/potassium phosphate ATPS. The surface response and respective
contour diagram for the C-phycocyanin
purification factor in this ATPS showed that a purification factor of 2-fold could be attained when working with low PEG 6000 concentrations of between 2.8 (w/w) and 4.9% (w/w) and salt percentages from 20.3 to 21.4%. Although it was not possible to obtain a statistically significant model for the recovery of C-phycocyanin, the statistical analysis (data not shown) of the results showed that with 90% confidence, the PEG 6000 and salt concentrations as also their interaction, negatively influenced this response, i.e., the change from level -1 to level +1 of each entrance variable, resulted a decrease in the recovery of C-phycocyanin.
For the PEG 8000/potassium phosphate systems, the best C-phycocyanin purification factor obtained was 1.6-fold with a composition of 4% (w/w) of polymer and 22.5% (w/w) of salt, with the lowest Vr obtained amongst the trials and the lowest percentage of the polymer used. In this trial, a very low Kpart value of 9.1 was obtained,
but since it was above 1, it indicated the migration of most of the C-phycocyanin to the system’s bottom phase. The low target-protein recovery in the top phase of about 57%, in relation to the other systems studied, could be justified by the fact that part of the C-phycocyanin might have passed to the bottom phase with the decrease in volume ratio (Tables 6 and 7). Equation 11 presented the coded model for the C-phycocyanin purification factor (PF) with a correlation factor of 0.83, validated by the variance analysis by way of the F test, where the calculated F-value was 3.4-fold higher than the listed F-value (Table 8), allowing for the construction of the response surface and contour diagram (data not shown). PEG8000 represented the
concentration of polyethylene glycol 8000 g/gmol (%w/w) for the range studied.
PF = 1.21 – 0.16*[PEG8000] (11)
Equation 11 showed that model for the purification factor could be predicted exclusively from the
PEG percentage involved in the PEG
8000/potassium phosphate system, indicating that this response tended to be independent of the salt percentage present in the ATPS in the range studied. From the response surface analysis, it was seen that for a fixed PEG percentage, the C-phycocyanin purification factor did not alter throughout the potassium phosphate concentration range studied, of from 21.9 (w/w) to 26.1% (w/w), i.e., the variable of potassium phosphate percentage did not influence the response considered. For the recovery of C-phycocyanin, the statistical analyses (data not shown) showed the effects of the polymer percentages, since it was not possible to obtain a statistically significant model. With 90% confidence, it was observed that the concentrations of PEG 8000 and salt positively influenced the C-phycocyanin recovery, i.e., the passage from level -1 to level +1 of both entrance variables resulted an increment in C-phycocyanin recovery. However, their interaction had a negative effect on the recovery response.
CONCLUSIONS
The aqueous two-phase systems (ATPS)
consisting of polyethylene glycol/potassium
phosphate proved to be a promising purification method for the C-phycocyanin extracted from S.
platensis,resulting for certain compositions, a
food, since low costs and high recoveries were necessary. ATPSs could be an economic alternative using non-toxic reagents for the early downstream stage, which could be used for food processes.
ACKNOWLEDGEMENTS
This study was supported by the Coordenação de Aperfeiçoamento de Pessoal de Nível Superior
(CAPES), Brazil.
REFERENCES
Albertson PA. Partitioning of Cell Particles and Macromolecules. New York: John Wiley & Sons; 1986.
Abalde J, Betancourt L, Torres E, Cid A, Barwell C. Purification and characterization of phycocyanin from the marine cyanobacterium Synechococcus sp. IO920. Plant Sci. 1998; 136: 109-120.
Barros Neto B, Scarminio IS, Bruns RE. Planejamento e Otimização de Experimentos. Campinas: Ed. UNICAMP; 1995.
Benavides J, Rito-Palomares M. Bioprocess intensification: a potential aqueous-two phase process for the prymary recovery of B-phycoerythrin from
Porphyridium cruentum. J Chromatogr B. 2004; 807: 33-38.
Bennett A, Bogorad L. Complementary chromatic adaptation in a filamentous blue-green alga. J Cell Biol. 1973; 58: 419-435.
Box GEP, Hunter WG, Hunter JS, Hunter WG. Statistics for Experimenters: An Introduction to Design, Data Analysis and Model Building. New York: Wiley, 1978, 653p.
Bermejo R, Alvarez-Pez JM, Acién FG, Molina E. Recovery of pure B-phycoerythrin from the microalga Porphyridium cruentu. J Biotechnol. 2002; 93: 73-85.
Bermejo R, Ramos A. Pilot scale recovery of phycocyanin from Spirulina platensis using expanded bed adsorption chromatography. Chromatographia. 2012; 75: 195-204.
Chaiklahan R, Chirasuwan N, Loha V, Tia S, Bunnag B. Separation and purification of phycocyanin from
Spirulina sp. using a membrane process. Bioresor Technol. 2011; 102: 7159-7164.
Cohen Z. Products from microalgae. In: Richmond A. Handbook of Microalgal Mass Culture. Florida: CRC Press, 1986, 736p.
Costa JAV, Cozza KL, Oliveira L, Magagnin G. Different nitrogen sources and growth responses of
Spirulina platensis in microenviroments. World J Microbiol Biotechnol. 2002; 17: 439-442.
Costa, JAV, Linde GA, Atala DIP, Mibielli GM, Krueger RT. Modelling of growth conditions for cyanobacterium Spirulina platensis in microcosms.
World J Microbiol Biotechnol. 2000: 16; 15-18. Freire MG,Cláudio AFM, Araujo JMM, Coutinho JAP,
Marrucho IM, Canongia Lopes JN et al. Aqueous Biphasic Systems: A Boost Brought About by using Ionic Liquids. Chem Soc Rev. 2012: 41; 4966-4995. Gutowski KE, Broker GA, Willauer HD, Huddleston
JG, Swatloski RP, Holbrey JD et al. Controlling the aqueous miscibility of ionic liquids: aqueous biphasic systems of miscible ionic liquids and water-structuring salts for recycle, metathesis, and separations. J Am Chem Soc. 2003: 125; 6632-6633. Herrera A, Boussiba S, Napoleone V, Hohlberg A.
Recovery of c-phycocyanin from the cyanobacterium
Spirulina maxima. J Appl Phycol. 1989: 1; 325-331. Klomklao S, Benjakul S, Visessanguan W, Simpson
BK, Kishimura H. Partitioning and recovery of proteinase from tuna spleen by aqueous two-phase systems. Process Biochem. 2005; 40: 3061-3067. Liu Y, Feng Y, Lun J. Aqueous two-phase
countercurrent distribution for the separation of c-phycocyanin and alloc-phycocyanin from Spirulina platensis. Food Bioprod Process. 2012; 90: 111-117. Marcos JC, Fonseca, LP, Ramalho MT, Cabral JMS.
Partial purification of penicillin acylase from
Escherichia coli in poly(ethynele glycol)-sodium citrate aqueous two-phase systems. J Chromatogr B. 1999; 734: 15-22
Minkova KM, Tchernov AA, Tchorbadjieva MI, Fournadjieva ST, Antova RE, Busheva MC. Purification of c-phycocyanin from Spirulina (Arthrospira) fusiformis. J Biotechnol. 2003; 116: 55-59.
Montgomery DC. Design and Analysis of Experiments.
New York: Wiley, 1991, 752p.
Nagaraja VH, Iyyaswami R. Aqueous two phase partioning of fish proteins: partitioning studies and ATPS evaluation. J Food Sci Technol. [Internet]. 2014 [cited 2014 Jun. 23]. Available from: http://download.springer.com/static/pdf/701/art%253 A10.1007%252Fs13197-014-1425 4.pdf?auth66 =1403904309_57079369b90fde00a41cc131783afcd7 &ext=.pdf
Rito-Palomares M, Nunez L, Amador D. Practical application of aqueous two-phase systems for the development of a prototype process for c-phycocyanin recovery from Spirulina maxima. J Chem Technol Biotechnol. 2001; 76: 1273-1280. Romay C, Armesto J, Ramirez D, Gonzalez R, London
NY, Garcıa Y. Antioxidant and anti-inflammatory properties of c-phycocyanin from blue-green algae.
InflammationRes. 1998; 47: 36-41.
system for protein partitioning: Influence of molecular weight, pH and temperature. Process Biochem. 2008;43: 905-911.
Sebastiao MJ, Cabral JMS, Aires-Barros MR, Raquel, M.. Improved purification protocol of a Fusarium solani pisi recombinant chitinase by phase partitioning in aqueous two-phase systems of polyethylene glycol and phosphate. Enzyme Microb Technol. 1996; 18: 251-260.
Shahriari S, Tomé LC, Arajo JMM, Rebelo LPM. Aqueous biphasic systems: a benign route using cholinium-based ionic liquids. RSC Adv. 2013; 3; 1835-1843.
Silva DP, Pontes MZ, Souza MA,Vitolo M, Silva JB, Pessoa Junior A. Influence of pH on the partition of glucose-6-phosphate dehydrogenase and hexokinase in aqueous two-phase system. Braz J Microbiol. 2002; 33: 196-201.
Silva LA, Kuhn KR, Moraes CC, Burkert CAV, Kalil SJ. Experimental design as a tool for optimization of C-phycocyanin purification by precipitation from
Spirulina platensis. J Braz Chem Soc. 2009; 20: 5-12.
Silva LHMS, Loh W. Sistemas aquosos bifásicos: fundamentos e aplicações para partição/purificação de proteínas. Quím Nova. 2006; 29: 1345-1351.
Silveira ST, Burkert JFM, Costa JAV, Burkert CAV, Kalil SJ. Optimization of phycocyanin extraction from Spirulina platensis using factorial design.
Bioresource Technol. 2007; 98: 1629-1634.
Vonshak A., Spirulina platensis Arthospira: Physiology, Cell-Biology and Biotechnology. London: CRC Press, 1997, 233p.
Wu Y, Wang Y, Zhang W, Han J, Liu Y, Hu Y, Ni L. Extraction and preliminary purification of anthocyanins from grape juice in aqueous two-phase system. Sep Purif Technol. 2014; 124: 170-178. Yoshida A, Takagaki Y, Nishimune T. Enzyme
immunoassay for phycocyanin as the main component of Spirulina color in foods. Biosci Biotechnol Biochem. 1996; 60: 57-60.
Zarrouk C. Contribution à L’étude d’une Cyanophycée: Influence de Divers Facteurs Physiques et Chimiques sur la Croissance et la Photosynthèse de Spirulina maxima [PhD Thesis]. Paris, France: Université de Paris, 1966.
Zeng Q, Wang YZ, Li N, Huang X, Ding X, Lin X et al. Extraction of proteins with ionic liquid aqueous two-phase system based on guanidine ionic liquid.
Talanta. 2013; 116: 409-416.