Multi-Trait analysis of growth traits: fitting reduced rank models using principal
components for Simmental beef cattle
Efetividade da redução da dimensão da matriz de covariância do efeito genético direto na avaliação genética do crescimento em bovinos Simental
Rodrigo Reis MotaI* Edson Vinícius CostaI Paulo Sávio LopesI Moyses NascimentoII Luciano Pinheiro da SilvaIII Fabyano Fonseca e SilvaI Luiz Fernando Aarão MarquesIV ISSN 1678-4596
ABSTRACT
The aim of this research was to evaluate the dimensional reduction of additive direct genetic covariance matrices in genetic evaluations of growth traits (range 100-730 days) in Simmental cattle using principal components, as well as to estimate (co)variance components and genetic parameters. Principal component analyses were conducted for
five different models-one full and four reduced-rank models. Models were compared using Akaike information (AIC) and Bayesian information (BIC) criteria. Variance components
and genetic parameters were estimated by restricted maximum
likelihood (REML). The AIC and BIC values were similar among
models. This indicated that parsimonious models could be used
in genetic evaluations in Simmental cattle. The first principal
component explained more than 96% of total variance in both models. Heritability estimates were higher for advanced ages and varied from 0.05 (100 days) to 0.30 (730 days). Genetic correlation estimates were similar in both models regardless
of magnitude and number of principal components. The first principal component was sufficient to explain almost all genetic
variance. Furthermore, genetic parameter similarities and lower computational requirements allowed for parsimonious models in genetic evaluations of growth traits in Simmental cattle.
Key words: computational demand, genetic parameters, heritability.
RESUMO
Objetivou-seestudar a efetividade da redução da dimensão da matriz de covariância do efeito genético direto na avaliação genética do crescimento (pesos dos 100 aos 730 dias de idade) de bovinos Simental, por meio da análise de componentes principais, e estimar componentes de (co)variância
e parâmetros genéticos. A análise de componentes principais foi realizada ajsutando-se cinco diferentes modelos: um modelo multicaracterístico padrão, de posto completo, e quatro modelos de posto reduzido. Os modelos foram comparados via informação
de Akaike (AIC) e informação Bayesiana de Schwarz (BIC).
Os componentes de variância e parâmetros genéticos foram
obtidos via REML. Os valores de AIC e BIC para os modelos
testados foram similares, indicando a possibilidade da escolha de um modelo mais parcimonioso na avaliação genética da raça Simental. O primeiro componente principal explicou mais de 96% de toda variação genética aditiva direta em ambos os modelos. Os valores de herdabilidades foram maiores em idades mais avançadas e variaram de 0,05 (peso aos 100 dias) a 0,30 (peso aos 730 dias). As estimativas de correlações genéticas foram similares em todos os modelos e apresentaram mesma magnitude e comportamento independentemente do número de componentes
principais adotado. Diante dos resultados, pode-se afirmar que apenas o primeiro componente principal foi suficiente para
explicar quase que na totalidade a variação genética aditiva direta existente. Além disso, a similaridade dos parâmetros genéticos estimados e a menor demanda computacional são indicativos da possibilidade da utilização de modelos mais parcimoniosos na avaliação genética de bovinos Simental.
Palavras-chave: herdabilidade, demanda computacional, parâmetros genéticos.
INTRODUCTION
The success of beef production depends upon several important economic traits,
IDepartamento de Zootecnia, Universidade Federal de Viçosa (UFV), Campus Universitário, Avenida Ph Rolfs, s/n, 36570-900, Viçosa, MG, Brasil. E-mail: rodrigo.mota@ufv.br. *Corresponding author.
IIDepartamento de Estatística, Universidade Federal de Viçosa (UFV), Viçosa, MG, Brasil. IIIDepartamento de Zootecnia, Universidade Federal do Ceará (UFC), Fortaleza, CE, Brasil.
including breeding to achieve effective genetic variability through selection (MASCIOLI et al., 2000). Typically, a livestock breeder’s decision-making is intuitive; in other words, animals are
selected according to specific phenotypes, but trait
components and linkages with others are neglected. In this context, principal component analysis may help clarify relationships among variables and improve decision-making (MASCIOLI et al., 2000; NASCIMENTO et al., 2014; OLIVEIRA et al., 2014).
Principal components analysis is a multivariate approach that transforms the original set of variables (the principal components), which are linear combinations of all original variables (MEYER & KIRKPATRICK, 2005), and has elucidated important properties in animal breeding studies. In addition, the principal components approach discounts less discriminant variables (because they are correlated with other variables), and thus, is a useful tool for rank reduction (CRUZ & REGAZZI, 1997).
Different approaches (e.g., principal components and factor analyses) designed to reduce data dimensions in multivariate models have been proposed to facilitate interpretation and
computational efficiency. When these approaches
are directly applied to the covariance matrices of multivariate mixed models, such models are called “reduced rank models” (BIGNARDI et al., 2012; MEYER, 2005). MEYER (2007a) proposed rank reduction to obtain models more parsimonious (with reduced number of parameters) that are able to generate estimates of variance components and genetic parameters with the same accuracy as models that includes all traits (e.g., the standard full rank model). However, studies using such approach on beef cattle genetic evaluation are still scarce.
Therefore, the aim of this research was to determine the effectiveness of direct genetic effect covariance matrix rank reduction on growth traits (weights at 100, 205, 365, 450, 550, and 730 days of age) in a genetic evaluation of Simmental cattle by using principal components analyses, as well as to estimate genetic parameters of each trait considered in the study.
MATERIALS AND METHODS
The data used in this study refers to
Simmental cattle body weight (BW) records from
485 farms and was provided by the Brazilian Association of Simmental and Simbrasil Breeders
(ABCRSS) located at Cachoeiro de Itapemirim, Espírito Santo State, Brazil. Records from 60 to 819 days of age from animals born between 1974 and 2006 were used. Dataset was composed of adjusted
weights for cattle at 100 (W100), 205 (W205), 365 (W365), 450 (W450), and 730 (W730) days of age,
such that weights at 60-149, 150-299, 300-419, 420-499, 500-619, and 620-819 days of age were used to
obtain the W100, W205, W365, W450, W550, and W730, respectively.
The BWs were adjusted using the
following equation: PPi = Pj + {[(Pi - Pj)/(Di)]*Ii},
where PPi is the standardized weight at age i, Pi is the observed weight closest to standard age Ii, Pj is the previously observed weight at Pi, Ii is the standard age, and Di is the days of age related to the observed weight Pi. Iindex i varies from i = 1 (at 100 days) to i = 6 (at 730 days).
Records outside the intervals given by the contemporary group averages (±3 standard
deviations) were excluded. After filtering, the
dataset had 29,510 records for 10,659 animals, sons of 1,289 sires and 7,332 cows. Number of observations (average ± standard deviation) were 6,236 (130.76 ± 40.26), 7,938 (222.56 ± 60.38), 6,070 (338.47 ± 83.77), 3,666 (380.50 ± 90.34), 3,468 (441.10 ± 104.51), and 2,132 (562.72 ±
141.59) for W100, W205, W365, W450, W550, and W730, respectively.
It was used an animal model with
contemporary group as a fixed effect, defined as
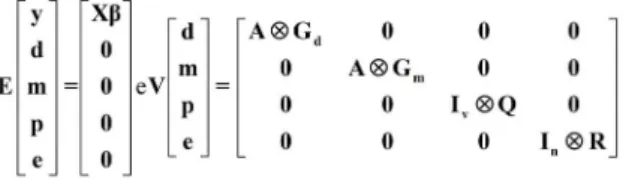
the same sex, year, and birth period (1 = January to March, 2 = April to June, 3 = July to September and 4 = October to December). Classes of cows’ age (days) at calving was a covariate (class 1, from 700 to 1,109; class 2, from 1,110 to 1,519; class 3, from 1,520 to 1,919; and class 4, from 1,920 to 2,340). The following were random effects: direct additive genetic, maternal additive genetic, permanent maternal environment, and residual. In matrix form, the model is described as
[1]
where y is the observations vector; β is the fixed effects vector; d is the vector of random direct additive genetic effects; m is the vector of random maternal additive genetic effects; p is the vector of random permanent maternal environment effects; X
Considering the independence and normality of d, m, p, and e random effects, the following assumptions were made:
where Gd is the (co)variance matrix of random direct additive genetic effects; Gm is the (co) variance matrix of random maternal additive genetic effects; Q is the (co)variance matrix of random permanent maternal environment effects; R is the (co)variance matrix of random residual effects, A is the numerator relationship matrix, Iv is the identity matrix with order v, where v is the number of mothers, In is the identity matrix with order n,
where n is the number of observations, and ⊗ is the Kronecker product operator.
Being a covariance matrix of direct additive genetic effects with order k x k, Gd can be decomposed into Gd = EΛE′ where Λ is the diagonal matrix of Gd eigenvalues with λi for i varying from 1 to k and E = [e1|e2|…|ek] is the matrix of eigenvectors (MEYER & KIRKPATRICK, 2005). Thus, using k = 6, the Gd matrix has the original size (called the M6 model), but considering k = 2, 3, 4, and 5, we have the more parsimonious reduced rank models M2, M3, M4, and M5, respectively. Therefore, for k = 6, there are 21 parameters (6 variances at the diagonal and 15 covariances outside the diagonal) to estimate Gd, and for k = 2, 3, 4, and 5 the parameters are reduced to 3, 6, 10,
and 15, respectively. The model fit was performed via REML using the software WOMBAT (MEYER,
2007b). Models were compared using Akaike information (AIC) and the Schwarz Bayesian information (BIC) criteria.
RESULTS AND DISCUSSION
Although M6 presented lower AIC and BIC
values (Table 1), the goodness of fit between models
was generally similar, indicating the possibility of a more parsimonious model for genetic evaluations of growth in Simmental cattle. LEGARRA et al. (2004) stated that more parsimonious models are preferred because of the smaller computational demands and lower susceptibility to numerical errors. MEYER (2007a) showed that genetic variance between carcass traits in Angus cattle could be performed using more parsimonious models (i.e., considering a subset of genetic principal components).
Direct additive genetic variance in both models presented equivalent variance component progression along the days of weighting (Figure 1). This direct additive genetic variance behavior may have occurred because animals at advanced ages present genetic values with higher magnitudes, because of their higher phenotypic values (body weight). Therefore, the variance measure of genetic values (direct additive genetic variance) is also directly affected by this magnitude increase, the so-called “scale effect.” This effect can be observed in table 2 with regard to the magnitude
of the first principal component coefficient, in which
higher values are observed for advanced ages. Similar results were reported by MARQUES et al. (1999) and MOTA et al. (2013) working with Simmental beef cattle. In addition, BOLIGON et al. (2013) reported similar direct additive genetic variance component estimates between all tested models for Nellore cattle. According to these authors, fewer principal
components are sufficient to explain almost all
genetic variability.
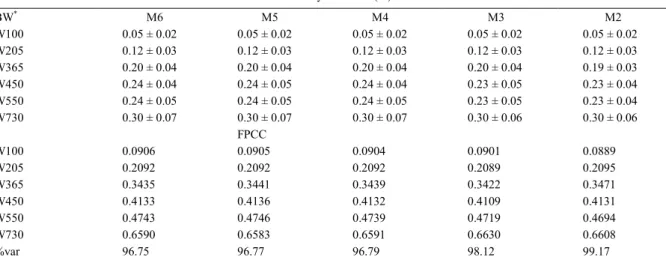
Heritability estimates (Table 2) were higher in advanced ages and remained stable between the tested models (range 0.05-0.30). In general, animals
Table 1 - Number of parameters (Np); Akaike information criterion (AIC) and Schwarz Bayesian information criterion (BIC) for all tested
models.
Models Np AIC BIC
M6 84 -100,144.332 -100,482.632
M5 82 -100,142.328 -100,472.475
M4 78 -100,138.359 -100,452.401
M3 72 -100,132.694 -100,422.579
M2 64 -100,126.343 -100,384.019
at mature ages were less sensitive to environmental effects, such that non-genetic variance (maternal environmental and residual) tended to be less relevant, which reduced the denominator of the heritability expression. MARQUES et al. (2000) reported similar heritability estimates at 100 (0.08), 205 (0.13), 365 (0.19), and 550 (0.24) days of age in Simmental
beef cattle. Conversely, BOLIGON et al. (2013) and MEYER (2007a) studying growth traits through reduced rank models in Angus and Nellore cattle,
respectively, did not observe significant changes in
heritability estimates as reported in this study.
For all tested models, the first principal
component explained more than 96% of the entire Figure 1 - Genetic variance estimates for models M6, M5, M4, M3, and M2 in which the number represents the rank of the (co)variance
genetic matrix for body weights at 100, 205, 365, 450, 550, and 730 days old.
Table 2 - Heritability estimates ± standard errors, first principal component coefficient (FPCC), and the percentage of the direct additive
genetic variance (%var) explained by the principal components for all tested models at 100 (W100), 205 (W205), 365 (W365), 450 (W450), 550 (W550), and 730 (W730) days old.
---Heritability estimates (h2
)---BW* M6 M5 M4 M3 M2
W100 0.05 ± 0.02 0.05 ± 0.02 0.05 ± 0.02 0.05 ± 0.02 0.05 ± 0.02
W205 0.12 ± 0.03 0.12 ± 0.03 0.12 ± 0.03 0.12 ± 0.03 0.12 ± 0.03
W365 0.20 ± 0.04 0.20 ± 0.04 0.20 ± 0.04 0.20 ± 0.04 0.19 ± 0.03
W450 0.24 ± 0.04 0.24 ± 0.05 0.24 ± 0.04 0.23 ± 0.05 0.23 ± 0.04
W550 0.24 ± 0.05 0.24 ± 0.05 0.24 ± 0.05 0.23 ± 0.05 0.23 ± 0.04
W730 0.30 ± 0.07 0.30 ± 0.07 0.30 ± 0.07 0.30 ± 0.06 0.30 ± 0.06
FPCC
W100 0.0906 0.0905 0.0904 0.0901 0.0889
W205 0.2092 0.2092 0.2092 0.2089 0.2095
W365 0.3435 0.3441 0.3439 0.3422 0.3471
W450 0.4133 0.4136 0.4132 0.4109 0.4131
W550 0.4743 0.4746 0.4739 0.4719 0.4694
W730 0.6590 0.6583 0.6591 0.6630 0.6608
%var 96.75 96.77 96.79 98.12 99.17
BW: body weights; M6: full rank model; M5, M4, M3, M2: reduced rank models in which the number represents the rank of the
direct additive genetic variance (Table 2). MEYER (2005), using simulated data, reported that the number of principal components included in reduced rank analyses depended on the size of the dataset (i.e., for a small datasets fewer components are needed than for larger datasets, in which a reduction in sample variance to alleviate increased prediction errors is needed).
Direct additive genetic correlation estimates for M6, M5, M4, M3, and M2 models were positive
and high (>0.80) as shown in figure 2. In general,
these estimates suggest that animal selection for body weight at any age implies an indirect selection
response in the same direction as BW, being more
efficient in close age groups. These results corroborate those of NEPHAWE (2004), BOLIGON et al. (2009),
and BALDI et al. (2010).
CONCLUSION
It was concluded that the first principal component was sufficient to almost entirely explain
the direct additive genetic variance. Despite the
fact that models with more principal components fit
better, because of the similarity in estimated genetic parameters and the lower computational demand, the use of more parsimonious models is indicated for the genetic evaluation of Simmental beef cattle.
ACKNOWLEDGEMENTS
The authors thank the Associação Brasileira de Criadores das Raças Simental & Simbrasil for providing the data.
REFERENCES
BIGNARDI, A.B. et al. Short communication: principal components and factor analytic models for test-day milk yield in Brazilian Holstein cattle. Journal of Dairy Science, v.95, p.2157-2164, 2012. Available from: <http://www.ncbi.nlm.nih. gov/pubmed/22459860>. Accessed: Jan. 16, 2015. doi: 10.3168/ jds.2011-4494.
BOLIGON, A.A. et al. Multi-trait and random regression mature weight heritability and breeding value estimates in Nelore cattle.
South African Journal of Animal Science, v.39, p.145-148, 2009. Available from: <http://www.ajol.info/index.php/sajas/ article/view/61167>. Accessed: Dec. 12, 2014. doi: 10.4314/sajas. v39i1.61167.
BOLIGON, A.A. et al. Principal components and factor analytic models for birth to mature weights in Nellore cattle. Livestock
Science, v.152, p.135-142, 2013. Available from: <http://www. sciencedirect.com/science/article/pii/S187114131300036X>. Accessed: Feb. 05, 2015. doi: 10.1016/j.livsci.2013.01.005.
CRUZ, C.D.; REGAZZI, A.J. Modelos biométricos aplicado ao
melhoramento genético. 2.ed. Viçosa, MG: Universidade Federal de Viçosa, 1997. 390p.
LEGARRA, A. et al. Constructing covariance functions for random regression models for growth in Gelbvieh beef cattle. Journal of
Animal Science, v.82, p.1564-1571, 2004. Available from: <https:// dl.sciencesocieties.org/publications/jas/abstracts/82/6/0821564>. Accessed: Nov. 10, 2014. doi: /2004.8261564x.
MARQUES, L.F.A. et al. Variance components and genetic parameters estimates for growth traits of Simmental cattle in Brazil. Arquivos Brasileiros de Medicina Veterinária
e Zootecnia, v.51, p.363-370, 1999. Available from: <http://www.scielo.br/scielo.php?script=sci_arttext&pid =S0102-09351999000400013>. Accessed: Sept. 05, 2014. doi: 10.1590/S0102-09351999000400013.
MARQUES, L.F.A. et al. Análise de característica de crescimento da raça Simental. Arquivos Brasileiros de
Medicina Veterinária e Zootecnia, v.52, p. 527-533, 2000. Available from: <http://www.scielo.br/scielo.php?pid=S0102-09352000000500020&script=sci_arttext>. Accessed: Sept. 05, 2014. doi: 10.1590/S0102-09352000000500020.
MASCIOLI, A.S. et al. Estimativas de parâmetros genéticos e fenotípicos e análise de componentes principais para características de crescimento na raça Canchim. Revista
Brasileira de Zootecnia, v.29, p.1654-1660, 2000. Available from: <http://www.scielo.br/scielo.php?script=sci_arttext&pi
d=S1516-35982000000600009>. Accessed: Sept. 08, 2014. doi: 10.1590/S1516-35982000000600009.
MEYER, K.; KIRKPATRICK, M. Restricted maximum likelihood estimation of genetic principal components and smoothed covariance matrices. Genetics Selection Evolution, v.37, p.1-30, 2005. Available from: <ttp://pubmedcentralcanada. ca/pmcc/articles/PMC2697245/pdf/1297-9686-37-1-1.pdf>. Accessed: Jun. 01, 2015.
MEYER, K. Genetic principal components for live ultra-sound scan traits of Angus cattle. Animal Science, v.81, p.337-345, 2005. Available from: <http://journals.cambridge.org/ action/displayAbstract?fromPage=online&aid=777600&fileId =S1357729805000895>. Accessed: Sept. 25, 2014. doi: 10.1079/ ASC50850337.
MEYER, K. Multivariate analyses of carcass traits for Angus cattle
fitting reduced rank and factor analytic models. Journal of Animal Breeding and Genetics, v.124, p.50-63, 2007a. Available from: <http://www.ncbi.nlm.nih.gov/pubmed/17488355>. Accessed: Dec. 05, 2014. doi: 10.1111/j.1439-0388.2007.00637.x.
MEYER, K. WOMBAT - A tool for mixed model analyses in
quantitative genetics by REML. Journal of Zhejiang University
Science B, v.8, p.815-821, 2007b. Available from: <http://www. ncbi.nlm.nih.gov/pmc/articles/PMC2064953/>. Accessed: Nov. 19, 2014. doi: 10.1631/jzus.2007.B0815.
MOTA, R.R. et al. The influence of animals from embryo transfer
on the genetic evaluation of growth in Simmental beef cattle by using multi-trait models. Genetics and Molecular Biology, v.36, p.43-49, 2013. Available from: <http://www.scielo.br/pdf/gmb/ v36n1/2012-165.pdf>. Accessed: Aug. 10, 2014. doi: 10.1590/ S1415-47572013005000008.
NASCIMENTO, G.B. et al. Genetic parameter estimates and principal component analysis on performance and carcass traits of a terminal pig sire line. Acta Agriculturae Scandinavica,
Section A - Animal Science, v.64, p.137-144, 2014. Available from: <http://www.tandfonline.com/doi/pdf/10.1080/09064702 .2014.950322#.VYw37_lViko>. Accessed: Sept. 18, 2014. doi: 10.1080/09064702.2014.950322.
NEPHAWE, K.A. Application of random regression models to
the genetic evaluation of cow weight in Bonsmara cattle of South Africa. South African Journal of Animal Science, v.34, p.166-173, 2004. Available from: <http://www.ajol.info/index.php/sajas/ article/view/3960>. Accessed: Feb. 09, 2015. doi: 10.4314/sajas. v34i3.3960.
OLIVEIRA, D.P. et al. Principal components for reproductive
and productive traits in buffaloes from Brazil. In: WORLD