Estimation of genetic parameters for test‑day milk
yield in Khuzestan buffalo
Mostafa Madad(1), Navid Ghavi Hossein‑Zadeh(2) and Abdol Ahad Shadparvar(3)
(1)Islamic Azad University, Young Researchers and Elite Club, Tabriz Branch, Postal Box 5157944533, Tabriz, Iran. E‑mail: madad_mostafa@tabrizu.ac.ir (2)University of Guilan, Faculty of Agricultural Sciences, Department of Animal Science, Postal Box 41635‑1314, Rasht, Iran. E‑mail: nhosseinzadeh@guilan.ac.ir (3)University of Guilan, Faculty of Agricultural Sciences, Department of Animal Science, Postal Box 41635‑1314, Rasht, Iran. E‑mail: shadparvar@yahoo.com
Abstract – The objective of this work was to estimate covariance functions for additive genetic and permanent environmental effects, as well as to obtain genetic parameters for buffalo test-day milk yield using random regression models on Legendre polynomials (LPs). A total of 2,538 test-day milk yield (TDMY) records from 516 first lactation records of Khuzestan buffalo, calving from 1993 to 2009 and belonging to 150 herds located in the state of Khuzestan, Iran, were analyzed. The residual variances were modeled through a step function with 1, 5, 6, 9, and 19 classes. The additive genetic and permanent environmental random effects were modeled by LPs of days in milk using quadratic to septic polynomial functions. The model with additive genetic and animal permanent environmental effects adjusted by cubic and third order LP, respectively, and with the residual variance modeled through a step function with nine classes was the most adequate one to describe the covariance structure. The model with the highest significant log‑likelihood ratio test (LRT) and with the lowest Akaike information criterion (AIC) and Bayesian information criterion (BIC) was considered to be the most appropriate one. Unexpected negative genetic correlation estimates were obtained between TDMY records of the twenty‑fifth and thirty‑seventh week (‑0.03). Genetic correlation estimates were generally higher, close to unity, between adjacent weeks during the middle of lactation. Random regression models can be used for routine genetic evaluation of milk yield in Khuzestan buffalo.
Index terms: covariance functions, genetic correlations, heritability, Legendre polynomial, milking buffalo.
Estimação de parâmetros genéticos para produção de leite
no dia do controle em búfalas Khuzestan
Resumo – O objetivo deste trabalho foi estimar funções de covariância para efeitos aditivos genéticos e efeitos ambientais permanentes, bem como obter parâmetros genéticos para produção de leite de búfalas no dia do controle, por meio de modelos de regressão aleatória com polinômios de Legendre (LPs). Foram analisados um total de 2.538 registros da produção de leite no dia do controle (PLDC) obtidos de 516 registros de primeira lactação de búfalas Khuzestan, com parições entre 1993 e 2009, pertencentes a 150 rebanhos localizados no Estado do Kuzestão, Irã. As variâncias residuais foram modeladas por uma “step function” com 1, 5, 6, 9 e 19 classes. Os efeitos genéticos aditivos e os efeitos aleatórios ambientais permanentes foram ajustados por LPs, para os dias em lactação, por meio de funções polinomiais quadráticas até de sétimo grau. O modelo com efeitos aditivos genéticos e efeitos ambientais permanentes animais, ajustado por LP de grau cúbico e de terceira ordem, respectivamente, e com variância residual ajustada por uma função com nove classes foi o mais adequado para descrever a estrutura de covariância. O modelo com maior probabilidade significativa do teste da razão de verossimilhança (LRT) e com menor critério de informação de Akaike e critério de informação bayesiano foi considerado o mais apropriado. Estimativas de correlação genética negativas inesperadas foram obtidas entre os registros de PLDC da vigésima quinta e da trigésima sétima semana (‑0,03). As correlações genéticas geralmente foram mais elevadas, próximo da unidade, entre as semanas adjacentes durante o meio da lactação. Modelos de regressão aleatória podem ser usados para avaliação genética de rotina de produção de leite em búfalas Khuzestan.
Termos para indexação: funções de covariância, correlações genéticas, herdabilidade, polinômios de Legendre, ordenha de búfalas.
Introduction
According to climatic conditions, Iranian water buffalo can be classified into three main groups: Azari
2016), which show some similarities to Iraqi buffalo (Tavakolian, 2000). Khuzestan, a province in the southwest of Iran, is one of the important regions
for raising buffalo. More than 22% of the buffalo population in the country is found in this area, with a
herd size of 5 to 300 animals (Naderfard & Qanemy,
1997).
The estimate of daily yield production with test-day models has several advantages over the traditional procedures of evaluating lactation records, such as the ability to account for environmental effects on each test-day and to model individual lactation
curves (Schaeffer et al., 2000). Random regression models (RRM) have been proposed as an alternative
methodology for the analysis of longitudinal data or
repeated measures records. For these reasons, RRM
were recommended for analyses of test-day models in
dairy cattle (Schaeffer & Jamrozik, 2008).
RRM allow obtaining breeding values for milk yield
at any day of lactation in a continuous manner or for
functions of lactation curve, when compared to finite
dimensional models that only give punctual predictions
of breeding values. Moreover, RRM provide estimates
of breeding values with higher accuracies than the
conventional finite dimensional models, because all
lactation and short-length lactation records can be
used in the genetic evaluation (Jamrozik et al., 2000;
Schaeffer et al., 2000).
The majority of random regression analyses fitted
polynomials of time or age as basic functions at
recording. In particular, Legendre polynomials (LPs)
have been widely applied to estimate covariance functions for growth traits in beef cattle and production
traits in dairy cattle. The order of LPs in RRM is
important in that estimates of genetic parameters can
differ with the order (Misztal et al., 2000). High‑order
polynomials were found to be the most adequate way of modeling changes in the mean and variance over
time; however, these orders of polynomials might
lead to errors in the estimates of genetic parameters, mainly due to oscillations at the extremes of the curve
(Meyer, 2005). One alternative that is currently being
studied to reduce the order of these polynomials and
to minimize estimation problems is the application of
segmented polynomials or spline functions (Laureano et al., 2014).
In Iran, the genetic analyses for milk yield of buffalo are carried out using a finite dimensional model, as
described in other studies (Rosati & Van Vleck, 2002). However, worldwide, RRM are currently being used
for national genetic evaluations of dairy cattle in
several countries, such as the United States, Canada, Australia, and Brazil (Sesana et al., 2014). Therefore, it
is crucial to apply these models in a genetic evaluation
program for milking buffalo in Iran.
Madad et al. (2013a) estimated the genetic parameters
for milk and fat yields in Khuzestan buffalo of Iran
with the multivariate restricted maximum-likelihood
(REML) procedure; however, there are no estimates of genetic parameters for test‑day milk yield in Khuzestan buffalo using RRM.
The objective of this work was to estimate covariance functions for additive genetic and permanent environmental effects, as well as to obtain genetic
parameters for buffalo test‑day milk yield using RRM
on LPs.
Materials and Methods
A total of 2,538 test-day milk yield (TDMY)
records from 516 first lactation records of Khuzestan
buffalo, calving from 1993 to 2009 and belonging to
150 herds located in the state of Khuzestan, Iran, were analyzed. The age of the evaluated cows varied from
24 to 60 months. TDMY was considered in weekly classes, from 1 to 37 weeks. The number of animals with records, number of sires, and number of dams
were 516, 151, and 685, respectively. Contemporary groups (CGs) were defined according to the effects of
herd, year, month, and day of milk test, as well as to year and season of calving.
The choice of fixed effects to be considered was
made after testing whether the effects were statistically
significant with the general linear model procedure of SAS (SAS Institute Inc., Cary, NC, USA). All of the fixed effects were significant (p<0.05) and included in the final model of analysis. Only records of buffalo with at least four tests and belonging to CGs of at least
four animals were kept.
Residual variances were modelled through a step function with the following classes: 1, 5 (1, 2, 3, 4,
of analysis included the fixed effects of CGs and age
of cow at calving as linear and quadratic covariables, respectively. The additive genetic and animal permanent environmental effects were considered as random effects. Additive genetic effects (a) were modeled through quadratic, cubic, quartic, quintic, and sextic polynomial functions, involving ka = 3, 4, 5, 6, and 7 random regression coefficients, respectively.
Animal permanent environmental effects (p) were modeled through quadratic, cubic, quartic, quintic, sextic, and septic polynomial functions, involving
kp = 3, 4, 5, 6, 7, and 8 random regression coefficients,
respectively. The following random regression model
was used for the analysis:
Yimnptv Fimnptv cf agen f
f r r r t
k
pr r t
= +
(
)
+(
)
+(
)
= =
∑
0∑
2 0β α Φ Φ dim dim rr k
pr r t r k imnptv a p = − = −
∑
+∑
(
)
+ 0 1 0 1γ Φ dim ε
in which, Yimnptv is the test-day record i obtained at
dimt of buffalo p calved at the nth age in herd-test
date m; Fimnptv are fixed effects related to Ymnptv (herd,
year, month, and day of milk test, and year-season of
calving); Cfis the f
th fixed regression coefficient for
calving age; agen is the nth calving age; k is the order
of fit for fixed regression coefficients (k=2); βris the
rth fixed regression coefficient; k
ais the order of fit for
additive genetic random regression coefficients; kpis
the order of fit for permanent environmental random
regression coefficients; αpris the r
th random regression
coefficient of additive genetic value of buffalo p; γpr
is the rth random regression coefficient of permanent
environmental effect of buffalo p; Φr(dimt) is the r
th
coefficient of LPs evaluated at days in milk tth; and
εmnptvis the random residual error. It was assumed that
distributions for random genetic and residual effects were multivariate normal distribution with mean 0 and variances Aσa2 and I
e
σ2
, respectively, in which
A and I are the additive numerator relationship matrix
and identity matrix, respectively; and
σ
a2
and
σ
e 2are direct genetic and residual variances, respectively. The (co)variance components and genetic parameters for productive traits were estimated using the average
information (AI) REML algorithm of the Wombat
program (Meyer, 2006). The following formulas were used to estimate the additive genetic, permanent environmental, and residual variances, as well as the heritabilities and genetic and permanent environmental
correlations between different days in milk:
σa i i( , ) ϕirKaϕir; σp i i( , ) ϕirKpϕir; σa i j, ϕirKaϕj
2 2
= ′ = ′ ( ) = ′rr
p i j ir p jr i a i i ph
a i j a i j
K h R i ; ; ; , ( , ) , ,
σ ϕ ϕ σ σ
σ ( )
( ) ( )
= ′ =
=
2 2 2
σ
σ σ
σ σ σ
a i i a j j
p i j p i j p i i p j j
R , , , , , , ; ; ( ) ( ) ( ) ( ) ( ) ( )
(
)(
)
=(
)(
)
2 2 2 2in which, σa i i( , ),
2 σ
p i i( , ), 2
and σphi 2
are the direct additive, permanent environmental, and phenotypic variances at days in milk ith, respectively; σ σ
a i( , )j and p( , )i j
2 2
are the direct additive and permanent environmental covariances between days in milk ith and jth; h
i2 is the
heritability for days in milk ith; R
a(i,j) and Rp(i,j) are the
direct genetic and permanent environmental correlations between days in milk ith and jth, respectively; K
ais the order of fit for additive genetic random regression
coefficients; Kp is the order of fit for permanent
environmental random regression coefficients; and
φir and φ'jr are rth coefficient of LPs evaluated at days
in milk ith and jth, respectively. Results from different models of analyses were compared by the REML form of the Akaike information criterion (AIC) (Akaike, 1974) and of Schwarz’s Bayesian information criterion (BIC) (Schwarz, 1978), and by inspecting the variance
component and genetic parameter estimates. A model
with the highest significant (p <0.05) LRT and with the lowest AIC and BIC was considered to be the most appropriate. The information criteria are as follows: AIC = ‑2log + 2p and BIC = ‑2log + p log (N – r(x)).
In addition, LRT for models i and j was calculated with
the following formula: LRTij = 2 × (Log Li - Log Lj).
For the abovementioned equations, p denotes the number of parameters estimated; N is the sample size; r(x) is the rank of the coefficient matrix of fixed effect in the model of analysis; and Log L is the REML
maximum log likelihood. The polynomial order and
type of residual variance in different RRM are similar:
ka.kp.hety or ka.kp.hom, in which: ka is the order of the
covariance function for the additive genetic effect; kp
is the animal permanent environmental effect; hom is the homogeneity of residual variances; and het are the
residual variances modeled by a step function with y classes.
Results and Discussion
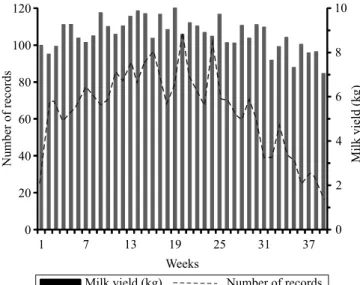
The mean, standard deviation, and coefficient of
i.e., 10.36 kg, was observed at the nineteenth week of lactation and then decreased to 7.05 kg until the end
of lactation (Figure 1). Breda et al. (2010) found that
the peak TDMY of Murrah buffalo occurred around
the eleventh week of lactation, whereas Hurtado‑Lugo
et al. (2006) reported the greatest values of TDMY
close to the middle of lactation in North Colombia
buffalo. According to Madad et al. (2013b), the peak
milk yield of Iranian buffalo occurred on the ninetieth
day of lactation.
The order of fit for additive genetic and permanent environmental effects was kept constant to define the
best variance structure to model the residual variances.
The results of LRT, AIC, and BIC indicated a significant improvement in the level of fit when residual variance
was considered heterogeneous (Table 1). This shows that
residual variances had different behavior along lactation;
therefore, it is necessary to consider a heterogeneous variance structure for the residuals. Several studies on dairy cattle have found a heterogeneous variance
structure for the residual over lactation (Brotherstone et al., 2000; Bignardi et al., 2009). In the present study, only models with step function fit were compared. The AIC results indicated that a step function with 19
classes was the most adequate to model the residual
variances. However, the results of LRT and of BIC that Figure 1. Number of records (lines) and test‑day milk yield
(bars) for each week of lactation of Khuzestan buffalo.
Table 1. Order of fit for the polynomial used in the different models and information criteria(1).
Model Polynomial order e P Log L AIC BIC LRT
Ka Kp
1 3 3 Hom 13 -1,598.1 3,222.2 3,286.4
2 3 3 Het4 16 -1,340.2 2,712.5 2,927.6 (2–3)93.9**
3 3 3 Het6 18 -1,387.2 2,738.5 2,799.5 (3–4)194.3**
4 3 3 Het9 21 -1,290.1 2,622.2 2,726.0 (4–5)20.3ns
5 3 3 Het19 31 -1,279.9 2,621.9 2,775.1
6 3 4 Het9 25 -1,371.4 2,792.8 2,916.3 (6–7)1,521.6**
7 3 5 Het9 30 -2,132.2 4,324.5 4,472.7 (7–8)248.8**
8 3 6 Het9 36 -2,256.6 4,585.3 4,763.2 (8–9)240.9**
9 3 7 Het9 43 -2,377.1 4,840.3 5,052.8
10 4 4 Het9 29 -1,318.1 2,694.2 2,837.5 (10–11)5.6ns
11 4 5 Het9 34 -1,320.9 2,709.9 2,877.9 (11–12)58.5**
12 4 6 Het9 40 -1,350.2 2,780.4 2,978.1 (12–13)2,587.1**
13 4 7 Het9 47 -2,643.8 5,381.6 5,613.8
14 5 5 Het9 39 -2,044.5 4,167.0 4,359.8 (14–15)1,518.3**
15 5 6 Het9 45 -1,285.3 2,660.7 2,883.0 (15–16)61.7**
16 5 7 Het9 52 -1,316.2 2,736.4 2,993.4
17 6 6 Het9 51 -1,889.7 3,881.5 4,133.5 (17–18)540.7**
18 6 7 Het9 58 -2,160.1 4,436.3 4,722.9 (18–19)58.7**
19 6 8 Het9 66 -2,130.7 4,393.5 4,719.7
20 7 7 Het9 65 -2,031.5 4,193.0 4,514.1 (20–21)279.3**
21 7 8 Het9 73 -1,891.8 3,929.7 4,290.4
(1)k
a, order of fit of additive genetic effect; kp, order of fit of permanent environmental effect; e, residual effect with heterogeneous (het) or homogeneous
penalized more parameterized models showed that a step function with nine classes was sufficient to model
the residual variances. After having chosen the most adequate structure to model the residual variances, with nine classes of residual variances, several models were compared varying in the order of covariance functions for additive genetic (ka) and permanent environmental
effects (kp). According to the AIC, the 3.3.het19 model
was the most adequate one to describe the covariance
structure of data, whereas the BIC pointed out that the 3.3.het9 model was the best to fit the data. Since BIC
tends to choose more parsimonious models and is more
rigorous than AIC, the 3.3.het9 model was selected as
the most adequate one to describe milk yield variation during lactation.
Additive genetic variances had the highest values in the early weeks of lactation, whereas permanent environmental variances were the highest in the
twenty‑fifth week (Figure 2). Likewise, Sesana et al.
(2010) compared different structures of permanent
environmental variances using RRM and found higher
variance estimates at early lactation in milking buffalo.
Madad et al. (2013b), using RRM in dairy buffalo, also
reported high additive genetic variance in the early months of lactation, despite observing lower variances.
Phenotypic variance estimates were higher during
the first two weeks of lactation, which decreased at the
ninth week and then reached the maximum value at
the thirteenth week of lactation. Based on the results of Bignardi et al. (2009) and Sesana et al. (2010),
Figure 2. Additive genetic (A), permanent environmental (B), phenotypic (C), and residual (D) variance estimates for test‑day
using RRM in dairy cattle and in milking buffalo,
respectively, the highest phenotypic variances for
dairy traits occurred in the first days of lactation. Residual variance estimates were higher at the
middle of the lactation period and lower at the end. Sesana et al. (2010) compared different structures of
residual variances using RRM and also found higher
residual variance estimates at early lactation in dairy buffalo. The heritability estimates were higher at the beginning of the lactation period and then decreased
along lactation (Figure 3), probably due to the limited
production of data attributed to the small number of
animals and milk yield records. Heritability estimates
obtained by the 3.3.het9 model varied from 0.53 in
the first week to 0.04 in the thirty-third week. When
the estimates of heritabilities for milk yield at early lactation were ignored, heritability for milk yield
was higher than that reported by Hurtado‑Lugo et al. (2006) for Murrah buffalo in Colombia (0.01 to 0.20), but similar to that obtained by Chakraborty et al.
(2010), Breda et al.(2010), and Madad et al. (2013b),
who found that the heritability estimates for test-day milk yield were low to medium in milking buffalo.
Hurtado‑Lugo et al. (2006) and Tonhati et al. (2008) analyzed TDMY records of milking buffalo by finite
models and observed a similar trend for heritability estimates to that obtained in the present study from the
thirteenth to the twenty‑fifth week, with values ranging from 0.19 to 0.30 and from 0.16 to 0.20, respectively. Even though higher heritability estimates were obtained at the beginning of lactation in the present
study, RRM are probably weak to describe variance
components at the extreme of the trajectory, when the
number of TDMY decreased. In addition, the highest
heritability estimates at initial lactation might be due
to the fact that milk yield during the first test‑days is
critical to calf survival in terms of both volume and content, and, therefore, could have a large genetic
component (Geetha et al.,2007). According to Meyer
(2005), LPs were susceptible to “end‑range” problems,
including implausible variance estimates at the extreme of the trajectory, mainly when the number of records decreased during this period, as observed in the present
work. Furthermore, Cobuci et al. (2005), who used the
exponential function of Wilmink (1987), found higher heritability estimates at the end of lactation but lower estimates at the beginning.
Estimates for milk yield ranged from -0.03 to 1.0 for genetic correlations and from -0.94 to 1.0 for the
permanent environmental ones (Table 2). Genetic Figure 3. Heritability estimates for test‑day milk yield for
each week of lactation of Khuzestan buffalo, obtained with a model with nine classes of heterogeneous residual effect and orders of fit for direct additive and permanent environmental effects equal to 3.
Table 2. Estimated genetic correlations (below diagonal) and permanent environmental correlations (above diagonal) among different lactation weeks for test‑day milk yield in Khuzestan buffalo.
Week Week
1 5 9 13 17 21 25 29 33 37
1 0.81 -0.86 -0.94 -0.93 -0.94 -0.93 -0.51 -0.88 -0.80
5 0.97 -0.31 -0.60 -0.75 0.73 -0.68 -0.61 -0.31 -0.25
9 0.90 0.97 0.95 0.94 -0.40 0.92 0.99 0.1 0.64
13 0.81 0.92 0.98 0.97 -0.55 0.98 1.0 1.0 0.98
17 0.72 0.85 0.94 0.99 -0.57 0.99 1.0 1.0 0.96
21 0.66 0.81 0.92 0.99 1.0 -0.62 -0.60 -0.59 -0.54
25 0.66 0.80 0.92 0.97 0.99 1.0 0.99 1.0 1.0
29 0.42 0.88 0.96 1.0 0.96 1.0 0.99 0.98 1.0
33 0.82 0.46 0.79 0.73 0.67 0.97 0.64 0.68 0.99
correlations for milk yield were often higher between different weeks of lactation, when compared to the permanent environmental ones, and were also generally higher, close to unity, between adjacent weeks during the middle of lactation, decreasing as the distance between the weeks increased. Therefore, permanent environmental correlation estimates were lower than those of the genetic ones, showing higher
fluctuation along lactation and higher estimates for
adjacent weeks, similarly to genetic correlations.
Cobuci et al. (2005), using RRM, also found high
genetic correlation estimates between TDMY records in dairy cattle. Moreover, in the present study, negative genetic correlations for milk yield between
the twenty‑fifth and thirty‑seventh weeks of lactation
were also observed. Sesana et al. (2010) registered unexpected negative genetic correlation estimates
between TDMY records from the first weeks and from the middle to the end of lactation. Negative genetic
correlation estimates between early and late TDMY
records, using RRM in dairy cattle, were also reported by Brotherstone et al. (2000) and Bignardi et al. (2009). In the present study, estimates of genetic correlations
for milk yield showed lack of consistency between the beginning and the end of the lactation period. Similar negative genetic correlations for productive traits were
found by Brotherstone et al. (2000) and Bignardi et al. (2009), using RRM, in the course of lactation in dairy cattle. Post‑calving cow stress during the first days
of lactation may have affected the obtained results
because cows usually show energy deficit during early lactation. Various factors, such as dry period, days
open, pregnancy and physical injuries, can also affect
the results. According to Misztal et al.(2000), there are
marked differences between estimates of the genetic
parameters obtained with different RRM. These
differences might be attributed to the small number of milk yield records or to the models and functions used
to describe the random regression (Breda et al., 2010).
Conclusions
1. Random regression models can be used for routine genetic evaluation of milk yield in Khuzestan buffalo of Iran.
2. Improved fit is performed for models with the same order of fit for random effects but with varying
assumptions about the distribution of the residual variance.
3. Heritability estimates are higher at the beginning
of the lactation period and lower towards the end, which indicates that milk yield in the early weeks of lactation can be applied as a selection criterion in
Khuzestan buffalo.
Acknowledgement
To the National Animal Breeding Center of Iran, for
providing the data for the study.
References
AKAIKE, H. A new look at the statistical model identification.
IEEE Transactions on Automatic Control, v.19, p.716-723,
1974. DOI: 10.1109/TAC.1974.1100705.
BIGNARDI, A.B.; EL FARO, L.; CARDOSO, V.L.; MACHADO, P.F.; ALBUQUERQUE, L.G. de. Random regression models to estimate test‑day milk yield genetic parameters Holstein cows in
Southeastern Brazil. Livestock Science, v.123, p.1‑7, 2009. DOI:
10.1016/j.livsci.2008.09.021.
BREDA, F.C.; ALBUQUERQUE, L.G.; EUCLYDES, R.F.; BIGNARDI, A.B.; BALDI, F.; TORRES, R.A.; BARBOSA, L.; TONHATI, H. Estimation of genetic parameters for milk yield
in Murrah buffaloes by Bayesian inference. Journal of Dairy
Science, v.93, p.784‑791, 2010. DOI: 10.3168/jds.2009‑2230.
BROTHERSTONE, S.; WHITE, I.M.S.; MEYER, K. Genetic
modelling of daily milk yields using orthogonal polynomials and parametric curves. Animal Science, v.70, p.407-415, 2000.
CHAKRABORTY, D.; DHAKA, S.S.; PANDER, B.L.; YADAV, A.S.; DANDAPAT, A. Genetic studies on 305 days and test day
milk yield records in Murrah buffaloes. Indian Journal of Animal Science, v.80, p.729-732, 2010.
COBUCI, J.A.; EUCLYDES, R.F.; LOPES, P.S.; COSTA, C.N.; TORRES, R. de A.; PEREIRA, C.S. Estimation of genetic parameters for test‑day milk in Holstein cows using a random
regression model. Genetics and Molecular Biology, v.28, p.75-83,
2005. DOI: 10.1590/S1415‑47572005000100013.
GEETHA, E.; CHAKRAVARTY, A.K.; VINAYA KUMAR, K.
Estimates of genetic parameters using random regression test day
model for first lactation milk yield in Murrah buffaloes. Indian
Journal of Animal Science, v.77, p.898-901, 2007.
GHAVI HOSSEIN‑ZADEH, N. Bayesian analysis of direct and maternal effects for birthweight in Iranian buffaloes using Gibbs
sampling. Animal Production Science, v.56, p.859-865, 2016.
DOI: 10.1071/AN14564.
HURTADO‑LUGO, N.; CERÓN‑MUÑOZ, M.;
GUTIÉRREZ‑VALENCIA, A. Estimates of genetic parameters of milk yield in test day analysis in buffaloes of the Colombian
Atlantic Coast. Livestock Research for Rural Development,
v.18, p.1-6, 2006.
JAMROZIK, J.; SCHAEFFER, L.R.; JANSEN, G.B. Approximate
Livestock Production Science, v.66, p.85‑92, 2000. DOI: 10.1016/ S0301-6226(00)00158-5.
LAUREANO, M.M.M.; BIGNARDI, A.B.; EL FARO, L.; CARDOSO, V.L.; TONHATI, H.; ALBUQUERQUE, L.G. Random regression models using different functions to model
milk flow in dairy cows. Genetics and Molecular Research, v.13,
p.7528‑7541, 2014. DOI: 10.4238/2014.September.12.20.
MADAD, M.; GHAVI HOSSEIN‑ZADEH, N.; SHADPARVAR, A.A. Genetic and phenotypic parameters for productive traits in
the first three lactations of Khuzestan buffaloes in Iran. Archiv
Tierzucht, v.56, p.423-429, 2013a.
MADAD, M.; GHAVI HOSSEIN‑ZADEH, N.; SHADPARVAR, A.A.; KIANZAD, D. Random regression models to estimate
genetic parameters for test-day milk yield and composition in
Iranian buffaloes. Archiv Tierzucht, v.56, p.276‑284, 2013b. DOI:
10.7482/0003‑9438‑56‑027.
MEYER, K. Random regression analyses using B‑splines to model
growth of Australian Angus cattle. Genetics Selection Evolution,
v.37, p.473‑500, 2005. DOI: 10.1186/1297‑9686‑37‑6‑473. MEYER, K. “WOMBAT” – digging deep for quantitative genetic analyses by restricted maximum likelihood. In: WORLD CONGRESS ON GENETICS APPLIED TO LIVESTOCK
PRODUCTION, 8., 2006, Belo Horizonte. Proceedings. Belo
Horizonte: Instituto Prociência, 2006. 1 CD‑ROM.
MISZTAL, I.; STRABEL, T.; JAMROZIK, J.; MÄNTYSAARI, E.A.; MEUWISSEN, T.H.E. Strategies for estimating the
parameters needed for different test-day models. Journal of Dairy Science, v.83, p.1125‑1134, 2000. DOI: 10.3168/jds. S0022-0302(00)74978-2.
NADERFARD, H.R.; QANEMY, A.W. Buffalo breeding in Islamic Republic of Iran. In: WORLD BUFFALO CONGRESS, 5., 1997,
Caserta. Proceedings. Caserta: [s.n.], 1997. p.942‑943.
ROSATI, A.; VAN VLECK, L.D. Estimation of genetic parameters for milk, fat, protein and mozzarella cheese production for the
Italian river buffalo Bubalus bubalis population. Livestock
Production Science, v.74, p.185‑190, 2002. DOI: 10.1016/ S0301-6226(01)00293-7.
SCHAEFFER, L.R.; JAMROZIK, J.; KISTEMAKER, G.J.; VAN
DOORMAAL, B.J. Experience with a test‑day model. Journal
of Dairy Science, v.83, p.1135‑1144, 2000. DOI: 10.3168/jds. S0022-0302(00)74979-4.
SCHAEFFER, L.R.; JAMROZIK, J. Random regression models:
a longitudinal perspective. Journal of Animal Breeding and Genetics, v.125, p.145‑146, 2008. DOI: 10.1111/j.1439‑0388.200 8.00748.x.
SCHWARZ, G. Estimating the dimension of a model. The Annals
of Statistics, v.6, p.461‑464, 1978. DOI: 10.1214/aos/1176344136.
SESANA, R.C.; BIGNARDI, A.B.; BORQUIS, R.R.A.; EL FARO, L.; BALDI, F.; ALBUQUERQUE, L.G.; TONHATI, H. Random regression models to estimate genetic parameters for
test‑day milk yield in Brazilian Murrah buffaloes. Journal of
Animal Breedingand Genetics, v.127, p.369‑376, 2010. DOI:
10.1111/j.1439‑0388.2010.00857.x.
SESANA, R.C.; BALDI, F.; BORQUIS, R.R.A.; BIGNARDI, A.B.; HURTADO‑LUGO, N.A.; EL FARO, L.; ALBUQUERQUE, L.G.; TONHATI, H. Estimates of genetic parameters for total milk yield over multiple ages in Brazilian Murrah buffaloes using different
models. Genetics and Molecular Research, v.13, p.2784-2795,
2014. DOI: 10.4238/2014.April.14.7.
TAVAKOLIAN, J. An introduction to genetic resources of
native farm animals. Karaj: Animal Science Research Institute, 2000. 451p.
TONHATI, H.; CERÓN‑MUÑOZ, M.F.; OLIVEIRA, J.A. de; EL FARO, L.; LIMA, A.L.F.; ALBUQUERQUE, L.G. de. Test‑day
milk yield as a selection criterion for dairy buffaloes (Bubalus bubalis Artiodactyla, Bovidae). Genetics and Molecular Biology,
v.31, p.674‑679, 2008. DOI: 10.1590/S1415‑47572008000400012. WILMINK, J.B.M. Adjustment of test‑day milk, fat
and protein yields for age, season and stage of lactation. Livestock Production Science, v.16, p.335‑348, 1987. DOI:
10.1016/0301‑6226(87)90003‑0.