EARLY SELECTION OF ELITE PLANTS IN ASPARAGUS
ENRIQUE LUIS COINTRY(2); FERNANDO SEBASTIÁN LÓPEZ ANIDO(2); ILEANA GATTI(2); VANINA PAMELA CRAVERO(2); INÉS TERESA FIRPO(3);
STELLA MARIS GARCÍA(3)
ABSTRACT
In order to establish an efficient selection criterion the variability in three asparagus populations was evaluated defining the most important yield components and analysing its evolution along three growing seasons. The yield components, coefficient of variation (CV) and the proportion of plants contributing to 80% of the total yield were estimated. The elite plants were selected by mean of total yield and clusters techniques. Multiple regression showed that spear number (SN) and spear weight (SW) were the most important yield components. In every population, total yield (TY) and SN showed the highest values of CV, independently of sex. 69% of the plants contributed to the 80% of the total yield in the first year while in the second and third year the contribution was 57%. At the end of the third year, 17 plants were selected by the average of the total yield and 43 by clusters. It is suggested to select for SW in the first year, reducing in 68% the experimental material. In the second year, the selection for SN would reduce to 5% the plants to evaluate for total yield in the third year. In this way the selected plants are the same but the number of plants to evaluate is dramatically reduced along the years, therefore facilitating the breeders work.
Key words: asparagus, variability, elite plants, selection, plant breeding.
RESUMO
SELEÇÃO PRECOCE DE PLANTAS-ELITE DE ASPARGO
Com o fim de estabelecer um método de seleção eficiente, a variabilidade de três populações de aspargo foi avaliada, definindo-se os componentes de rendimento mais importantes e analizando-se a sua evolução durante três anos de cultivo. Os componentes de rendimento, o coeficiente de variação (CV) e a proporção de plantas que contribuíram para 80% do rendimento total foram calculados. Plantas-elite foram selecionadas através do rendimento total e técnicas de agrupamento “cluster”. A regressão múltipla mostrou que o número e o peso médio de turiões foram os componentes de rendimento mais importantes. Em todas as populações, o rendimento total e o número de turiões apresentaram os valores mais altos de coefíciente de variaçao, independentemente do sexo. No primeiro ano 69% das plantas contribuíram aos 80% do rendimento total, enquanto que no segundo e terceiro anos a contribuição foi de 57%. No final do terceiro ano 17 plantas (1.9%) foram selecionadas pelo rendimento total e 43 (4.8%) através da técnica deagrupamento. Recomenda-se selecioná-las pela massa média de turiões no primeiro ano, reduzindo em 68% a população inicial. No segundo ano a seleção seria feita pelo número de turiões, reduzindo a 5% as plantas que, no terceiro ano, serão avaliadas pelo rendimento total. Desse modo as plantas selecionadas são as mesmas, mas o número de plantas a avaliar no terceiro ano de cultivo é drasticamente reduzido, facilitando o trabalho do melhorista.
Palavras-chave: aspargo, variabilidade, plantas-elite, seleção precoce, melhoramento de plantas.
(1) Received for publication in December 11, 1998 and approved in March 30, 2000.
(2) Department of Genetics, Experimental Field of the National Rosario University, CC 14-2123 Zavalla, Santa Fe, Argentina. E-mail: [email protected]
1. INTRODUCTION
The great heterogeneity of asparagus populations is due mainly to the typical dioecy of the species (HUYSKES, 1959; ELLISON e SCHEER, 1959; MOON, 1976).
This implies that plants will either have different yield or precocity than the rest of them, thus affecting total yield. The extreme variability for horticultural traits in the cultivated populations represents an im-portant aspect that should be taken into consideration and even kept in the selection program of the species. Nevertheless, at present, the phenotypic uniformity is a fundamental objective in any breeding program for asparagus. BANNEROT et al. (1969) found that only
10% out of 334 evaluated plants represented the 20% of the highest total yield. In France, THÉVENIN (1967)
estimated that asparagus yields could be doubled if the field were planted exclusively with the genotypes of the higher yielding fraction. High yielding indi-viduals will therefore contribute to high total yields. Uniformity in association whit high yields can be achieved either by high yielding hybrids or by im-proved populations with lower genetic variability than current cultivated populations. Elite plants of proven yield and quality that would produce a supe-rior progeny (CURRENCE, 1947) are needed in both
cases. Evaluation within population for genetic vari-ability of yield and other economically important traits is essential for current asparagus production. This evaluation implies the observation of individual yield records along many seasons to obtain reliable results (FRANKLIN et al., 1980; BUSSEL et al., 1987), thus
requiring a considerable amount of work and land. Therefore the number of populations to be evaluated is limited by the requirements.
The object of this paper is to evaluate the variabil-ity for productive and vegetative characters in three blanched asparagus populations, and to define the most important yield components and their possible use in a selective scheme of elite plants.
2. MATERIAL AND METHODS
Three hundred plants of three different popula-tions of Argenteüil cultivars (P1 from Denmark and P2
and P3 from France) were used as experimental
mate-rial. The trial was planted during the spring of 1993 in the Experimental Field of the National Rosario University (Rosario, Santa Fe, Argentina) (33°1’ SL; 60°53’ WL). Rows were 2,1 m apart and plants 0,45 m apart within rows. The trial layout was designed as a randomized complete blocks with three replications (one hundred plants/population/block). Crowns were set at 0,2 m depth.
The following traits were recorded for each indi-vidual plant from 1994, to 1996:
Productive characters: Spear number (SN), mean spear mass (SM), mean spear diameter (SD) and total yield (TY). These variables were recorded during a period of 40 days from the emergence of the first shoot. Harvest was performed three times a week.
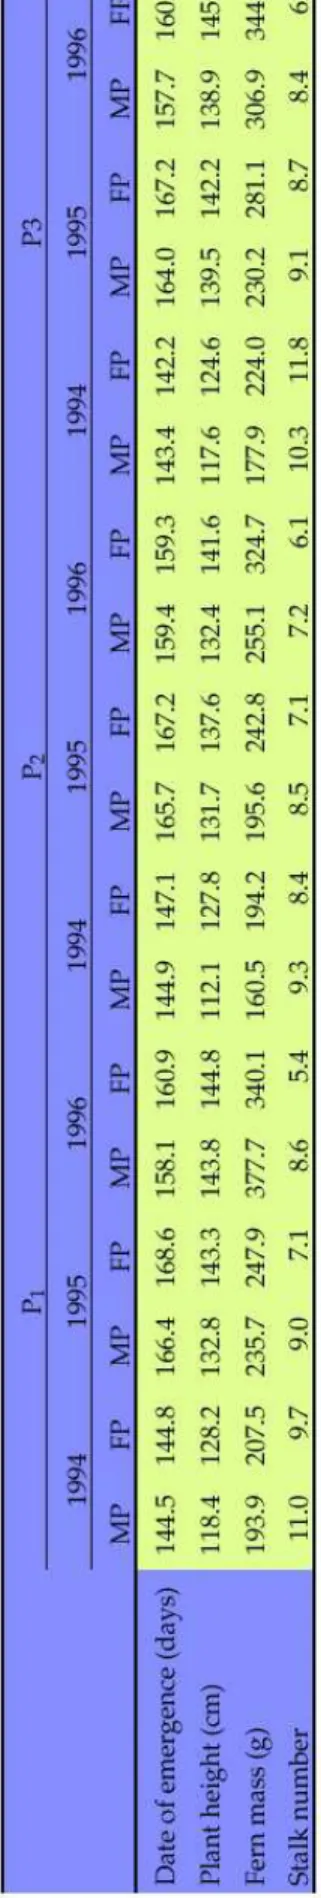
Vegetative characters: Date of emergence of the first spear (DE), fern mass (FM), plant height (PH) and stalk number (STN). These variables, except the first, were recorded at the end of the growing season.
The RSQUARE SAS Procedure (SAS Institute, 1982) was used to analyse the principal yield compo-nents in each of the growing seasons. The intrapopu-lation variability for male and female plants was estimated by means of the coefficient of variation (CV) (BANNEROT et al., 1969; NIKOLOFF et al., 1986).
Another indicator of variability was the proportion of plants contributing to 80% of the total yield (ROBB,
1936; BANNEROT et al., 1969; NIKOLOFF et al., 1986).
In the selection of elite plants two methods were used:
1) Average of total yield per plant along the three seasons of harvest. The limits were set in 350 g for male plants and 400 g for female (X + 2σ).
2) Grouping obtained by the cluster analysis tech-nique (SAS Tree Procedure, 1982) as a function of total yield, the spear mean mass and the spear number.
The phenotypic correlation between vegetatively and yield related traits were calculated in search of an easier measure of total yield. Those traits which did not present a normal distribution were transformed by √x+√x + 1 (SOKAL and ROHLF, 1981).
3. RESULTS AND DISCUSSION
3.1. Productive characters
Multiple regression analysis showed that among the three yield components recorded SN and SM were the most important ones, the values for the three harvest seasons being R2 = 0.968, R2 = 0.963 and R2 = 0.967, respectively. The balance between both variables was responsible for the lack of yield differ-ences between male and female plants (Table 1) in all the populations and years, as well as the number of plants contributing to 80% of the total yield (Table 2b) by the compensation between spear number and spear mass in each sex. This fact supports the idea that a higher yield is not exclusive of male plants, in agree-ment with THÉVENIN (1967), who worked with
Argen-teüil populations too, and found that the yield of pistilate plants was not higher and with LEY et al.
plants in asparagus crop to their superior spear di-ameter. Maximum yields came from plants having many large spears, whereas plants with many small spears did not produce high yields due to their small spear diameter. Consequently, plants with few large spears failed to produce high yields.
As it was expected in an ageing asparagus field crop, TY increased progressively along the three sea-sons (Table 1). Since SM got its maximum gains in the second year; it follows that TY increased is due to increases in SN. SD exhibited a similar behaviour to that of SM, indicating that both variables are highly correlated (r = 0.87; r = 0.91 and r = 0.84; p < 0.001 for 1994, 1995 and 1996 respectively). Considering the shape of a spear like a cylinder, the SM would be proportional to the SD (LEY et al., 1976). Nevertheless
SM is somewhat easier to measure than SD.
Productive traits showed a wide range of vari-ation. The CV’s have been used as a measure of uni-formity in asparagus trials. In the three populations, independently of the sex of the individual plant, the highest coefficient of variation corresponded to TY and SN (Table 2a), specially in 1995 and 1996. High CV’s have also been reported by NIKOLOFF et al., (1986)
in a study conducted in New Zealand.
The analysis of the CV indicates the existence of a differential behaviour of the variables since TY and SN increased in the second harvest year while SM and SD didnt (Table 2a). This is probably due to the fact that the spear diameter is related to the size of the crown buds, which depends on the fern growth (T IED-JENS, 1924; BLASBERG, 1932) and consequently on the
amount of available carbohydrates. If the growing conditions of the asparagus field are optimum the crowns would have the necessary reserves from the first harvest year. This situation point out that SM and SD could be used in a program of early selection.
The increase of TY and SN in the three populations showed that the potentiality in these characters is not expressed in the first year, therefore selection for them would be inefficient. The result is that in the first year the number of plants integrating the superior group would be higher than in the following years.
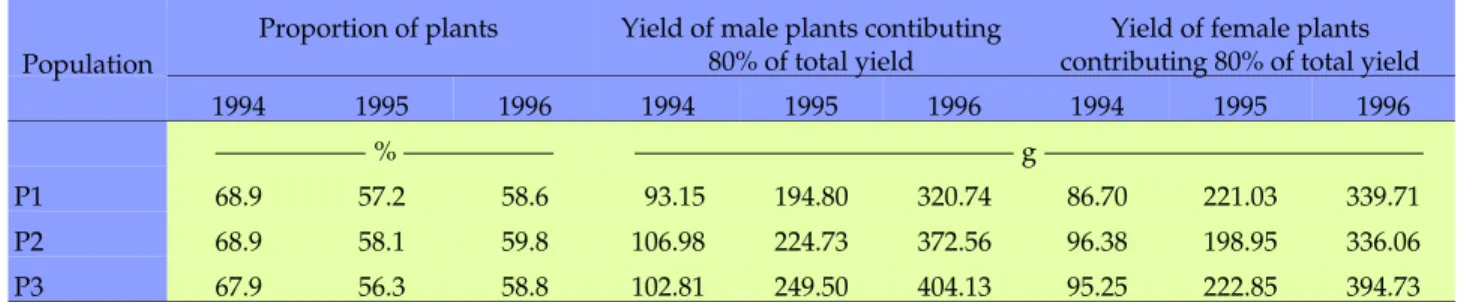
An alternative indicator of variability is the pro-portion of plants that make only a small contribution to the yield. In our trial, for the first harvest season almost 69% of the plants contributed 80% of the total yield, while this value decreased for the other periods (Table 2b).
A larger number of plants was selected by the cluster analysis but included the same selected ones mentioned above (Figure 1).
In the search for elite plants, an increased work is required so that less costly and less time consuming alternative selection criteria are needed. BANNEROT et
al. (1969) showed that the populations and the indi-vidual plants with superior yields in the first harvest period will be the best along the time. Thus, it would be possible to carry out a program of selection by yield components considering SM in the first year because this character expresses its potentiality since this stage. In our trial the male plants with a mean value over 14 g and female over 16 g were selected (X+2σ).
These limits depend on the populations variability and the selective pressure practised. This selection would reduce in 60% the number of plant to evaluate in the second year. In this moment the selection would be practised by SN (over 12 for the male plant and over 10 for female plants), considering also the values of X+2σ. This would strongly reduce the number of plants to evaluate in the third year (17 male plants and 30 female plants in our case).
The plants selected by spear mass (SM) in the first harvest season and by spear number (SN) in the sec-ond harvest season were the most highly productive during the third harvest period. In addition, to begin the plant selection in the first harvest season (early selection) would reduce in one year the total period of evaluation.
3.2. Vegetative traits
The date of emergence of the first spear was simi-lar in the three populations with a reduced variation in each one and lower values in the first harvest period (Table 4). This situation is probably related to the fact that the buds of the younger plants are active at lower temperatures than the buds of the older ones. ROBB (1984) found that the temperature threshold for
bud break varies with age and cultivar; 1- and 2-year-old plants produce spears earlier in spring than 2-year-older plants and some varieties are earlier than others.
Table 2a. Coefficients of variation for productive characters in the three years of evaluation
P1 P2 P3
1994 1995 1996 1994 1995 1996 1994 1995 1996
MP FP MP FP MP FP MP FP MP FP MP FP MP FP MP FP MP FP
Total yield (g) 47.3 45.5 65.7 58.1 62.1 58.7 44.5 44.8 57.1 59.5 54.3 53.4 49.7 54.0 60.4 67.2 55.1 64.9 Spear Number 36.4 36.9 62.2 52.9 60.2 55.5 37.8 36.0 57.0 55.3 50.3 58.8 41.1 38.9 57.6 58.2 52.4 56.0 Spear Mass (g) 36.3 41.2 35.3 33.6 36.1 32.6 43.7 44.2 40.8 45.5 34.1 36.2 37.8 48.2 45.8 45.8 48.3 49.2 Spear Diameter (mm) 22.3 29.7 19.2 20.7 18.4 18.5 26.8 30.9 22.4 26.9 19.2 19.7 24.3 31.3 23.9 26.1 20.8 23.9
MP: Male Plants; FP: Female Plants.
Table 2b. Proportion of plants contributing 80% of the total yield in the three years
Population
Proportion of plants Yield of male plants contibuting 80% of total yield
Yield of female plants contributing 80% of total yield
1994 1995 1996 1994 1995 1996 1994 1995 1996
% g
P1 68.9 57.2 58.6 93.15 194.80 320.74 86.70 221.03 339.71
P2 68.9 58.1 59.8 106.98 224.73 372.56 96.38 198.95 336.06
P3 67.9 56.3 58.8 102.81 249.50 404.13 95.25 222.85 394.73
Table 3. Number of the elite plants selected by mean yield values
Popu-lation
Sex N. of
The fern mass is determined by plant height and the stalk number produced during the growth sea-sons (r = 0.62 and r = 0.58; p < 0.001 for SN and PH, respectively) and is also correlated positively and significantly with TY (r = 0.58; p < 0.01). Population 2 showed the smallest values for FM (Table 4), because of the low stalk number produced throught the grow-ing seasons.
4. CONCLUSIONS
1. The methodology proposed would result in the same selected elite plants as the customary method but with the advantage of lowering in one year the harvest period, as well as the number of plants to be tested. This fact allows for the evaluation of an
Cluster selected
Number of plant
Yield 1994 Yield 1995 Yield 1996 g
VI 41 99.2 ± 34.2 230.3 ± 54.1 476.6 ± 53.9
V11 17 106.4 ± 45.5 389.1 ± 74.9 608.4 ± 72.1
Cluster Selected
Number of plant
Yield 1994 Yield 1995 Yield 1996 g
I 29 111.8 ± 43.5 348.8 ± 59.4 543.1 ± 55.2
V 6 144.2 ± 47.2 450.3 ± 67.1 851.1 ± 83.3
increased number of populations arranging them at regular intervals. Thus, it makes it easier to be per-formed by breeders.
In relation to the vegetative variables, the correla-tion coefficient between fern weight and total yield was not high enough to be used as yield indicator. Therefore these variables would not be useful as se-condary characters in the selection of elite plants.
REFERENCES
BANNEROT, H.; DERIEUX, M.; THÉVENIN, L.; ARNOUX, J. Résultats d’un essai comparatif de popu-lations dasperge. Annales de lAméliorioration des Plan-tes, Paris, v.19, n.3, p.289-324, 1969.
BLASBERG, C.H. Phases of the anatomy of seed-ling asparagus. Botanical Gazette, Chicago, v.94, p.206-214, 1932.
BUSSEL, W.T.; BRASH, D.W.; STIEFEL, W. Site variation in percentage of saleable yield of asparagus.
Proceedings of Agronomy Society of New Zealand, Wel-lington, v.17, p.19-20, 1987.
CURRENCE, T.M. Progeny tests of asparagus plants. Journal of Agricultural Research, Washington D.C., v.74, n.3, p.65-76, 1947.
ELLISON, J.H.; SCHEER, D.H. Yield related to brush vigor in asparagus. Proceedings of the American Society for Horticultural Science, Alexandria, v.73, p.339-344, 1959.
FRANKLIN, S.J.; BUSSELL, W.T.; COX, I.T.; TATE, G.K. Asparagus establishment and manage-ment for commercial production. AgLink HPP125, Wellington, New Zealand, Ministry of Agriculture and Fisheries, 1980. p.25.
HUYSKES, J.A. The value of comparative tests of progenies from open-pollinated female asparagus plants. Euphytica, Dordrecht, v.8, p.141-144, 1959.
LEY, J.P.; MONGET, M.; THÉVENIN, I. Lamélio-ration de lasperge (Asparagus officinalis L.): applica-tion conjointe de méthodes statistiques descriptives et inférentielles a lutilisation raisonnée des différences de production entre plantes mâles et femelles. Annales de lAmélioration des Plantes, Paris, v.26, n.4, p.675-716, 1976.
MOON, D.M. Yield potential of Asparagus offici-nalis L. New Zealand Journal of Experimental Agriculture, Wellington, v.4, p.435-438, 1976.
NIKOLOFF, A.S.; ENSOR; P.; PALMER; T.P.; WALLACE, A.R. Between plant variation of aspara-gus cultivars. New Zealand Agronomy Society Special Publication, Wellington, v.5, p.49-54,1986.
ROBB, A.R. Physiology of asparagus (Asparagus officinalis) as treated to the production of the crop. New Zealand Journal of Experimental Agriculture, Welling-ton, v.12, p.251-260, 1984.
ROBB, O.J. Some observations on individual as-paragus plants records. Scientific Agriculture, Chi-cago, v.17, n.3, p.144-145, 1936.
SOKAL, R.R.; ROHLF, F.G. Biometry, 2nd ed. San Francisco. Freeman, 1981. p.458
SAS INSTITUTE. SAS users guide: Statistics. Cary, NC. SAS Institute, 1982. 583p.
THÉVENIN, L. Les problèmes damélioration chez
Asparagus officinalis L. I Biologie et amélioration. An-nales de lAmélioration des Plantes, Paris, v.17, n.1, p.33-66, 1967.