SEMIVARIOGRAMS DERIVED FROM NDVI IMAGES
Detecção de mudanças no cerrado brasileiro utilizando semivariogramas derivados de imagens NDVI
Fausto Weimar Acerbi Júnior1, Eduarda Martiniano de Oliveira Silveira2, José Márcio de Mello2, Carlos Rogério de Mello2, José Roberto Soares Scolforo2
ABSTRACT
The Normalized Difference Vegetation Index (NDVI) is often used to extract information from vegetated areas since it is directly related to vegetation parameters such as percent of ground cover, photosynthetic activity of the plant and leaf area index. The aim of this paper was to analyze the potencial of semivariograms generated from NDVI values to detect changes in vegetated areas, analyzing their behavior (shape) and derived metrics (range, sill and nugget). Semivariograms were generated from NDVI values derived from Landsat TM images of May 2010, June 2010 and July 2011. The study area is located in the northern state of Minas Gerais, Brazil, and is covered by Brazilian savannas vegetation, totalizing 1,596 ha. Semivariograms were generated after the exploratory data analysis. Models were fitted, validated and their metrics analyzed. The results showed a very clear trend where the shape of semivariograms, sill and range were different when deforestation occurred and were similar when the area had not been changed. The model that generated best fit was the Gaussian, however, the three models tested showed behavior that makes it possible to detect changes in vegetation. It suggests that further researches should explore the degree to which the semivariogram can be used to quantify this spatial variability as well as to analyze the influence of sazonality for changing detection in vegetated areas.
Index terms: Deforestation; geostatistics; remote sensing.
RESUMO
O Índice da Vegetação por Diferença Normalizada (NDVI) é, frequentemente, usado para extrair informações de áreas vegetadas, uma vez que está diretamente relacionado com parâmetros da vegetação, como o percentual de cobertura do solo, a atividade fotossintética da planta e o índice de área foliar. Objetivou-se, neste trabalho, analisar o potencial dos semivariogramas gerados a partir do índice de vegetação NDVI, para a detecção de desmatamentos, analisando seu comportamento (forma) e métricas derivadas (alcance, contribuição e efeito pepita). Semivariogramas foram gerados a partir do índice de vegetação NDVI, derivados de imagens Landsat TM de maio de 2010, junho de 2010 e julho de 2011. A área de estudo é uma região de Cerrado, no norte do estado de Minas Gerais, Brasil, totalizando 1.596 ha. Foram gerados semivariogramas, após a análise exploratória dos dados. Modelos foram ajustados, validados e suas métricas analisadas. Observou-se que a forma dos semivariogramas, alcance e contribuição foram diferentes quando houve desmatamentos na área e similares quando a área não foi alterada. O modelo que melhor se ajustou aos dados foi o gaussiano, porém os três modelos testados mostraram comportamentos similares quanto a eficiência na detecção dos desmatamentos. Os resultados sugerem que estudos futuros explorem o grau de intervenção que os semivariogramas temporais consigam detectar, bem como a influência que a sazonalidade de algumas fisionomias pode ter nas análises.
Termos para indexação: Desmatamento; geoestatística; sensoriamento remoto.
1Universidade Federal de Lavras/UFLA – Cx. P. 3037 – 37200-000 – Lavras – MG – Brasil – [email protected] 2Universidade Federal de Lavras/UFLA – Lavras – MG – Brasil
Received in april 14, 2014 and approved in october 15, 2014 INTRODUCTION
The Earth’s surface and remotely sensed imagery contain spatial information that, if quantified can be used to optmize procedures in remote sensing, including image classification (Curran, 1988) and vegetation monitoring (Constantini et al., 2012). According to Mello et al. (2005), the semivariograms are the best method to characterize the structure of spatial continuity.
The semivariogram is the geostatistical method to find the presence of correlation between the samples. The semivariance is derived by calculating one-half the
average squared difference in data values for every pair of data locations separated by the same distance. Then, low values indicate less variability or greatest similarity (Mello et al., 2005).
ACERBI JÚNIOR, F. W. et al.
104
them. Thus, the correlation may be quantified and used for mapping purposes or identify different spatial patterns in the space (Zawadzki et al., 2005).
According to Zawadzki et al. (2005), the semivariance functions are usually characterized by three parameters: Sill, Range and Nugget. The sill is the plateau that the semivariogram reaches; beyond the plateau, spatial dependence does not exist anymore. It is the sum of total variation explained by the spatial structure and nugget effect. The range (range of influence or correlation) is the distance at which the semivariogram reaches the sill, or at which two data points are uncorrelated. The nugget is the vertical discontinuity at the origin. It is a combination of sampling error and short-scale variation that occurs at a scale smaller than the closest sample spacing. Moreover, there is also the contribution that is the difference between the sill and the nugget, which is known as structural variance of the data set.
The obtained experimental semivariogram is used to fit an appropriate theoretical mathematical model, such as the spherical, exponential, among others (McBratney; Webster, 1986).
Curran (1988), described six semivariograms forms of man modified surfaces. The classic one, periodic, aspatial, periodic-classic, unbounded and multifrequency. The first tree are the basics forms whereas the last tree are permutations of the basic forms. Lévesque and King (1999), analysed semivariogram forms, derived from high resolution imagery, to successfully discriminate structurally damaged forest from healthy forest.
Since we know the behavior of the reflected energy from the plants across the electromagnetic spectrum, we can derive the Normalized Difference Vegetation Index (NDVI) values by focusing on the satellite bands that are most sensitive to vegetation information. The NDVI is a numerical indicator that uses the visible and near-infrared bands of the electromagnetic spectrum to analyze remote sensing measurements of the vegetation in order to assess whether the target being observed contains live green vegetation or not (Rouse et al., 1974). It is often directly related to other ground parameters such as percent of ground cover, photosynthetic activity of the plant, surface water, leaf area index and the amount of biomass.
Constantini et al. (2012), integrated remote sensing change detection techniques and spatial analyses of NDVI values to detect forest disturbances in forested areas of two volcanic lake watersheds in Italy. The authors investigated the existence of a relationship between vegetation spatial heterogeneity and the occurrence of disturbance events.
The hipothesis of this study were: (1) Is it possible to detect deforestation analyzing the semivariogram metrics? (2) Which metric derived from the semivariogram is better to detect changes in landscape? (3) Which is the best model to construct the semivariograms?
Then, the aim of this paper was to analyze the potential of semivariograms generated from the NDVI values, derived from Landsat TM images, to detect changes in an area covered by Brazilian savannas vegetation.
MATERIAL AND METHODS
The study area is located in the northern state of Minas Gerais, Brazil and is covered by Brazilian savannas vegetation, totalizing 1,596 ha (Figure 1).
Landsat TM images from May 2010, June 2010 and July 2011 were, first, geometrically corrected into Universal Transverse Mercator (UTM) projection and, second, atmospherically corrected by means of the Dark Object Subtraction (DOS) procedure (Chavez, 1996) to generate the NDVI values (Figure 2).
A set of ten transects with 100 pixels long, totalizing 1,000 pixels, were systematically extracted from each NDVI image in order to do the exploratory analysis (box plot, histogram and trends). The first stage had the purpose of observing the general behavior of the data (shape, distribution, central tendency). This type of analysis, does not consider the structure of spatial dependence, but it is important for allowing the identification of outliers that exert some kind of influence in the geostatistical analyzes.
Semivariograms were constructed and three different models (exponential, spherical and gaussian) were fitted with ordinary least squares (OLS), using the geoR package (Ribeiro Junior; Diggle, 2001) in R (R Development Core Team, 2005), to analyze the behavior and shape, and the values of sill, nugget and range. Scaled semivariograms were also built for all fitted models in each year of analysis. This semivariogram is useful for viewing the spatial dependence structure among images from different dates.
According to Bussab and Moretin (2002), OLS is one of the most widely used statistics estimators. It is based on the principle of least squares, introduced by Gauss in 1809. The method obtains the values of the parameters of a model that minimizes the sum of the square of the difference between observed and estimated.
Figure 1: Study area.
Figure 2: NDVI images from 2010/05 (T0); 2010/06 (T1); 2011/07 (T2), respectively.
RESULTS AND DISCUSSION
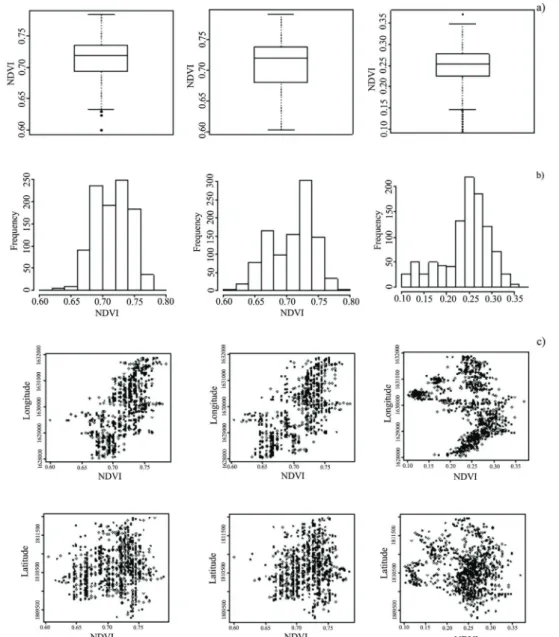
According to the boxplot, the NDVI values ranged from 0.6 and 0.8 for T0 and T1; and from 0.10 to 0.35 for T2 (Figure 3a). In this first exploratory analysis was possible to detect outliers values in T0 and T2, however, the values were not removed since they were not extreme and therefore did not affect the analysis.
Looking at the histogram (Figure 3b) it showed that the NDVI distribution did not deviate too severely from normality. Graphically, the distribution of the NDVI values in function of latitude and longitude (Figure 3c), showed what could be trends, however they did not affect the analysis.
The Spherical, Exponential and Gaussian models for T0, T1 and T2 are presented in figure 4. For the three models the semivariograms shapes were different for pre (T0 and T1) and post (T2) deforestation, but similar if the area has not changed (T0 and T1).
Figure 4 shows that the semivariograms range and sill changed after deforestation (T2), suggesting that semivariograms can be used as a tool to detect land cover change.
ACERBI JÚNIOR, F. W. et al.
106
Figure 3: Box plot (a), histogram (b) and trend analysis (c) for T0, T1 and T2.
According to Sertel, Kaya and Curran (2007), the semivariogram range can be used to quantify coarse spatial variability since it increases as a result of changes in the landscape use. Table 1 shows that the range increased after deforestation probably due to the mix of low NDVI values from bare soils (deforested areas) and high NDVI values from forested areas. For the Exponential model the difference was even greater than the Spherical and Gaussian models.
The nugget provides information about fine scale spatial variation, which means the variation within, rather than between, pixels (Sertel; Kaya; Curran, 2007). All
models presented very small values (Table 1), which indicate that the spatial resolution of 30 m was suitable to control the random variation in the data.
Figure 4: (a) Spherical model T0; (b) Spherical model T1; (c) Spherical model T2; (d) Exponential model T0; (e) Exponential model T1; (f) Exponential model T2; (g) Gaussian model T0; (h) Gaussian model T1; (i) Gaussian model T2.
Table 1: Semivariogram parameters.
Nugget Sill Range
Spherical model
T0 0.0001 0.0004 500.00
T1 0.0001 0.0007 500.00
T2 0.0001 0.0030 800.00
Exponential model
T0 0.0001 0.0004 599.14
T1 0.0001 0.0007 599.14
T2 0.0000 0.0050 2395.56
Gaussian model
T0 0.0001 0.0004 519.24
T1 0.0001 0.0007 519.24
ACERBI JÚNIOR, F. W. et al.
108
Most of the semivariograms in the geostatistical literature are bounded by a sill. In urban and agricultural landscapes semivariograms are often of man modified surfaces with a repetitive spatial pattern, and as a result this classic semivariogram is relatively unusual (Curran, 1988). In this case, the study area was covered by savanna vegetation, and the classic semivariograms occurred.
Bounded semivariograms occur wherever the variance of all observations remains constant throughout the sampled domain. Unbounded semivariograms are manifested when the variance of all observations within a domain is not constant (Nielsen; Wendroth, 2003).
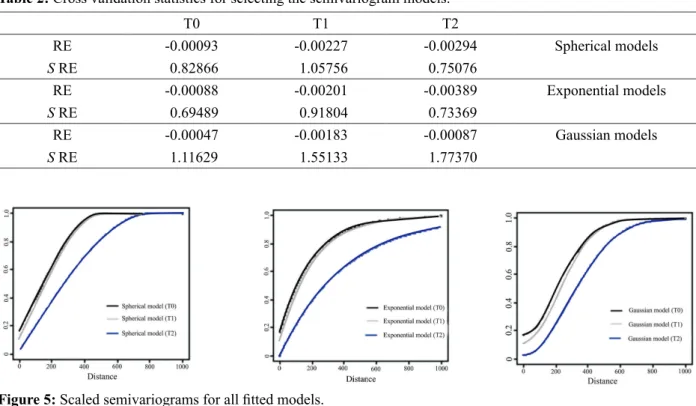
The scaled semivariogram is useful for comparing the structure of spatial dependence. In the present study was specifically used to check if the spatial structure has changed after deforestation. Analyzing the scaled semivariograms (Figure 5) that were built for all fitted models was possible to see the differences in the structure of spatial dependence after deforestation.
Constantini et al. (2012), obtained similar results after analyzing the relationship between the extent of temporal change and spatial heterogeneity of mixed forested areas in the watershed of two Italian volcanic lakes. Their results demonstrated a positive linear relationship between the total number of changed pixels
in the sampling areas during the three investigated periods and the semivariogram range detected on the respective starting NDVI images.
Sertel, Kaya and Curran (2007), analyzed the use of semivariograms to identify earthquake damage in an urban area in Turkey, and concluded that the semivariogram shape was different for pre and post-earthquake if the area was severely damaged, but similar if the area was not severely damaged. The areas of severe damage had even larger increases in range and sill whereas the areas of minor earthquake damage had similar ranges and sill before and after the earthquake.
CONCLUSIONS
This study had demonstrated the usefulness of semivariogram shape and metrics, generated from NDVI values, derived from Landsat TM images, to detect deforestation in an area covered by savanna vegetation. In deforested areas, the landscape change has caused spatial variations that were quantified by the semivariogram metrics of range, sill and shape.
The range and sill were the two most important and complementary metrics. Both metrics increased their values after deforestation (T2) and remain similar if the land cover had not been changed (T0 and T1).
Table 2: Cross validation statistics for selecting the semivariogram models.
T0 T1 T2
RE -0.00093 -0.00227 -0.00294 Spherical models
S RE 0.82866 1.05756 0.75076
RE -0.00088 -0.00201 -0.00389 Exponential models
S RE 0.69489 0.91804 0.73369
RE -0.00047 -0.00183 -0.00087 Gaussian models
S RE 1.11629 1.55133 1.77370
The model that best fitted the data was the Gaussian one, however, the three models were very similar, which made possible to detect changes in savanna vegetation using any one of them.
It is suggested that further researches should explore the degree to which the semivariogram can be used to quantify this spatial variability as well as to analyze the influence of sazonality for changing detection in vegetated areas.
REFERENCES
BUSSAB, W.O.; MORETTIN, P.A. Estatística básica. São Paulo: Saraiva, 2002. 526p.
CHAVEZ, P. S. Image-based atmospheric corrections – revised and improved. Photogrammetry Engineering & Remote Sensing. 62:1025-1036, 1996.
CONSTANTINI, M.L. et al. NDVI spatial pattern and the potential fragility of mixed forested areas in volcanic lake watersheds. Forest Ecology and Management. 285:133-141, 2012.
CRESSIE, N.A.C. Statistics for Spatial Data, Revised Edition. John Wiley & Sons, New York, 928p. 1993.
CURRAN, P.J. The semivariogram in remote sensing: An introduction. Remote Sensing of Environment. 24(3):493-507, 1988.
LÉVESQUE, J.; KING, D.J. Airborne digital camera image semivariance for evaluation of forest structural damage at an acid mine site. Remote Sensing of Environment. 68(2):112-124, 1999.
MCBRATNEY, A.B.; WEBSTER, R. Choosing functions for semi-variograms of soil properties and fitting them to sampling estimates. Journal of Soil Science. 37(4):617-639, 1986.
MELLO, J. M. et al. Estudo da dependência espacial de características dendrométricas para Eucalyptus grandis. Cerne. 11(2):113-126, 2005.
NIELSEN, D.R.; WENDROTH, O. Spatial and
temporal statistics: sampling field soils and their
vegetation.Reiskirchen: Catena Verlag, 2003. 398p. R DEVELOPMENT CORE TEAM R: A language and environment for statistical computing. R Foundation for Statistical Computing, Vienna, 2005. Disponível em: <http://www.R-project.org/>. Data do ultimo acesso: 22 de outubro de 2014.
RIBEIRO JUNIOR, P.J.; DIGGLE, P.J. GeoR: a package for geoestatistical analysis. R. News. 1(2):15-18, 2001. ROUSE, J. W. et al. Monitoring the vernal
advancements and retrogradation (greenwave effect) of natural vegetation. NASA/GSFC, Type III, Final Report, Greenbelt.MD., p.1-371, 1974.
SERTEL, E.; KAYA, S.; CURRAN, P.J. Use of semivariograms to identify earthquake damage in an urban area. IEEE Transactions on Geoscience and Remote Sensing. 45(6):1590-1594, 2007.