2017 | Lavras | Editora UFLA | www.editora.ufla.br | www.scielo.br/cagro http://dx.doi.org/10.1590/1413-70542017415009817
Object-based change detection using semivariogram indices derived
from NDVI images: The environmental disaster in Mariana, Brazil
Detecção de mudanças baseada em objetos utilizando indices do semivariograma derivados de imagens NDVI: O disastre ambiental em Mariana, Brasil
Eduarda Martiniano de Oliveira Silveira1*, Fausto Weimar Acerbi Júnior1,
José Márcio de Mello1, Inácio Thomaz Bueno1
1Universidade Federal de Lavras/UFLA, Departamento de Ciências Florestais/DCF, Lavras, MG, Brasil *Corresponding author: dudalavras@hotmail.com
Received in April 4, 2017 and approved in July 5, 2017
ABSTRACT
Object-based change detection is a powerful analysis tool for remote sensing data, but few studies consider the potential of temporal semivariogram indices for mapping land-cover changes using object-based approaches. In this study, we explored and evaluated the performance of semivariogram indices calculated from remote sensing imagery, using the Normalized Differential Vegetation Index (NDVI) to detect changes in spatial features related to land cover caused by a disastrous 2015 dam failure in Brazil’s Mariana district. We calculated the NDVI from Landsat 8 images acquired before and after the disaster, then created objects by multiresolution segmentation analysis based on post-disaster images. Experimental semivariograms were computed within the image objects and semivariogram indices were calculated and selected by principal component analysis. We used the selected indices as input data to a support vector machine algorithm for classifying change and no-change classes. The selected semivariogram indices showed their effectiveness as input data for object-based change detection analysis, producing highly accurate maps of areas affected by post-dam-failure flooding in the region. This approach can be used in many other contexts for rapid and accurate assessment of such land-cover changes.
Index terms: Remote sensing; geostatistics; feature extraction.
RESUMO
Recentemente, variáveis geoestatísticas derivadas de imagens de sensoriamento remoto ganharam espaço dentre os procedimentos de detecção de mudanças, porém, o potencial temporal destas variáveis para o mapeamento das mudanças baseado na análise por objetos ainda é pouco estudado. Neste estudo, o desempenho de um conjunto de índices calculados de semivariogramas derivados de imagens NDVI bitemporais para detectar mudanças na cobertura do solo foi analisado e avaliado. O município de Mariana foi selecionado para teste e validação da metodologia devido ao grande impacto ocasionado pelo desastre. O processo iniciou-se com a aquisição de imagens Landsat 8 antes e após o desastre e o cálculo do NDVI. Os objetos foram criados através da segmentação em multiresolução baseada na imagem pós-desastre. Os semivariogramas experimentais foram gerados dentro de cada objeto e os índices foram extraídos e selecionados através da análise de componentes principais. Os índices selecionados foram utilizados como dados de entrada para o algoritmo support vector machines para a classificação de áreas de mudança e não mudança. Os índices selecionados se mostraram efetivos para a detecção de mudanças, indicando a possibilidade de utilização para a detecção de mudanças baseada em objetos, resultando em um mapa precisos das áreas inundadas afetadas pelo desastre. Esta abordagem pode ser usada em muitos outros contextos para uma avaliação rápida e precisa de tais mudanças na cobertura do solo.
Termos para indexação: Sensoriamento remoto; geostatistica; extração de atributos.
INTRODUCTION
The collapse of a mining dam in the Brazilian state of Minas Gerais on November 5th 2015, considered one of
the biggest environmental disasters in the country’s history, resulted in the destruction of whole communities by a river of mud and mining waste. This calamity affected the Gualaxo River, a tributary to the Carmo River and ultimately the Doce
River, waterways that supply water to a significant number of municipalities. The flood affected 600 kilometers of riverbed
and destroyed human and animal lives as well as several
land-cover classes (such as grasslands, urban areas, and native vegetation), including in permanent preservation areas. The full
extent of the environmental impacts is yet unknown, and the changes within the affected area have yet to be fully quantified.
Remote sensing techniques are effective in capturing the structure, rates, and changes of land cover. They can supply essential information concerning the ecological status of a region, including changes that modify plant phenological
Difference Vegetation Index (NDVI) is an important approach to the analysis of land-cover structure analysis and its
temporal modifications (Griffith et al., 2007). According to Costantini et al. (2012) and Garrigues et al. (2006), NDVI
images are the most robust variable used to describe the spatial and temporal heterogeneity of a landscape’s biosphere. In addition, these data can be treated as regionalized variables once the information contained in a pixel is highly correlated
with the information contained in neighboring pixels (Acerbi
Junior et al., 2015; Curran, 1988).
Studies of environmental disasters have emphasized the importance of damage determination to assist environmental management programs and stressed the use of remote sensing images and geostatistical techniques as central tools for this
kind of analytical approach (Sertel; Kaya; Curran, 2007).
Combining remote sensing information with GIS techniques and geospatial databases can increase the accuracy and reduce
the processing time of change detection and classification procedures (Berberoglu et al., 2000; Berberoglu; Akin 2009;
Garcia-Pedrero et al., 2015).
For example, semivariograms are an analytical technique used to assess the relationship and variance between points based on distance and a given variable. These have been used as measures of texture (Curran 1988;
Woodcock; Strahler; Jupp et al., 1988), for improved image classification (Balaguer et al., 2010; Balaguer-Beser et al., 2011; Wu et al., 2015 Yue et al., 2013; Powers et al., 2015),
and more recently, in change detection studies (Costantini
et al., 2012; Sertel et al., 2007; Gil-Yepes et al., 2016). Acerbi Junior et al. (2015) demonstrated the potential of
semivariogram parameters (derived from bitemporal NDVI images) to detect changes in Brazilian savanna vegetation, showing that these parameters increased on deforested areas
and remained constant in regions where the land cover had not changed.
In recent years, semivariograms have also contributed
to object-based image analysis (OBIA) (Meer, 2012). Powers et al. (2015) used semivariogram features and OBIA for
classification of industrial disturbances in forest areas. Balaguer et al. (2010) achieved high-accuracy measurements by combining semivariogram features and spectral
information in land cover mapping. Gil-Yepes et al. (2016)
proposed and evaluated a set of new temporal geostatistical features for object-based change detection (OBCD) analysis within agricultural plots at two different dates, showing that the new set of cross-semivariogram and codispersion features provided high global accuracy measures when compared to the use of only spectral information.
Textural features have proven to be more effective than spectral bands alone for change detection (Chen et al., 2012; Wu et al., 2000). However, few studies have explored the potential of temporal semivariogram features for mapping land cover changes using the OBCD approach. We hypothesized that landscape changes could be accurately detected using only semivariograms calculated from NDVI images and so we explored and evaluated the performance of semivariogram indices in an object-based approach to detecting land-cover changes caused by the 2015 dam-collapse disaster in Brazil.
MATERIAL AND METHODS
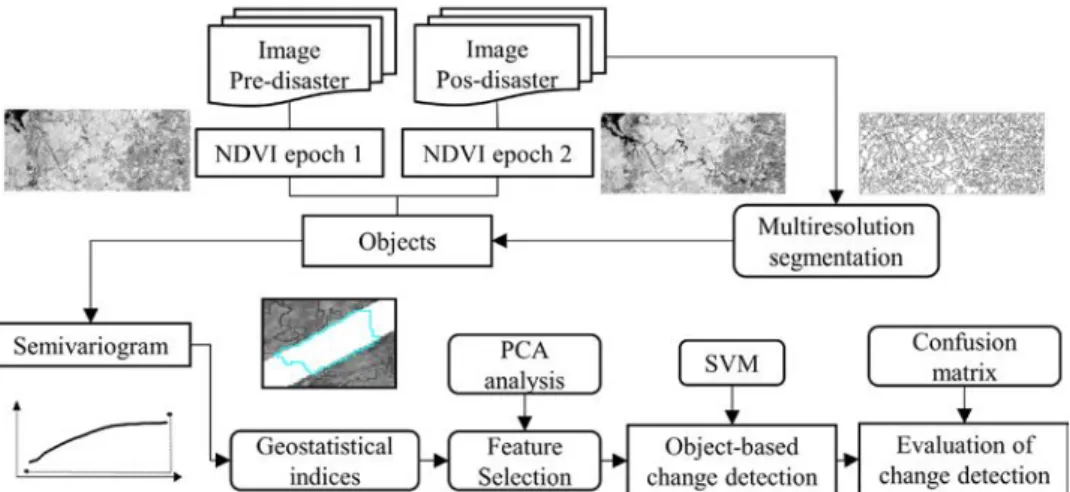
We derived the NDVI from Landsat 8 images for use in an object-based change detection approach to analyzing
land-cover changes in the afflicted area, using the following
methodology (graphically summarized in Figure 1):
(1) Image acquisition and NDVI transformation
(2) Object delimitation by multiresolution algorithm based on the post-disaster image
(3) Experimental semivariogram computed within the objects
(4) Generation of semivariogram indices, as proposed by Balaguer et al. (2010)
(5) Selection of the most important semivariogram indices
by PCA analysis
(6) Change detection using the Support Vector Machine
(SVM) algorithm
(7) Evaluation by the confusion matrix and its accuracy
measures
Study area and data
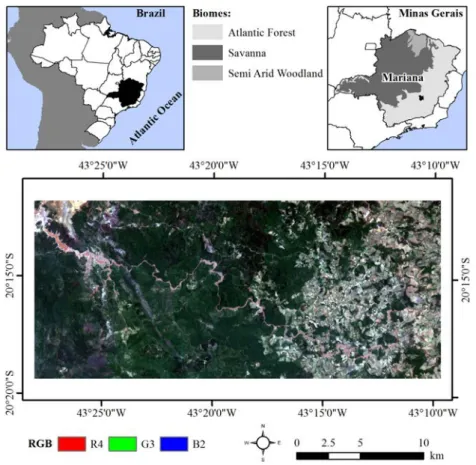
The district of Mariana is located in the central
region of Minas Gerais state, Brazil, between the 43º 05’ 00” and 43º 30’ 00” meridians and the 20º 08’ 00” and 20º 35’ 00” parallels (Figure 2). The district includes the
upper portion of the Doce River basin and is characterized by hilly relief and abundant tablelands. The climatic conditions are typical of humid tropical highlands, with
hot and rainy summers. The vegetation is predominantly
composed of Atlantic Forest and Savanna biomes.
We acquired Landsat 8 satellite images from the
United States Geological Survey for Earth Observation and Science (USGS/EROS) from October 2015
(pre-disaster) and November 2015 (post-(pre-disaster), at the
processing level of Landsat Surface Reflectance, with the appropriate geometrical corrections and reflectance
values to the soil level. We then generated the NDVI
(Equation 1), which is based on quotients and uses the
spectral bands from the red and near-infrared bands to enhance vegetative characteristics and minimize the effects of shadows caused by the terrain’s topography (Berra et al., 2012; Vorovencii, 2014). The values of this index vary from -1 to 1, calculated as:
Figure 2: Study area location within Minas Gerais state, Brazil.
(1) ρNIR-ρRED
NDVI=
ρNIR+ρRED
where ρNIR and ρRED are the reflectance values for the
Image segmentation
In the object-based change detection method,
pixels are not individually classified but rather combined into homogenous groups (objects) and classified together (Chen et al., 2012; Desclée; Bogaert; Defourny 2006; Hussain et al., 2013). The object is characterized using
a large number of descriptive features derived from the images and becomes the basic unit of analysis. In comparison with pixel-based methods, additional spatial and contextual information can be obtained from the
objects (Blaschke 2010; Hussain et al., 2013; Ruiz et al.,
2011; Wu et al., 2015).
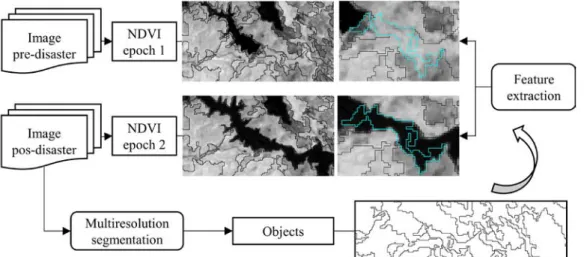
Object-based semivariogram analysis is based on the delimitation of homogeneous groups, in which the
objects’ boundaries are pre-defined and the semivariogram
features are extracted from each object. Multiresolution segmentation is a basic procedure in the eCognition software employed in this study; we used a multiresolution segmentation algorithm (Baatz; Schäpe, 2000) to generate objects based on the post-disaster NDVI image. The size, shape, and spectral variation of each object are controlled
by three key segmentation parameters: shape, compactness,
and scale. The shape parameter was set to 0.1 and the compactness to 0.5. The most critical step is the selection of the scale parameter, which controls the size of the image objects. This sets a threshold of homogeneity determining how many neighboring pixels can be merged together to form an image object (Mui et al., 2015). We tested values from 80 to 200 for this parameter and obtained the best
segmentation result using the value 150. Figure 3 shows
the image segmentation procedure.
Figure 3: Image segmentation procedure for feature extraction.
Experimental semivariogram
For continuous variables, such as the NDVI, the
experimental semivariogram is defined as half of the
average squared difference between values separated by a given lag, where this lag is a vector in both distance and
direction (Atkinson; Lewis, 2000). The semivariance is defined from the spatial variance of measures performed
in samples from a determined distance “h”, being the sum of the squares’ difference between the sampled values separated by a distance “h”, divided by two times the number of possible pairs on each distance. This was
estimated using Equation 2:
(2)
N h
2 i=11
γ h = Z x -Z x+h 2N h
where N(h) is the number of pairs of points separated by the distance h, Z(x) is the value of the regionalized variable in the point x, and Z(x+h) is the value of the point (x+h).
The semivariogram is the graphic representation of the spatial variance versus distance h, which allows an estimate of the variance value for different combinations of pairs of points. The semivariance functions are
characterized by three parameters: sill (σ²), range (φ), and nugget effect (τ²). The sill parameter is the plateau
combination of sampling errors and variations that happen in scales smaller than the distance between the sampled points (Curran, 1988).
Since we wanted to characterize the NDVI spatial variability to obtain maximum detail, we used a one-pixel interval between two lags (the distance between pairs of points in the semivariogram calculation), so the
lag size was equivalent to the pixel size (30 m). After some experimentation to find an appropriate optimal lag distance, we fixed the number of lags at 20 pixels (resulting in a lag distance of 600 m) to ensure that sill values would provide a concise description of data variability. According to Woodcock, Strahler and Jupp (1988), the size of the samples needs to be larger than the range of influence to
characterize the initial part of the semivariogram and large enough to reveal the presence of periodicity.
Set of semivariogram indices
The set of semivariogram indices we used was described by Balaguer et al. (2010) based on the points
defining the experimental semivariogram. These indices
describe the shape of the experimental semivariograms and therefore the properties that characterize the spatial patterns of the image object (Table 1); they have been categorized
according to the position of the lags used in their definition (near the origin and up to the first maximum). The devised
feature groups provide information such as the change ratio, slope, concavity, and convexity (curvature) level of the images and data variability.
The semivariogram texture description is
traditionally achieved by fitting a mathematical function
(i.e. exponential model, gaussian model and spherical
Group Description Formula
a variance and the semivariance at first lag1. Ratio between the values of the total RVF=Varianceγ1
2. Ratio between semivariance values at
second and first lag RSF=
γ2 γ1
3. First derivative near the origin FDO=γ2- γ1
h
4. Second Derivative at third lag SDT=γ4- 2γ3+ γ2 h2
b 5. First maximum lag value FML=hmax_1
6. Mean of the semivariogram values up to the
first maximum MFM=
1 Max_1∑γi
7. Variance of the semivariogram values up to
the first maximum VFM=
1
Max_1∑(γi-γ)² 8. Ratio between the semivariance at first
local maximum and the mean semivariogram values up to this maximum
RMM=γγMax_1
Max_1 Mean
9. Difference between the mean of the semivariogram values up to the first maximum
(MFM) and the semivariance at first lag DMF=MFM- γi 10. Second-order difference between first lag
and first maximum SDF=γMax_1-2γMax_12 + γ2
11. Semivariance curvature AFM=h
2(γ1+2( ∑ γ1
max_1-1
i=2
)+γmax_1)-(γ1(hmax_1-h1))
Table 1: Semivariogram indices described by Balaguer et al. (2010).
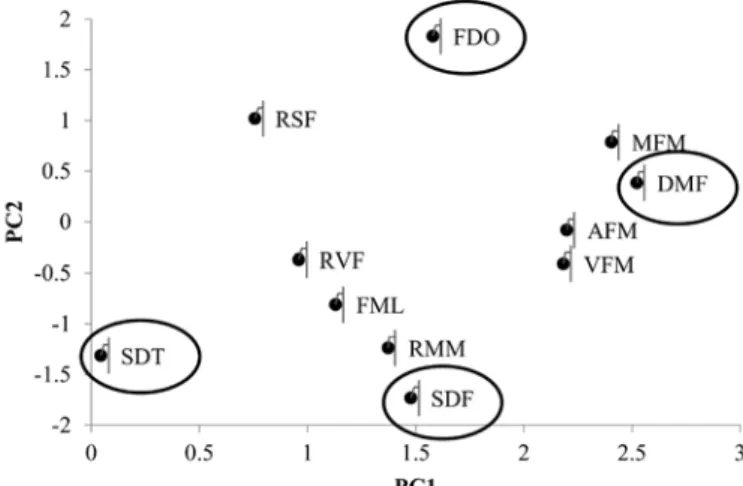
Figure 4: Projection of proposed indices in principal component planes (PC1-PC2).
model) whose parameters (such as sill and range) are
adopted as texture measures (Chen; Gong, 2004; Woodcock;
Strahler; Jupp, 1988). This method often suffers from the selection of a proper function because simple functions
are not sufficiently distinguishable and complex ones may be subject to overfitting (Chica-Olmo; Abarca-Hernández,
2000). The semivariogram indices are free of the problems caused by modeling the experimental semivariogram and thus have become more popular for describing the spatial properties of remote sensing images (Wu et al., 2015).
Feature extraction
We focused on two classes in this study: (1) no-change objects consisting of areas with the same cover in both images and (2) change objects consisting of areas
affected by flooding from the dam failure. A data set of
200 objects (with 100 objects per class) was sampled with 50% of the samples randomly chosen as training samples and the rest used as evaluation samples. Within the objects, the semivariogram indices were extracted in both images
using FETEX 2.0 software (Ruiz et al., 2011), a feature
extraction tool for object-based image analysis.
Due to the high number of indices, some of the information they provide may overlap with others, and so
are probably redundant in terms of efficiently describing
the objects. Thus we employed principal component
analysis (PCA) in order to group and interpret the
redundancies in the information provided by the analyzed semivariogram indices. By choosing the variables with
higher impact on the first two principal components,
we were able to reduce the number of variables, avoid
redundant variables (multicollinearity), and make further analyses more efficient.
Change detection and evaluation
In order to detect changes in the images, we chose to use a support vector machine (SVM) algorithm. Consisting of a group of theoretically superior machine learning algorithms, this approach is especially advantageous in the presence of heterogeneous classes for which only a few training samples are available (Wu et al., 2015).
SVMs operate by assuming that each set of inputs will have a unique relation to the response variable, and that the grouping and relation of these predictors to one
another is sufficient to identify rules that can be used to
predict the response variable from new input sets. To do this, SVMs project the input space data into a feature space with a much larger dimension, enabling linearly non-separable data to become non-separable in the feature space. For example, this method has been successfully used in
forestry classification problems (García-Gutiérrez et al.,
2015; Wu et al., 2015). We used the Gaussian or radial
basis function (RBF) as the Kernel function and performed
change detection evaluation using a confusion matrix (Congalton, 1991) and its accuracy measures, validating the results with a manually-produced map.
RESULTS AND DISCUSSION
Semivariogram indices selection
By computing the PCA over the complete set of
semivariogram features, we concentrated most of the data’s
variability in the first components; the resulting visualization
of the data allows for a better understanding of redundancies (Figure 4). The proportion of variability explained by PC1
Group Indices PC1 PC2 PC3 PC4 PC5 PC6
a
RVF 1.454 0.13854 0.901146 -0.2345 -0.3515 -1.00135 RSF 1.0986 0.23884 1.362471 1.4613 -0.6134 -0.15828 FDO 1.8309 0.62721 0.007942 1.1657 0.4686 0.13167 SDT 0.3528 -0.96958 -1.34043 0.9214 0.5261 -1.53648 FML 1.1018 -0.90885 0.473809 -1.4019 -0.373 -0.69289
b
MFM 2.4106 0.35916 -0.2202 0.1055 0.4289 0.26043 VFM 2.107 -0.25231 -0.82415 -0.1135 0.1696 0.65377 DMF 2.454 0.23071 -0.28063 -0.2093 0.1089 0.17493 RMM 0.9161 -1.81738 1.014275 0.3209 -0.3654 0.32876 SDF -0.1225 -2.23006 -0.35766 0.3997 0.0717 0.63366 AFM 2.2536 0.07501 -0.28063 -0.8878 -0.1421 0.01068
a=Indices that provide semivariogram information near the origin; b=Indices that provide semivariogram information at first maxima. Table 2: PCA eigenvalues.
As a result of PCA analysis for the group of indices
that provide information near the origin, we removed RVF and RSF and included FDO and SDT as input data for the
change detection analysis. After analyzing the indices that provided information up to the first maxima, we also removed AFM, VFM, FML and RMM and included DMF
and SDF as further input data. We selected the variables
that presented higher values in module in the first two
components (Table 2).
Exploring the semivariogram indices
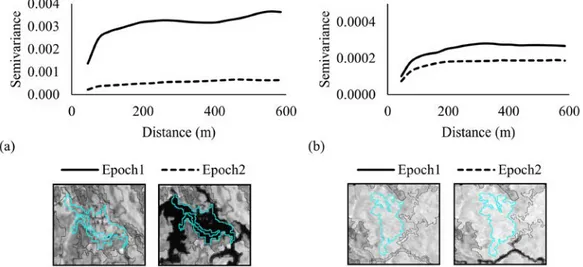
We analyzed the semivariogram curves considering both the change (Figure 5a) and no-change (Figure 5b)
classes. In the former, the image’s spatial variability changed considerably from native vegetation
(pre-disaster image) to flooded areas (post-(pre-disaster image). The flooded areas had a low overall variability due to the
homogeneity of NDVI pixels with low internal variation. The high relative variability of native vegetation is explained by the presence of high and low NDVI values in the same object. In contrast, the semivariogram curves for the no-change objects presented similar values.
The pre-selected semivariogram indices decreased (FDO and DMF) or increased (SDT and SDF) considerably
in the presence of changes (Figure 6a) and remained almost constant in the absence of changes (Figure 6b).
Figure 6: Values of pre-selected semivariogram indices from image epoch 1 and image epoch 2 for: (a) change
objects; (b) no-change objects.
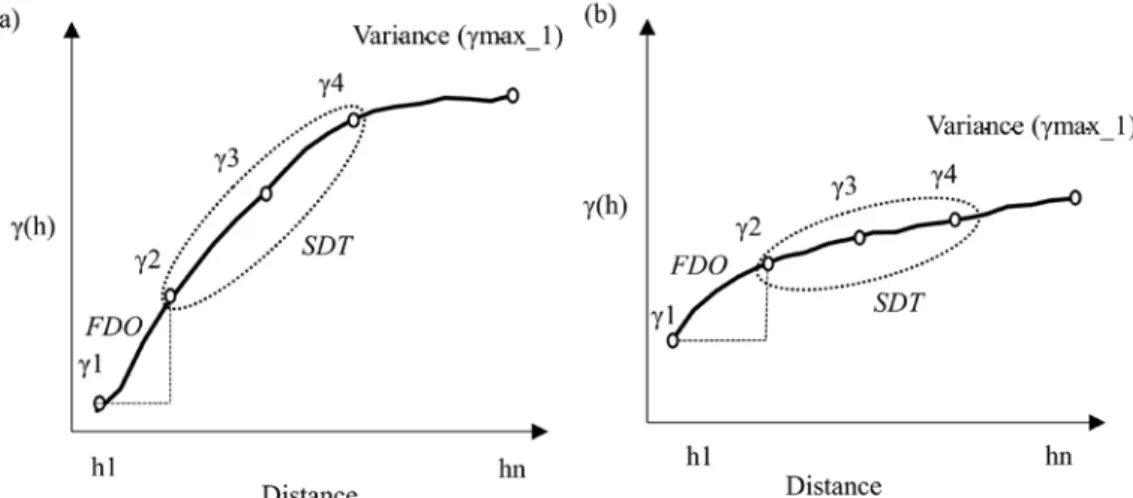
Figure 7: Semivariogram representation of the total data variance for the FDO and SDT indices: (a) heterogeneous
objects, and (b) homogeneous objects.
FDO is the first derivate near the origin and
represents the slope of the semivariogram at the first two
lags; it shows the variability changes of the data at short distances. FDO presented high values for heterogeneous
objects (Figure 7a) and low values for homogeneous objects (Figure 7b). SDT is the second derivative at
the third lag. This index approximates the value of the second derivative of the semivariogram at the third
lag. It quantifies the concavity or convexity level of the
semivariogram at short distances, corresponding with the heterogeneity of the objects in the image. Negative values indicate that the semivariogram is convex and thus that the image is heterogeneous at short distances. SDT presented
high negative values for change objects (Figure 7a) and low negative values for no-change objects (Figure 7b).
DMF is the difference between the mean of the
semivariogram values up to the first maximum (MFM) and the semivariance at the first lag (difference mean of semivariogram and first lag semivariance). This index
shows the decreasing rate of the spatial correlation in the image up to the lags where the semivariogram theoretically tends to be stabilized. The results showed a high variation of DMF values for change objects and a relatively low variation of DMF values for no-change objects. SDF is the second-order difference between the
first lag and first maximum. This parameter provides
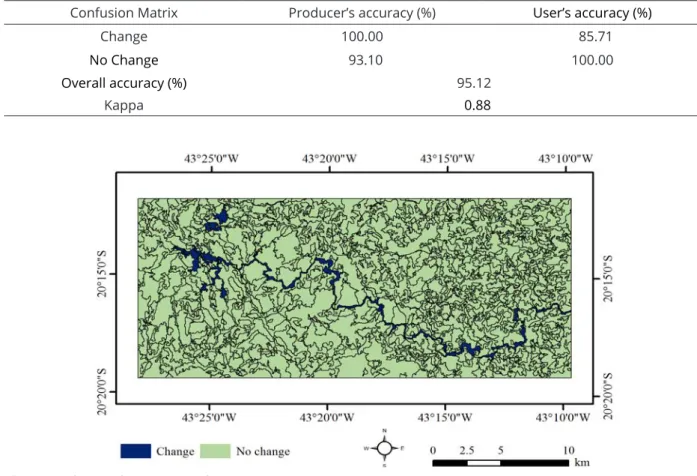
Confusion Matrix Producer’s accuracy (%) User’s accuracy (%)
Change 100.00 85.71
No Change 93.10 100.00
Overall accuracy (%) 95.12
Kappa 0.88
Figure 8: Change detection results.
Table 3: Confusion matrix of the support vector machines classification. Change detection assessment
The classification accuracy measures, using the
selected semivariogram indices as input for the SVM
algorithm, are shown in Table 3. The semivariogram indices showed their effectiveness in the classification
of change and no-change classes, presenting an overall accuracy of 95.12% and producer’s and user’s accuracies higher than 85%. Figure 8 shows the change detection map (producer’s accuracy = 100%); all objects
classified as no-change in the map are correct (user’s
accuracy = 100%). However, according to the validation
data set, there are still some misclassification problems with 14.29% of the objects classified erroneously as change (user’s accuracy = 85.71%) and the omission of 6.9% of change-class objects in the map.
I n s u m m a r y, t h e s e m i v a r i o g r a m i n d i c e s synthesized the most relevant information about the shape of the semivariogram (slope) in a few features. They identified the singular points (maxima) and
enhanced the information contained in the first lags,
where spatial correlation at short distances is higher.
These indices also have a specific meaning, allowing
CONCLUSIONS
In this study, we used spatial context to detect land cover changes resulting from a Brazilian dam failure using an object-based approach. We explored and investigated the potential of semivariogram indices as inputs for training the support vector machines algorithm for change detection. Our results indicate that landscape changes can be accurately detected using only textural features calculated from semivariograms derived from NDVI images. The semivariogram indices
selected by PCA analysis showed their effectiveness in the classification results, presenting high accuracy
values. Using semivariograms as the main geostatistical tool to describe spatial variability standards in data means that indices derived from NDVI variability have the potential to discriminate between homogeneous and heterogeneous classes within objects. This approach can be used in many other contexts for rapid and accurate assessment of such land-cover changes. Further research should explore the use of geostatistical features to characterize the degree of changes as well as the impact of the initial land cover class and the image segmentation epoch on the analysis results. Other
studies could analyze the influence of seasonality on
change detection in vegetated areas.
ACKNOWLEDGEMENTS
The authors are grateful to the Coordenação de
Aperfeiçoamento de Pessoal de Nível Superior (CAPES), the Fundação de Amparo à Pesquisa do Estado de Minas Gerais (FAPEMIG), and the Departamento de Ciências Florestais da Universidade Federal de Lavras (UFLA) for supporting this work.
REFERENCES
ACERBI JUNIOR, F. W. et al. Change detection in Brazilian savannas using semivariograms derived from NDVI images.
Ciencia e Agrotecnologia, 39(2):103-109, 2015.
ATKINSON, P. M.; LEWIS, P. Geostatistical classification for remote sensing: An introduction. Computers & Geosciences, 26(4):361-371, 2000.
BAATZ, M.; SCHÄPE, A. Multiresolution segmentation: An optimization approach for high quality multi-scale image segmentation. ISPRS Journal of Photogrammetry and Remote Sensing, 58(3-4):12-23, 2000.
BALAGUER, A. et al. Definition of a comprehensive set of texture semivariogram features and their evaluation for object-oriented image classification. Computers and Geosciences, 36(2):231-240, 2010.
BALAGUER-BESER, A. et al. Semivariogram calculation optimization for object-oriented image classification. Modelling in Science Education and Learning, 4(7):91-104, 2011.
BERBEROGLU, S. et al. The integration of spectral and textural information using neural networks for land cover mapping in the Mediterranean. Computers and Geosciences, 26(4):385-396, 2000.
BERBEROGLU, S.; AKIN, A. Assessing different remote sensing techniques to detect land use/cover changes in the eastern Mediterranean. International Journal of Applied Earth Observation and Geoinformation, 11(1):46-53, 2009.
BERRA, E. F. et al. Estimativa do volume total de madeira em espécies de eucalipto a partir de imagens de satélite landsat. Ciencia Florestal, 22(4):853-864, 2012.
BLASCHKE, T. Object based image analysis for remote sensing.
ISPRS Journal of Photogrammetry and Remote Sensing, 65(1):2-16, 2010.
CHEN, G. et al. Object-based Change Detection. International Journal of Remote Sensing, 33(14):4434-4457, 2012.
CHEN, Q.; GONG, P. Automatic variogram parameter extraction for textural classification of the panchromatic IKONOS Imagery. IEEE Transactionsn on Geoscience and Remote Sensing, 42(5):1106-1115, 2004.
CHICA-OLMO, M.; ABARCA-HERNÁNDEZ, F. Computing geostatistical image texture for remotely sensed data classification. Computers & Geosciences, 26(4):373-383,
2000.
CONGALTON, R. G. A review of assessing the accuracy of classifications of remotely sensed data. Remote Sensing of Environment, 37(1):35-46, 1991.
COSTANTINI, M. L. et al. NDVI spatial pattern and the potential fragility of mixed forested areas in volcanic lake watersheds.
Forest Ecology and Management, 285:133-141, 2012.
CURRAN, P. J. The semivariogram in remote sensing: An introduction. Remote Sensing of Environment,
24(3):493-507, 1988.
GARCÍA-GUTIÉRREZ, J. et al. An evolutionary-weighted majority voting and support vector machines applied to contextual classification of LiDAR and imagery data fusion.
Neurocomputing, 163:17-24, 2015.
GARCIA-PEDRERO, A. et al. A GEOBIA methodology for fragmented agricultural landscapes. Remote Sensing, 7(1):767-787, 2015.
GARRIGUES, S. et al. Quantifying spatial heterogeneity at the landscape scale using variogram models. Remote Sensing of Environment, 103(1):81-96, 2006.
GIL-YEPES, J. L. et al. Description and validation of a new set of object-based temporal geostatistical features for land-use/land-cover change detection. ISPRS Journal of Photogrammetry and Remote Sensing, 121:77-91, 2016.
GRIFFITH, J. A. et al. Preliminary comparison of landscape pattern-normalized difference vegetation index (NDVI) relationships to Central Plains stream conditions. Journal of Environmental Quality, 31(3):846-859, 2002.
GRIFFITH, J. A. Interrelationships among landscapes, NDVI, and stream water quality in the U. S. Central Plains. Ecological Applications, 12(6):1702-1718, 2007.
HUSSAIN, M. et al. Change detection from remotely sensed images: From pixel-based to object-based approaches.
ISPRS Journal of Photogrammetry and Remote Sensing, 80:91-106, 2013.
MEER, F. VAN DER. Remote-sensing image analysis and geostatistics. International Journal of Remote Sensing, 33(18):5644-5676, 2012.
MUI, A.; HE, Y.; WENG, Q. An object-based approach to delineate wetlands across landscapes of varied disturbance with high spatial resolution satellite imagery. ISPRS Journal of Photogrammetry and Remote Sensing, 109:30-46, 2015.
MUNROE, D. K.; SOUTHWORTH, J.; TUCKER, C. M. The dynamics of land-cover change in western Honduras: Exploring spatial and temporal complexity. Agricultural Economics, 27(3):355-369, 2002.
POWERS, R. P. et al. Remote sensing and object-based techniques for mapping fine-scale industrial disturbances.
International Journal of Applied Earth Observation and Geoinformation, 34(1):51-57, 2015.
RUIZ, L. A. et al. A feature extraction software tool for agricultural object-based image analysis. Computers and Electronics in Agriculture, 76(2):284-296, 2011.
SERTEL, E.; KAYA, S.; CURRAN, P. J. Use of semivariograms to identify earthquake damage in an urban area. IEEE Transactions on Geoscience and Remote Sensing, 45(6):1590-1594, 2007.
TUCKER, C. M. et al. Comparative spatial analyses of forest conservation and change in Honduras and Guatemala.
Conservation and Society, 3(1):174-200, 2005.
VOROVENCII, I. Assessment of some remote sensing techniques used to detect land use/land cover changes in South-East Transilvania, Romania. Environmental Monitoring and Assessment, 186(5):2685-2699, 2014.
WOODCOCK, C. E.; STRAHLER, A. H.; JUPP, D. L. B. The use of variograms in remote sensing: I. Scene models and simulated images. Remote Sensing of Environment, 25(3):323-348, 1988.
WU, X. et al. Evaluation of semivariogram features for object-based image classification. Geo-spatial Information Science, 18(4):159-170, 2015.