2016 | Lavras | Editora UFLA | www.editora.ufla.br | www.scielo.br/cagro http://dx.doi.org/10.1590/1413-70542016403001716
Contact pressures and the impact of farm equipment
on Latosol with the presence and absence of sugarcane straw
Pressões de contato e o impacto de conjuntos motomecanizados em Latossolo com presença e ausência de palhada de cana-de-açúcar
Reginaldo Barboza da Silva1, Piero Iori1*, Zigomar Menezes de Souza2, Danilo de Moraes Gomes Pereira1, Oswaldo Julio Vischi Filho2, Francisca Alcivania de Melo Silva1
1Universidade Estadual Paulista “Júlio de Mesquita Filho”/UNESP, Registro, SP, Brazil
2Universidade Estadual de Campinas/UNICAMP, Departamento de Água e Solo, Campinas, SP, Brazil *Corresponding author: [email protected]
Received in january 13, 2016 and approved in april 4, 2016
ABSTRACT
High contact pressures applied to soil result in a greater degree of compaction, in addition to promoting other negative effects. The objective of this study was to quantify contact areas by using different methodologies, and pressures of farm equipment employed in production activity and evaluate structural changes caused in a Red Latosol with the presence and absence of straw cover. The design was completely
randomized in a factorial scheme of type 4 (tire on front axle, tire on rear axle, tire on a sugarcane wagon and metallic track of sugar cane
Harvester) x 2 (presence and absence of straw). The contact area (CA) of the run was obtained by three procedures: analytical measure
of the area of an ellipse (CA1); digital measurement of area of an ellipse (CA2); and measurement of real contact area (RCA), with digital
resources. The contact pressure was calculated from the ratio of mass of each machine’s axle and the contact area of the run. The contact area obtained according to the procedure of the ellipse (CA1 and CA2) is overrated when compared to actual area obtained digitally (RCA). The straw reduces the contact pressure in the soil, due to the deep tire treads and consequently, increased contact area. Areas where the traffic of the machines occurred with soil covered with the presence of straw showed reduced soil resistance to penetration, cone index and pre-consolidation pressure, confirming that the increased contact area produced by straw reduced the pressure applied and the
compression power dissipated in the soil.
Index terms: Farming traction tire; farming trailer tire; metal track; wheel soil interaction.
RESUMO
Altas pressões de contato aplicadas ao solo resultam em um maior grau de compactação deste, além de promover outros efeitos
maléficos. O objetivo deste estudo foi quantificar as áreas e pressões de contato de conjuntos motomecanizados empregados na atividade sucroalcooleira e avaliar as alterações estruturais proporcionadas em um Latossolo Vermelho com e sem cobertura de resíduos vegetais (palha). O delineamento empregado foi o inteiramente casualizado em esquema fatorial do tipo 4 (pneu acoplado no eixo dianteiro, pneu acoplado no eixo traseiro, pneu acoplado a um transbordo agrícola canavieiro e esteira metálica de colhedora de cana de açúcar) x 2 (com e sem palha na superfície). A área de contato (CA) dos rodados foi obtida por três procedimentos: medida analítica da área de uma elipse (CA1); medida digital da área de uma elipse (CA2); e medida da área de contato real (RCA), com recursos digitais. A pressão de contato foi calculada a partir da relação da massa dos eixos de cada conjunto motomecanizado e a respectiva área de contato do rodado. A área de contato obtida de acordo com o procedimento da elipse (CA1 e CA2) é superestimada quando comparada área real, obtida digitalmente (RCA). Os resíduos vegetais diminuem a pressão de contato na interface rodado-solo, devido ao maior aprofundamento das garras do rodado e por consequência, aumento da área de contato. Áreas onde o tráfego das máquinas ocorreu com solo coberto de palha apresentaram menor resistência do solo à penetração, índice de cone e pressão de pré-consolidação, confirmando que o aumento da área de contato produzida pela palha reduziu a pressão aplicada e dissipou a energia de compactação no solo.
Termos para indexação: Esteira; interação rodado solo; pneu acoplado ao trator; pneu de transbordo agrícola.
INTRODUCTION
With the increase in population, the limitation of arable areas and reduction in availability of labor, the use of machines becomes increasingly necessary for the cultivation of large areas. Because of this, there is a need to conduct research aimed at determining the capabilities and
limitations of land use, in addition to promoting awareness about sustainable soil management.
The areas of sugar cane cultivation are part of this
scenario, because the schedule of activities of a cane field
Brazil, besides being the largest producer of sugar cane,
is also the first in the production of sugar and ethanol, and
has won the international market with the supply of biofuel as alternative energy, besides this it is also responsible for more than half of the sugar marketed in the world (Ministério da Agricultura, Pecuária e Abastecimento - MAPA, 2015).
The cultivation of sugar cane relies on the use of heavy machinery and equipment, as well as intensive cultivation of the soil, resulting in an accelerated depletion of its physical attributes (Souza et al., 2006). This intensive use of machinery and agricultural implements contributes to changes in the dynamic and physical properties of soils, which has generated the interest of researchers for studies on compression and dynamics of soil (Silva et al.,
2004). According to Bastos (1987), the heavy traffic of
agricultural machinery on soils in the stages of sugarcane production can cause soil compaction and, consequently,
negatively change water infiltration and the development of
the roots. The mechanical resistance of soil to penetration has been used worldwide for the detection of compacted layers in studies on the action of machinery on the ground and in the prevention of mechanical impediment on the development of the root system of the plants.
However, information allowing adaptations of mechanized machinery to the real needs of the soil would be relevant to the preservation of its structure. Surveying or ponder-dimensional characterization should be an important step in the design of mechanized equipment. Through this survey, it is easy to see the need to describe the area of contact between the tire and the ground, because
from these data you can find the soil contact pressure value,
making it possible to assess the environmental impact of
traffic (Hallonborg, 1996).
High contact pressures applied to soil result in a greater degree of compaction and consequently greater runoff and erosion resistance, making root penetration difficult, reducing water infiltration and increasing
significant losses of nutrients. Porterfield and Carpenter
(1986) indicate that the shallow compression level depends mainly on the contact pressure and deep compression depends on the area and contact pressure applied to the soil and width of the tire.
Similarly, Novak et al. (1992) states that high pressure tire-ground contact causes an increase in the density of the soil so, it is recommended to keep contact pressure low to avoid compaction. Therefore, allowing the appropriate water content to the soil (friable consistency) and the presence of plant residue (straw) on the ground.
There are strategies able to minimize the effects of soil compaction through the appropriate sizing of agricultural machines. This is because it is more advantageous to avoid compression, reducing the mechanical load on the soil, than needing to loosen the soil periodically (Hakansson and Reeder, 1994). In this way, the use of new technologies and suitable management practices must be developed and adopted to characterize size and solve the problems of machine interaction with the ground, especially about the distribution of pressures caused by the wheels in the soil, thus avoiding the negative effects of compression (Söehne, 1958).
Some works show the changes of the physical attributes of the soil caused in mechanized areas and other changes in the mass of machinery and implements; however, it is necessary to carry out research, which correlates the two aspects to get conclusive answers. Therefore, the objective of this study was to quantify contact areas, using different methodologies, and pressures of farm equipment employed in production activity and evaluate structural changes offered in a Red Latosol with the presence and absence of straw cover.
MATERIAL AND METHODS
The experimental tests were carried out in the area of the Sao Martinho sugar cane Plant, located in the municipality of Pradópolis-SP (21° 18‘ 67“ South latitude, 48° 11‘ 38” West longitude and 537 m altitude). The area has been used in ethanol production since 1948 and the company currently has an area of 111,000
hectares. According to data of Centro de Pesquisas Meteorológicas e Climáticas Aplicadas à Agricultura - CEPAGRI (2013) the climate of the region is classified
by Köppen criteria as tropical dry winter climate (Aw) with average annual precipitation of approximately 1400 mm and maximum rainfall between the months of December to February. This study was conducted during the period from November 2012 to November 2013, in a raw cane area with mechanized harvesting,
on Red Latosol (LVef) (Empresa Brasileira de Pesquisa Agropecuária - EMBRAPA, 2013), with particle density
of 2.72 kg dm-3 and particle size of soil with 522 g kg-1
of clay, 302 g kg-1 of silt and 176 g kg-1 of sand. The
cultivation of sugarcane cycles lasted 6 years, followed by the renewal of the crop.
The experiment was fitted with traffic treatments
design in a factorial scheme of type 4 x 2 (four types of wheels and two conditions of coverage), with three repetitions, totaling 24 experimental units. Two layers were evaluated: surface layer (0 - 0.1 m) and subsurface
(0.1 - 0.2 m). Wheeled traffic treatments (Figure 1) had
consisted of:
a) R1- Firestone brand tire on tractor front axle
that pulled the wagon, with specification of 600/65 R 28, inflation pressure of 20 Pounds and 75% ballast;
b) R2- Firestone brand tire on rear axle of tractor
that pulled the wagon, with specification of 710/70 R 38, inflation pressure of 23 Pounds and 75% ballast;
c) R3- BKT brand tire on sugarcane wagon, with
specification of 600/50-22.5, inflation pressure of 23 Pounds and 75% ballast;
d) R4- Case Metal track sugarcane Harvester, specification A8800, type of chain is greased, shoes in
agricultural design and shoe width of 457 mm (18 in.).
The tractor used was a Case, Magnum Model 235,
with 235 HP with total mass of 14880 kg. The wagon used
was a Tracan, model VTX 14000/2010, with total mass
of 14740 kg empty and with load capacity of 14000 kg, totaling 28740 kg when fully loaded. The harvester used
in evaluation was a Case, A8800 Model, with 358 HP and
mass of 18300 kg, equipped with metallic tracks.
Pondero-dimensional characterization of tractor, wagon and harvester was carried out aiming to meet the contact pressure applied to the soil and check that these are consistent with the history of tensions in registered experimental areas. The measurement of contact pressure
(CP) was obtained by the relation between the strength/ load (F) of each tire and the area of contact (CA) corresponding, according to Equation 1:
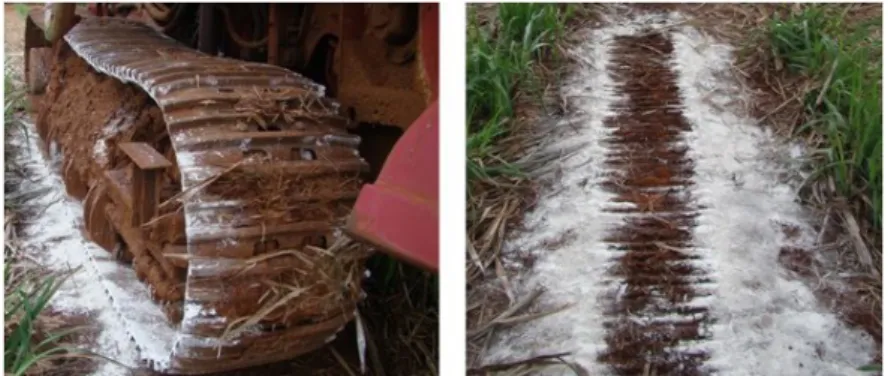
Figure 1: Wheels used in soil compaction. A: tire on front axle; B: tire on rear axle; C: a sugarcane wagon tire; D: harvester track.
(1)
F CP
AC =
In that CP is the contact pressure (kgf cm2); F the applied force (kgf); and CA contact area (cm2).The strength was determined from the mass of the tractor and/or farm
equipment transferred to the wheels (tire or track), using the platform scales Toledo, model BPV-830 (Figure 2).
For the determination of contact area on the ground, powdered lime was placed around the tire. Next the axis was raised with the help of a hydraulic jack and the marked area on the ground was transcribed to a clear plastic plate (Figures 3 and 4), as to the methodology of Silva et al. (2003). From there two procedures were adopted for measurement of contact area:
that of the tire, the value of η was obtained by Equation 3
(Upadhyaya and Wulfsohn, 1990):
Figure 3: Contact area of the track on the ground with the use of lime.
Figure 4: Contact area of tires estimated by digital method (CA2 and RCA). Run 1: front tire of the tractor in the
field without straw (A); Run 2: Wagon tire loaded in the field with the presence of straw (B); Run 4: track of the harvester in the field without straw (C) and with straw (D); CA2: contact area for digital procedure; RCA: real contact area; L: measurement of the main axis of the ellipse circumscribed in the contact area and; b: smaller ellipse axis dimension circumscribed in the contact area. Adapted by Vischi Filho et al. (2015).
a) test procedure - when the contact area (CA) had
an elliptical format, the methodology proposed by Lyasko (1994) was adopted, here named contact area of the ellipse
(CA1), estimated by Equation 2:
(2)
. . . 1 2. 4
A
π
L bη
π
= −
(3)
2 1
w
0,5
w
1
w
2 0,5
b
b
b
η
=
−
−
−
Where A is the contact area (m²); (L) the extent of the major axis of the ellipse circumscribing the area of contact (m); and (b) the size of the smaller ellipse axis
circumscribed in the contact area (m). The value of η depends on the deformation of the tire load and inflation
pressure and can be null when the width is smaller than the area of the tire. When the width of the area was greater than
Where w is width of the contact area (m); and (b) the width of the tire (m).
b) Digital procedure - the areas transcribed to
a plastic card (in the field) were digitized from digital
area of this ellipse was obtained, hereafter called contact
area 2 (CA2), according to Silva et al. (2003). The actual contact area (RCA) was obtained by means of the CAD software in which we quantified the average contact areas of
the treads, according to methodology by Silva et al. (2003). The collections of disturbed and undisturbed soil samples for evaluation of physical and mechanical attributes of the soil were held in two layers, surface layer (0.0 - 0.1 m) and subsurface (0.1 -0.2 m), immediately after the passage of different tire types (Figure 1). The texture was determined
by the pipette method (Embrapa, 2011). Particle density was determined by the volumetric flask method, the bulk
density was determined by the method of volumetric ring and the total porosity was calculated, all in accordance to
the procedures contained by Embrapa (2011).
Gravimetric soil moisture tests were determined following the methodology described by Embrapa (2011).
In samples collected with an Auger, the collected material was wrapped in a layer of aluminum foil and then dried in an oven until constant weight. For determination of soil resistance to penetration, we used the impact penetrometer
model IAA/Planalsucar. The purpose of this test was to penetrate a rod with a tip and fixed projection angle of
attack to the ground through piston impact of known mass to a constant height. After each impact suffered by the penetrometer rod depth was noted. The required pressure to the rod in order to achieve soil penetration was
calculated from the values of depth, using the Equation 4
by Stolf (1991):
Where RP is the soil resistance to penetration (MPa); M the mass of the piston (4 kg); m the mass of the unit without the piston (3.2 kg); Mg + mg the weights of M and m (kgf); h the height of the fall of the piston
(0.4 m); X the penetration of rod (cm/impact); and A
cone area (cm²). Soil precompression stress (SPS) was
quantified according to the suggestion of Dias Junior and
Pierce (1995), by means of uniaxial compression tests, done according to Bowles (1986), in which the following loads were considered: 25, 50, 100, 200, 400, 800 and
1600 kPa. Each pressure was applied until reaching 90% of the maximum deformation of the body-of-proof,
as assumed by Taylor (1948). Uniaxial compression
(
)
0.098
M Mg h
Mg mg
M m X
RP A × + + × +
= × (4)
tests were performed with an automatic consolidometer
with human-machine interaction, CNTA-HMI model/ BR-001/07, developed by Silva et al. (2015). Uniaxial compression tests were carried out with the actual field
moisture (0.29 to 0.31 kg kg-1) at the time of the runs and soil
collection. From the compression curve, we estimated the
values of SPS, according to Dias Junior and Pierce (1995). After finishing testing the bodies-of-proof were dried in an
oven at 105 °C until constant weight for determination of
bulk density and water content verification.
The tests of normality and assumptions of ANOVA were achieved, and by using the statistical program Sisvar (Ferreira, 2011), the data was submitted for analysis of variance and F-test. The comparison between the averages
was performed when the value of F was significant, using the test of Scott & Knott (1974), at 5% probability of error.
The construction of the graphics was performed through the demo version of Sigma Plot 11.0 application (Systat Software Inc®). In the graphs, the comparison between the averages, when the value of F was significant, was
made through the standard error of average, for being more suitable, according to Paes (2008), when it comes to making inferences about the averages.
RESULTS AND DISCUSSION
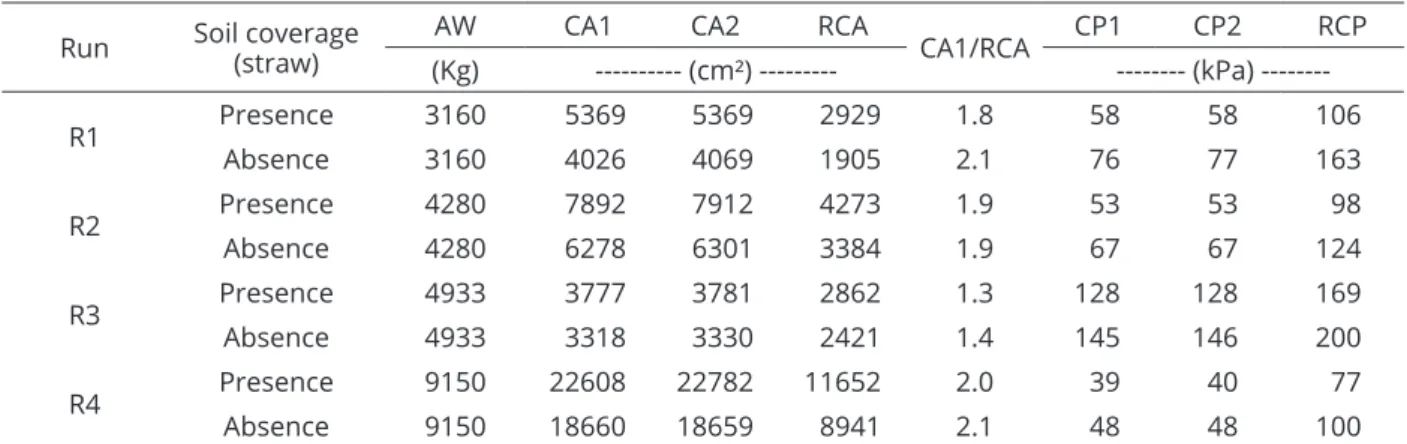
In Table 1 the mass is presented at the end of each axis of the evaluated farm equipment (AW), values of contact areas estimated analytically according to method of ellipse
(CA1) and digitally, using computational and imaging resource (CA2 and CAR), as well as their respective contact pressures (CP1, CP2 and RCP), in evaluations carried out in the field with the presence and absence of straw cover on the soil surface.CA values varied considerably between
methods, highlighting that the analytical method employed
in this study (CA1) overestimates this information when compared to determined values digitally named RCA. In relation to CA1 and CA2, close proximity between the values was obtained and, in general, the values of CA1 were less than or equal to that found by the method of CA2. The
largest differences were observed when we compared the
RCA with CA1 and CA2.
The contact areas found by the method of ellipse
(CA1 and CA2) are overrated on average 1.8 times
indicating, consequently, a decrease in the same proportion in the values of contact pressures for all runs and tested conditions when compared to the values obtained by the
RCA method (Table 1). The method of obtaining the CA1 and CA2 overestimate the contact area by not transcribing
underestimate the contact pressure. Despite the delays,
time and logistics necessary for determination of the RCA,
it is understood that this method allows the determination of values of contact pressures well closer to the history
of agricultural soils, tension usually verified in studies
modeling the load-bearing capacity (soil precompression stress values) described in studies carried out in the country by Silva et al. (2000) and Souza et al. (2012).
It was observed that the largest and smallest
values of contact pressure (CP) have been verified on
the ground with the absence of straw and soil covered with straw, respectively (Table 1). This result is mainly due to the greater contact area of the soil found in areas covered with straw on its surface. The presence of straw on the ground, in addition to promoting the reduction
of CP, results in a reduction and distribution of pressure
applied on the surface, because of its ability to absorb part of the energy transmitted by the farm machinery to the soil (Braida et al., 2006).
For the different runs evaluated, it appears that
the highest values of CP were obtained by R3, followed
by R2, R1 and R4, regardless of soil cover with the
presence or absence of straw (Table 1). The CP1 and CP2
underestimated values of contact pressure in the soil. This
is a very important finding, since most published works currently use the CA1 as the main method for obtaining
the contact area between tire and soil. As this method
overestimates the CA, it also allows underestimating of
the contact pressure. Recent work carried out to estimate the load-bearing capacity of the soil (Silva et al., 2009;
Pais et al., 2011; Iori et al., 2012) indicate the maximum contact pressure that this soil supports without plastic deformation of the soil, not exceeding the critical limit.
Thus, if the calculated values of contact pressure (CP1 and CP2) are underestimated, i.e. indicate lower values compared to RCP, in many cases the CP may have
exceeded critical thresholds obtained in studies of load-bearing capacity of the soil, causing plastic deformation or soil compaction.
Considering the difficulty, delay and costs in obtaining the actual contact area (RCA), this presents
preponderant disadvantages when compared to the
method of the ellipse, whether digital or analytical (CA1 and CA2). Results of correlation between (RCA) and (CA1 and CA2) indicated a correlation coefficient (r), the value of 0.93 ** (Figure 5). RCA can also be estimated by equation RCA = -197.627 + 0, 484 ECA, with r2 of 0.86 **, where ECA is ellipse contact area. This result allows inferring that in routine studies, both the procedure CA1 as CA2 can be used in the evaluation of contact areas, with the probability of 93% of coherence in relation to the RCA method.
There is a relationship between the contact area
determined analytically (CA1 and CA2) and the real (RCA), observing that the first method overestimated the CA to the order of 1.4 to 2.1 times, giving an average of 1.8, i.e. 80%
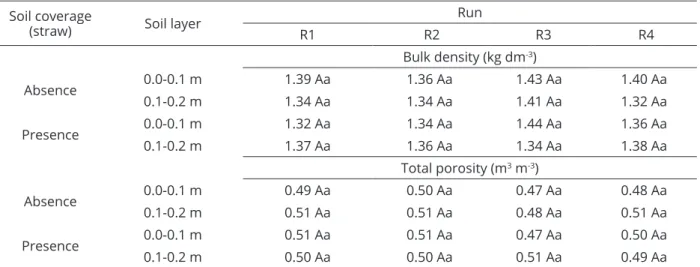
rise in contact area, also observed by Silva et al. (2003). Table 2 presents the average values of bulk density (Bd) and total porosity for the two layers analyzed, provided with the presence and absence of straw cover,
Run Soil coverage (straw) AW CA1 CA2 RCA CA1/RCA CP1 CP2 RCP (Kg) --- (cm²) --- (kPa)
---R1 Presence 3160 5369 5369 2929 1.8 58 58 106
Absence 3160 4026 4069 1905 2.1 76 77 163
R2 Presence 4280 7892 7912 4273 1.9 53 53 98
Absence 4280 6278 6301 3384 1.9 67 67 124
R3 Presence 4933 3777 3781 2862 1.3 128 128 169
Absence 4933 3318 3330 2421 1.4 145 146 200
R4 Presence 9150 22608 22782 11652 2.0 39 40 77
Absence 9150 18660 18659 8941 2.1 48 48 100
AL: axle load; CA1: estimated analytically contact area according to the method of the ellipse; CA2: contact area estimated digitally according to the method of the ellipse; RCA: real contact area; CA1/RCA: relationship between contact area obtained analytically (CA1) and between real contact area obtained digitally (RCA); CP1 and CP2: estimated contact pressure according to the area of the ellipse; RCP: real contact pressure; R1: tire on front axle; R2: tire on rear axle; R3: tire on a sugarcane wagon; R4: metallic track of sugar cane Harvester.
after runs by different wheels. Prior to statistical analysis, higher values from Bd on surface layer in relation to subsurface layer were observed. The average values of Bd varied from 1.32 kg dm-3 to 1.44 kg dm-3. The
behavior of this attribute between the conditions with the presence and absence of ground cover showed similar trends, with average values of 1.36 kg dm-3 and 1.37
kg dm-3, respectively. The total porosity of the soil had
lower variation. The smallest and largest values of soil porosity were 0.47 to 0.51 m3 m-3, respectively.
The responses of bulk density and total porosity of the soil showed no significant variation between the averages (Table 2). These attributes are not always sensitive in identifying structural soil degradation. Dias
Junior and Pierce (1995) pointed out that not every
variation in the bulk density and, therefore in total porosity could be considered as degradation of soil structure, this is because the deformations in the secondary compression curve are elastic and recoverable, which, according to this author are variations inadequate to characterize the
Figure 5: Relationship between real contact area (RCA) and the procedure of the ellipse (CA1 and CA2).
Soil coverage
(straw) Soil layer
Run
R1 R2 R3 R4
Bulk density (kg dm-3)
Absence 0.0-0.1 m 1.39 Aa 1.36 Aa 1.43 Aa 1.40 Aa
0.1-0.2 m 1.34 Aa 1.34 Aa 1.41 Aa 1.32 Aa
Presence 0.0-0.1 m 1.32 Aa 1.34 Aa 1.44 Aa 1.36 Aa
0.1-0.2 m 1.37 Aa 1.36 Aa 1.34 Aa 1.38 Aa
Total porosity (m3 m-3)
Absence 0.0-0.1 m 0.49 Aa 0.50 Aa 0.47 Aa 0.48 Aa
0.1-0.2 m 0.51 Aa 0.51 Aa 0.48 Aa 0.51 Aa
Presence 0.0-0.1 m 0.51 Aa 0.51 Aa 0.47 Aa 0.50 Aa
0.1-0.2 m 0.50 Aa 0.50 Aa 0.51 Aa 0.49 Aa
Table 2: Average values of bulk density and total porosity of a Red Latosol of clayey texture under different
conditions.
degradation of soil structure. Similarly, Martins et al. (2012) assessing soil structural degradation, also found no changes in values of density and total porosity of the soil in the evaluation of various uses of the soil in the Amazon.
It is noted that, in some cases, the evaluation of attributes as density and total porosity of the soil alone are not sensitive enough to research and breakdown
the impact of agricultural traffic. Remarks like these
are very relevant for selection of soil properties able to identify the effect of external and internal factors causing soil structural degradation. Thus, the soil resistance to
penetration and cone index (CI) were selected for this
study in an attempt to check the effect or attenuation, respectively of the contact pressure and vegetable residues on soil structural degradation.
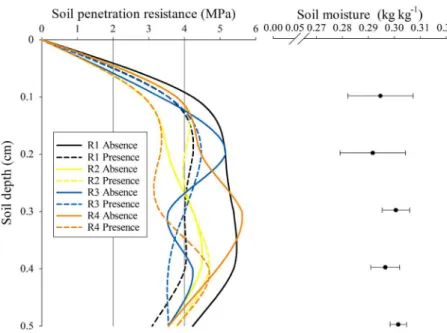
The penetrometer profile and soil moisture for different layers between 0.0 and 0.5 m in a Red Latosol in the various conditions of the study can be found in Figure 6. For better interpretation of soil resistance to penetration (RP), the suggestion of Soil Survey Staff (1993) was employed, which proposed seven classes of soil resistance to penetration: extremely low (< 0.01); very low (0.01-0.1); low (0.1-1.0); moderate (1.0-2.0); High (2.0-4.0); very high (4.0-8.0) and extremely high (> 8.0).
Preliminarily, it appears that moisture had no
significant variations in the different conditions of the
study (Figure 6). The minimum and maximum values of soil moisture were 0.27 and 0.31 kg kg-1, respectively, and
with an average of 0.30 kg kg-1. As for RP, there is a similar
behavior on the values of soil resistance to penetration in
the first layer of the soil analyzed (0-0.10 m) for the various conditions proposed in this study, remaining classified as
high to soil penetration resistance. The biggest difference and increase in RP values were from 0.10 m depth, in which the majority of the treatments were located in the class very high to soil penetration resistance. We observed an increase in the values of soil penetration resistance with increasing soil depth up to 0.4 m, and after this depth values decreased. The treatments with the soil surface covered with straw presented lower values of soil penetration resistance, regardless of the type of run
analyzed, demonstrating some of the benefits of straw
maintenance on the soil surface. Among the runs, the largest values of soil penetration resistance were found in R1, this tire is engaged to the front axle and in R3, a sugarcane wagon tire, both with the absence of straw,
mainly due to lower CA and greater CP caused by the traffic of these farm machines (Table 1).
Figure 6: Soil penetration resistance (MPa) and soil moisture (kg kg-1) for the various conditions evaluated in the 0.0
However, there is no consensus when the discussion of similarities and differences is limited to analysis of a
penetrometer profile (Figure 6), recommended, to statistically
analyze the data obtained. Thus, the RP values were
transformed into cone index (CI), that is, the average of the
values of RP in a given soil layer, which are presented in Tables 3, 4 and 5 in function of each factor studied. Table 3
presented the average values of IC for the interaction between the factors run and ground cover. It is observed that the IC
values were similar for all runs analyzed in the area with straw coverage. Proving that the straw promotes a greater protection in soil structure, both by increasing the contact area (Table 1), and the highest and best contact pressure distribution of farm equipment used on the soil.
When the comparison of the averages of CI was
held without the protection of straw for ground cover, it
turns out that there was significant variation between the
averages. The R1 run, with a tire on the front axle and R3
with a tire on the sugarcane wagon, presented CI values
similar to each other and higher than the R2 run, with tire on the rear axle and R4, which corresponds to the track of the Harvester. Similarly, the comparison between the different analyzed soil covers (presence or absence of straw), for each run individually, pointed out similarities
between averages of CI when the run analyzed was the rear
tire and the track of the Harvester. When the run analyzed was the front tire and the tire of wagon the presence or not of straw provided different effects on soil resistance to penetration, that is, soils without straw presented higher
CI in relation to areas with straw on the soil (Table 3). Table 4 presented the average values of CI for
soils with the presence and absence of straw coverage. It is observed that the treatments with the surface covered
with straw present lower CI values, highlighting a
lesser degree of compaction after the contact of the run. According to Braida et al. (2006), the existence of straw on the soil makes it possible to absorb part of the
energy produced by the compression of machine traffic
Soil coverage (straw)
Run
R1 R2 R3 R4
Presence 3.8 Aa 4.1 Aa 3.8 Aa 3.6 Aa
Absence 4.9 Bb 3.7 Aa 4.0 Aa 4.5 Bb
Table 3: Average values of cone index (MPa) for a Red Latosol in the different soil covers and types of wheelsets.
Uppercase letters compare runs and lowercase letters compare land cover (Scott-Knott, p < 0.05).
Soil coverage (straw) Cone index (MPa)
Presence 3.82 A
Absence 4.25 B
Table 4: Average values of cone index to a Red Latosol in the different soil covers.
Medium followed by different uppercase letters differ by Scott-Knott test (p < 0.05).
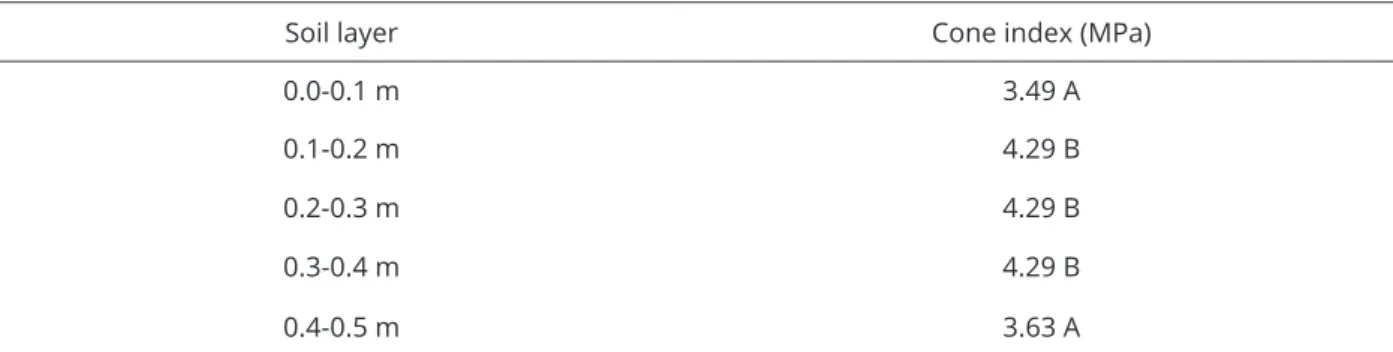
Soil layer Cone index (MPa)
0.0-0.1 m 3.49 A
0.1-0.2 m 4.29 B
0.2-0.3 m 4.29 B
0.3-0.4 m 4.29 B
0.4-0.5 m 3.63 A
Table 5: Average values of cone index to a Red Latosol in the different soil layers.
and animals. Thus, the results of CI showed that straw
on the soil surface contributed to a greater protection to the soil structure. That is because the smaller values of this attribute in the soil with straw on the surface were due to higher energy dissipation produced by the impact of the wheels of the machines travelling on the ground. Straw presence on the soil surface can improve their attributes and even crop productivity. Santos et al. (2010)
identified interaction between the amount of organic
material applied on the soil surface and the productivity
of sugarcane in Red Latosol. Chaer and Totola (2007)
observed improvements in physical, chemical and biological conditions of the soil due to the presence of straw on the ground, in addition to better use and less loss of nutrients and water in the soil, thus maintaining a stable environment for the development of the crops.
Table 5 presented the average values of CI for the five layers of soil assessed. It turns out that the first and
the last layer, between 0.0-0.1 and 0.4-0.5 m, respectively, were similar and lower than the values found in the layers of 0.1-0.2, m 0.2-0.3 m and 0.4-0.3 m. The lower average
values of CI of the first layer, even though suffering direct contact of the wheels, can be justified by the higher
concentration of organic matter and consequently, better soil structure in that layer. The layers of 0.1-0.2 m, 0.2-0.3 m and 0.3-0.4 m showed the largest mean values of soil
penetration resistance, due to the fact of not having high structure when compared to the top layer.
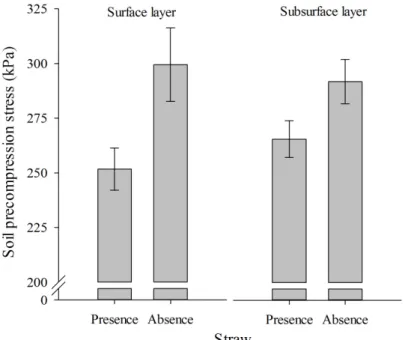
Figures 7 and 8 presented the average values of SPS in the Red Latosol for the surface and subsurface layer in areas shared with the different runs in the presence and absence of straw. Regardless of the layer, the presence of straw provided less of an impact on soil structure, reducing the average SPS, this is because the residue retained on the surface of the soil helps dissipate some of the energy produced by the impact of the wheels of the machinery on the ground. The straw also promotes the increase of soil organic matter content, which
reflects in the improvement of the water holding capacity and
the ability of organic matter in establishing links between soil particles, increasing the cohesion between the same (Silva et
al., 1986; Stone and Ekwue, 1993; Zhang et al., 1997; Aragón
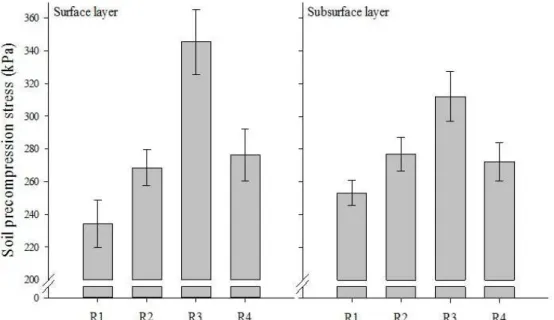
et al., 2000; Ball et al., 2000 and Braida et al., 2006). The values of SPS show that the biggest impacts on soil structure in the surface layer and subsurface
areas occurred after traffic from R3, followed by R2 and R4, statistically similar, and finally, R1 (Figures 7 and
8). The greatest impacts on structure were caused by the sugarcane wagon tires (R3) which are supported by the data of contact pressure applied to the soil (Table 1).
In order to evaluate the influence of straw on the
ground on the attenuation of impact of different wheeled
traffic, as well as the analysis of contact pressure applied
Figure 7: Average values of soil precompression stress (kPa) for the conditions of presence and absence of straw on the
Figure 8: Average values of soil precompression stress (kPa) for different runs on the surface layer and subsurface
layer of a Red Latosol. The error bar represents the standard error of the mean.
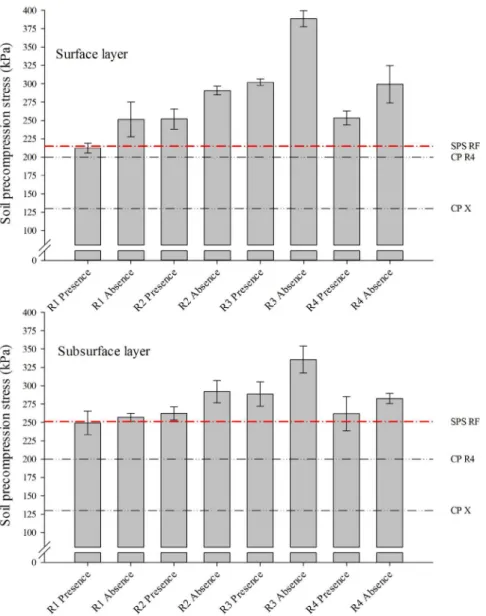
to the soil, Figure 9 presents average values of SPS for
a Red Latosol in the superficial and subsurface layers.
For each run, verification was made for the positive impact of vegetable waste (straw) as a likely disperser of
compression energy caused by traffic. In all treatments (runs), we observed significant increase of SPS when traffic was conducted in the presence of straw.
In the surface layer (SP), in R1, straw reduced
up to 15% of the SPS, in R3 17%, R4 15%, and in R2 no difference had been verified (Figure 9). Noted for the
conditions under which the research was conducted, we found the following sequence of impact of the run with their respective farm equipment: R3>R4>R1>R2. In the subsurface layer (SSP) the greatest impact was caused
by R3 (14%), followed by R2 (10%). In R1 and R4 no significant differences were observed, and may suggest
the following sequence of impact: R3> R2>R4>R1. The greater impact of R3, despite the greater contact area, must be associated exclusively to the transfer of sugarcane wagonaxle load (Table 1), which, when loaded weighed approximately 14 tons, promoting contact pressure of approximately 169 and 200 kPa, respectively, provided with the presence and absence of straw. The same is observed for R4 (metallic track of Harvester), that despite
the significant increase of SPS under the condition without
straw, its impact was also mitigated by the high contact area. In Figure 9 there are also reference lines of average
actual contact pressure (CPX), maximum contact pressure
obtained in R3 (CP R4) and the SPS estimated before the application of treatments, that is, the traffic, taken in
this study as the reference pressure (SPS RF). Note that for the top layer, in R1 only; probably due to the straw on the surface of the ground, the values did not differ
from the reference area. In the other cases, all traffic
runs under the condition with the presence and absence of straw presented values above the reference. For the subsurface layer, the behavior observed was different, that is, the R1, R2 and R4 presented values of SPS which did not differ statistically from the value of SPS from
the reference obtained before, indicating influence from
history of depth tension arising from previous cycles of culture management. Observations and considerations such as these are important in preventing soil compaction.
Similarly, Araújo-Junior et al. (2011) verified maximum pressures applied to the soil, calculated through the TASC
program (Diserens, 2005). However, these authors warn
that although the TASC program may be an important tool
for the prevention of soil compaction spread, this model still makes a subjective judging to the risk of compaction, since this does not consider the compressive behavior of
soils under different management systems. Reaffirming
the importance of knowledge of the real pressure applied to the soil, as well as the compressive behavior of the soil
CONCLUSIONS
The results show that the values of the contact areas obtained according to the ellipse method are overrated when compared to the values of real contact area, resulting in a reduction of approximately 1.8 times the contact pressure
values calculated. Covering the soil with straw increases
the runs’ contact area, resulting in lower contact pressure
values. Traffic from farm equipment employed in sugarcane
Figure 9: Average values of soil precompression stress (kPa) for the different treatments evaluated (R1, R2, R3
and R4) under conditions with the presence and absence of straw on the surface layer and subsurface layer. CPX: average actual contact pressure of the treatments evaluated; CP R4: maximum actual contact pressure of the treatment R4 provided with straw; SPSRF: soil precompression stress reference obtained prior to the last run. The error bar represents the standard error of the mean.
activity in areas of ground covered with straw presents less
structural alteration of the soil, confirming that the increased
contact area produced by straw reduces contact pressure and promotes greater energy dissipation of compression. The wheels of the sugarcane wagon on the front axle of the
Case tractor Magnum Model 235, 14880 kg total mass, to
REFERENCES
ARAGÓN, A. et al. Maximum compactibility of Argentine soils from the Proctor test; the relationship with organic carbon and water content. Soil & Tillage Research, 56:197-204, 2000.
BALL, B. C.; CAMPBELL, D. J.; HUNTER, E. A. Soil compactibility in relation to physical and organic properties at 156 sites in UK. Soil & Tillage Research, 57:83-91, 2000.
BASTOS, S. A. Cana-de-açúcar, o verde mar de energia. São Paulo: Ícone, 1987. 127p.
BOWLES, J. E. Engineering properties of soils and their measurements. 3rd ed. New York: McGraw Hill, 1986. 218 p.
BRAIDA, J. A. et al. Resíduos vegetais na superfície e carbono orgânico do solo e suas relações com a densidade máxima obtida no ensaio Proctor. Revista Brasileira de Ciência do Solo, 30:605-614, 2006.
CENTRO DE PESQUISAS METEOROLÓGICAS E CLIMÁTICAS APLICADAS À AGRICULTURA - CEPAGRI. Clima dos Municípios Paulistas. 2013. Available in: <http://www.
cepagri.unicamp.br/>. Access in: April, 27, 2016.
CHAER, G. M.; TOTOLA, M. R. Impacto do manejo de resíduos orgânicos durante a reforma de plantios de eucalipto sobre indicadores de qualidade do solo. Revista Brasileira de Ciência do Solo, 31:1381-1396, 2007.
DIAS JÚNIOR, M. S.; PIERCE, F. J. A simple procedure for estimating preconsolidation pressure from soil compression curves. Soil Tillage Research, 8(2):139-151,
1995.
DISERENS, E. TASC: tyres/Tracks and soil compaction. A pratical tool to prevent soil compaction damage. MS Excel 2000. Zurich: Agroscope FAT Tänikon. 2005. 68 p. Manual.
EMPRESA BRASILEIRA DE PESQUISA AGROPECUÁRIA - EMBRAPA. Manual de métodos de análise de solo. Rio de Janeiro: Embrapa, 2011. 230p.
__________. Sistema Brasileiro de Classificação de Solos. Rio de Janeiro: Embrapa, 2013. 353p.
FERREIRA, D. F. Sisvar: A computer statistical analysis system.
Ciência e Agrotecnologia, Lavras, 35(6):1039-1042, 2011.
HAKANSSON, I.; REEDER, R. C. Subsoil compaction by vehicles with high axle load-extent, persistence and crop response.
Soil & Tillage Research, 29:277-304, 1994.
HALLONBORG, U. Super ellipse as tyre-ground contact area.
Journal of Terramechanics, 33:125-132, 1996.
IORI, P. et al. Pressão de preconsolidação como ferramenta de análise da sustentabilidade estrutural de Cambissolo Háplico, Argissolo Amarelo e Gleissolo Háplico em Registro, SP. Revista Brasileira de Ciência do Solo, 36:1448-1456, 2012.
LYASKO, M. I. The determination of deflection and contact characteristics of a pneumatic tire on a rigid surface.
Journal of Terramechanics, 31(4):239-246, 1994.
MARTINS, P. C. C. et al. Structural sustainability of Cambisol under different land use system. Revista Brasileira de Ciência do Solo, 36:1724-1732, 2012.
MINISTÉRIO DA AGRICULTURA, PECUÁRIA E ABASTECIMENTO - MAPA. Cana-de-açúcar. 2015. Available in: <http://www.
agricultura.gov.br/vegetal/culturas/cana-de-acucar/saiba-mais>. Access in: november, 11, 2015.
NOVAK, L. R. et al. Efeito do tráfego de trator e da pressão de contato pneu/solo na compactação de um Latossolo Vermelho-Escuro Álico, em dois níveis de umidade.
Pesquisa Agropecuária Brasileira, 27:1587-1595, 1992.
PAES, A. T. Por dentro da estatística. Einstein: Educação Continuada, 6:107-108, 2008.
PAIS, P. S. M. et al. Compactação causada pelo manejo de plantas invasoras em Latossolo Vermelho-Amarelo cultivado com cafeeiros. Revista Brasileira de Ciência do Solo, 35:1949-1957, 2011.
PAULINO, A. F. et al. Escarificação de um Latossolo Vermelho na pós-colheita de soqueira de cana-de-açúcar. Revista Brasileira de Ciência do Solo, 28:911-917, 2004.
PORTERFIELD, J. W.; CARPENTER, T. G. Soil compaction: an index of potential compaction for agricultural tires. Transactions of the American Society of Agricultural Engineers,
29:917-922, 1986.
SANTOS, D. H. et al. Produtividade de cana-de-açúcar sob adubação com torta de filtro enriquecida com fosfato solúvel. Pesquisa Agropecuária Tropical, 40:454-461, 2010.
SCOTT, A. J.; KNOTT, M. Accounter analysis methods for grouping means in the analysis of variants. Biometrics, 30:507-512, 1974.
SILVA, A. P.; LIBARDI, P. L.; CAMARGO, O. A. Influência da compactação nas propriedades físicas de dois Latossolos.
Revista Brasileira de Ciência do Solo, 10:91-95, 1986.
SILVA, R. B.; LANÇAS, K. P.; DIAS JUNIOR, M. S. O limite da terra.
Cultivar Máquinas, 25:12-19, 2003.
SILVA, R. B. et al. Estimation and evaluation of dynamic properties as indicators of changes on soil structure in sugarcane fields of Sao Paulo State, Brazil. Soil & Tillage Research, 103:265-270, 2009.
SILVA, V. R.; REINERT, D. J.; REICHERT, J. M. Resistência mecânica do solo à penetração influenciada pelo tráfego de uma colhedora em dois sistemas de manejo do solo. Ciência Rural, 30:795-801, 2000.
SILVA, R. B. et al. Desenvolvimento, automação e desempenho de um consolidômetro com interface homem-máquina.
Revista Brasileira de Ciência do Solo, 39:416-427, 2015.
SÖEHNE, W. Fundamental of pressure distribution and soil compaction under tractor tires. Agricultural Engineering, 39:276-281, 1958.
SOIL SURVEY STAFF. Soil survey manual. Washington: USDA-SCS, 1993. 437p. (Handbook, 18).
SOUZA, G. S. et al. Compressibilidade do solo e sistema radicular da cana-de-açúcar em manejo com e sem controle de tráfego.
Pesquisa Agropecuária Brasileira, 47:603-612, 2012.
SOUZA, Z. M. et al. Dependência espacial da resistência do solo à penetração e do teor de água do solo sob cultivo
contínuo de cana-de-açúcar. Ciência Rural, 36:128-134, 2006.
STOLF, R. Teoria e teste experimental da fórmula de transformação nos dados de penetrômetro de impacto em resistência do solo. Revista Brasileira de Ciência do Solo, 15:229-235, 1991.
STONE, R. J.; EKWUE, E. I. Maximum bulk density achieved during soil compaction as affected by the incorporation of three organic materials. Transactions of the American Society of Agricultural Engineers, 36:1713-1719, 1993.
TAYLOR, D. W. Fundamentals of soil mechanics. New York: John Wiley, 1948. 770p.
UPADHYAYA, S. K.; WULFSOHN, D. Relationship between tire deflection characteristics and 2-D tire contact area.
Transactions of the American Society of Agricultural Engineers, 33:25-29, 1990.
VISCHI FILHO, O. J. et al. Capacidade de suporte de carga de Latossolo Vermelho cultivado com cana-de-açúcar e efeitos da mecanização no solo. Pesquisa Agropecuária Brasileira, 50(4):322-332, 2015.