Universidade do Minho
Escola de Economia e Gestão
Laura Cristina Bonjardim Coelho
outubro de 2015
Investor sentiment and the cross-section of
stock returns in the French stock market
Laur
a Cristina Bonjar
dim Coelho
Inves
tor sentiment and t
he cross-section of s tock re turns in t he F rench s tock mark e t UMinho|20 15
Laura Cristina Bonjardim Coelho
outubro de 2015
Investor sentiment and the cross-section of
stock returns in the French stock market
Trabalho efetuado sob a orientação da
Professora Doutora Cristiana Cerqueira Leal
Dissertação de Mestrado
Mestrado em Finanças
Universidade do Minho
Escola de Economia e Gestão
ii
Declaração
Nome: Laura Cristina Bonjardim Coelho (PG24289) Bilhete de identidade: 14129306
Endereço eletrónico: laura.bonjardim.coelho@gmail.com Escola: Escola de Economia e Gestão
Departamento: Gestão
Designação de Mestrado: Mestrado em Finanças
Tema: Investor sentiment and the cross-section of stock returns in the French stock market Orientador: Professora Doutora Cristiana Cerqueira Leal
Ano de conclusão: 2015
É AUTORIZADA A REPRODUÇÃO INTEGRAL DESTA DISSERTAÇÃO APENAS PARA EFEITOS DE INVESTIGAÇÃO, MEDIANTE DECLARAÇÃO ESCRITA DO INTERESSADO, QUE A TAL SE COMPROMETE.
Universidade do Minho, Outubro 2015
iii
Acknowledgments
I would like to thank Minho University and the School of Economics and Management for all the resources available that allowed me to accomplish this significant milestone in my academic life.
Particularly, I would like to thank my supervisor, Professor Cristiana Leal, for the guidance, availability and knowledge provided throughout this challenging journey.
I cannot thank enough for the support, the patient and the unconditional love of my parents. All my achievements are also yours.
iv
Abstract
This dissertation studies the impact of investor sentiment on aggregated stock returns and a cross-section of market returns, in the French financial market.
Investor sentiment is captured using two distinct measures: a direct measure – the Consumer Confidence Index (CCI) – and an indirect measure – the orthogonalized Investor Sentiment Index (ISI┴). Following the work of Baker and Wurgler (2006) and Baker et al. (2012), the Investor Sentiment Index corresponds to the first principal component of six underlying proxies: market turnover, number and average first-day returns on IPOs, the share of equity issues, dividend premium and volatility premium. The Consumer Confidence Index represents a survey that directly asks investors about their expectations regarding the French stock market.
The analysis of the aggregated market returns suggests that the CCI is the most adequate index to capture investor sentiment, revealing a negative impact on all time horizons studied. The ISI┴, on the other hand, does not reveal a significant impact on the three shorter time horizons. The study of the cross-section market returns takes into consideration several firms’ characteristics. In this context, results suggest that ISI┴ is the most suitable index.
The study of the cross-section market returns indicates that small, high volatility, unprofitable, non-dividend-paying, less tangible, extreme growth and distressed stocks tend to earn subsequent higher (lower) returns after periods of low (high) sentiment. Results also show that changes in investor sentiment have a higher impact on these type of stock returns. Furthermore, this dissertation suggests that, overall and for both indexes, the observed patterns of the behaviour of investor sentiment do not reflect compensation for classical systematic risks.
Keywords: investor sentiment; direct and indirect measures of sentiment; sentiment on aggregated market returns; sentiment on cross-section market returns.
v
Resumo
Este estudo investiga o impacto do sentimento do investidor nas rendibilidades agregadas e a nível transversal no retorno das ações no mercado acionista francês.
O sentimento é medido de duas formas distintas: utilizando uma medida direta – o Índice de Confiança do Consumidor (CCI) – e uma medida indireta – o Índice do Sentimento do Investidor ortogonalizado (ISI┴). Seguindo o trabalho de Baker e Wurgler (2006) e Baker et al. (2012), o Índice do Sentimento do Investidor é construído através do principal componente comum de seis proxies de sentimento: o volume de transação, a quota de emissão de capital próprio face a todas as emissões, o número e o retorno no primeiro dia em ofertas públicas iniciais, o prémio de dividendos e o prémio de volatilidade. O Índice de Confiança do investidor considera um questionário a investidores em relação às suas expectativas sobre o mercado financeiro francês.
A análise das rendabilidades agregadas sugere que o CCI é o índice mais adequado, revelando um impacto negativo em todos os horizontes temporais estudados. O ISI┴, por sua vez, não revela um impacto significativo nos três horizontes temporais mais curtos. O estudo das rendibilidades a nível transversal tem em consideração uma série de características de empresas. Neste contexto, os resultados sugerem que o ISI┴ é o índice mais indicado.
A análise a nível transversal indica que em períodos de baixos (altos) valores dos proxies do sentimento do investidor, o posterior retorno é elevado (baixo) em pequenas ações, altamente voláteis, não rentáveis, ações que não pagam dividendos, que apresentam grandes oportunidades de crescimento ou ações que experienciam dificuldades financeiras graves. Os resultados evidenciam também que uma mudança do sentimento do investidor tem um impacto superior nestes tipos de ações. Verifica-se ainda que, de um modo geral e para os dois índices, os padrões de comportamento do sentimento do investidor verificados não refletem uma compensação do risco sistemático clássico.
Palavras-chave: sentimento do investidor; medidas diretas e indiretas; sentimento em rendibilidades agregadas; sentimento a nível transversal; risco sistemático.
vi
Table of Contents
1. Introduction ... 8
2. Literature review ... 12
2.1. Classical finance vs. Behavioural finance ... 12
2.2. Limits of arbitrage ... 14
2.3. Investor sentiment ... 15
2.3.1. Definition of investor sentiment ... 15
2.3.2. Proxies for investor sentiment ... 15
2.3.2.1. Direct measures ... 16
2.3.2.2. Indirect measures ... 17
2.3.2.3. Investor sentiment indexes ... 20
2.4. Empirical findings ... 21 3. Data ... 24 3.1. Sentiment Proxies ... 24 3.2. Firm-level Data ... 28 3.3. Macroeconomic variables... 33 4. Methodology ... 34
4.1. Construction of the sentiment indexes ... 34
4.2. The impact of sentiment in future aggregated market returns ... 35
4.2.1. Normality, autocorrelation and heteroscedasticity of returns... 35
4.2.2. Regression analysis to test the predictive power of sentiment in the aggregate stock market ... 36
4.3. The impact of sentiment in the cross section of stock returns ... 37
4.3.1. Sorts ... 37
4.3.2. Predictive Regressions for Long-Short Portfolios ... 38
vii
5. Empirical Results ... 43
5.1 Sentiment measures – ISI┴ and CCI ... 43
5.1.1. Construction of ISI┴ and CCI ... 43
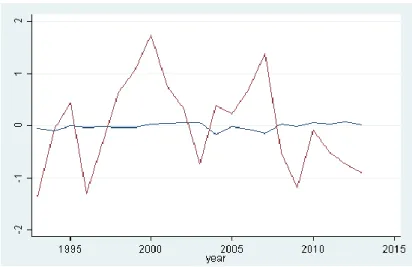
5.1.2. ISI┴ and CCI - Comparison ... 46
5.2. The impact of sentiment in future market returns ... 48
5.2.1. Analyses to normality, autocorrelation and heteroscedasticity of returns ... 48
5.2.2. Regression analysis to test the predictive power of sentiment in the aggregate stock market ... 48
5.3. The impact of sentiment in the cross section of stock returns ... 50
5.3.1. Sorts ... 50
5.3.2. Predictive Regressions for Long-Short Portfolios ... 59
5.3.3. Systematic Risk ... 65
6. Conclusions ... 68
7. References ... 72
1. Introduction
This dissertation explores an important topic of the behavioural finance theory. Understanding whether the prevailing investor sentiment affects future stocks returns is vital to perceive which mechanisms play a major role in financial markets. In this study, sentiment is defined as the emotional investor’s belief about future market returns that are not supported by the existing stock information.
The classical finance theory premise suggests that the financial market is built by rational investors, meaning that all available information is correctly interpreted and that this information is reflected in the securities’ prices (Fama, 1970). This assumption does not take into account that the investor sentiment can play an influence in the investor’s financial decisions. However, the financial market history is full of events that seem to defy this rational view of stock markets. Due to this fact, the behavioural finance theory has emerged and is gaining more relevance (Baker and Wurgler, 2007). Under the behavioural finance assumptions, the financial market is not always rational, allowing prices to diverge from their fundamental values, because they are constructed by the actions of normal investors, which are sentiment-driven in their financial decisions. Additionally, the actions of these normal investors cannot be exploited by rational investors due to arbitrages constraints (Shleifer and Vishny, 1997).
This dissertation aims to study whether sentiment influences future stock returns and determine which stocks are, eventually, more influenced by investor sentiment. Baker and Wurgler (2006) support the idea that exists a group of stocks that, given their characteristics, are usually harder to value and more difficult to arbitrage, making them more susceptible to sentiment waves. The authors find that small, young, high volatility, unprofitable, non-paying, extreme growth and distressed stocks are extremely affected by shifts in sentiment
The main literature regarding this topic of behavioural finance is focused on the U.S. stock market alone (Baker and Wurgler (2006, 2007); Kaniel et al. (2004); Brown and Cliff (2004, 2005)). Others authors investigate the effect of investor sentiment in several international countries in order to understand this effect in a global manner (Bathia and Bredin (2013); Baker et al. (2012)). Generally, the investor sentiment has not been studied in many countries, in an individual way. In order to overcome this gap in the literature and to contribute towards a better understanding
9 of the real effect of investor sentiment in a European context, this dissertation conducts a research specifically on the French market, taking into consideration its own idiosyncratic characteristics.
The period under analysis starts at January 01, 1993 and ends at December 31, 2013. A 20 year investigation period allows the inference of some important sentiment patterns in the French financial market. The data is always presented on a monthly basis. This is true for firm-level characteristics, sentiment measures used as proxies and macroeconomic variables employed to control for macroeconomic effects.
To capture the investor sentiment in the French stock market, two sentiment proxies are used: a direct measure – the Consumer Confidence Index (CCI) - and an indirect measure – the Investor Sentiment Index (ISI┴). Based on Baker and Wurgler (2006) and Baker et al. (2012), the
ISI is a composite sentiment index that tries to capture the effect of investor sentiment in future stock returns, through the common variation of six underlying sentiment measures: share turnover, number and average first-day returns on IPOs, equity share in new issues, dividend premium and volatility premium. In order to control the effect of macroeconomic conditions on stock returns, six raw sentiment proxies are regressed with six macroeconomic variables: industrial production index (IPI), consumer price index (CPI), French gross domestic production (GDP), inflation rate, policy interest rate and employment growth. Thus, originating an orthogonalized Investor Sentiment Index (ISI┴).
Despite not existing any definitive or uncontroversial measure of investor sentiment (Baker and Wurgler, 2006), the choice of the measures used as sentiment proxies is crucial to the quality of the results. In this sense, a comparison is made between the results obtained by ISI┴ and CCI.
Given the fact that these two indexes are constructed based on two different sources of information (ISI┴ relates to market variables and CCI is a survey that directly asks investors about their
expectations concerning financial markets), it is relevant to understand if their results show similar patterns.
This dissertation has two major objectives. The first is to assess the impact of investor sentiment (measured by ISI┴ and CCI) in the aggregated stock market returns for four distinct time
horizons: 1, 6, 12 and 24 months. With this, one intends to investigate the existence of a general influence of investor sentiment that causes a global deviation of market prices from their fundamental values. The confirmation of this proves investor sentiment to be a relevant factor in the introduction of significant risk in the equilibrium of market prices.
10 The second objective is to examine the impact of investor sentiment in different types of stocks, taking into consideration specific firms’ characteristics, namely size, total risk, profitability, dividend policy, asset tangibility and growth opportunities and/or distress. This effect is studied through a cross-section of market returns using three approaches: the sorts analysis, the predictive regressions for long-short portfolios analysis and the systematic risk analysis.
The sorts analysis is conducted for a time horizon of 12 months. It starts by dividing the sample in ten equally weighted portfolios (Baker and Wurgler (2006) suggest that large firms are less affected by sentiment, and hence value weighting tends to obscure the relevant patterns), according to the firms’ characteristics enunciated above and the level of sentiment (measured by ISI┴ and CCI) prevailing at the end of each year. Then, it is calculated the average monthly return
obtained in each decile and in each category in periods of positive and negative sentiment. The regressions for long-short portfolios and the systematic risk analysis are both conducted for four distinct time horizons: 1, 6, 12 and 24 months. In the regressions approach, the portfolios are long on stocks with high characteristic values and short on stocks with low values. The study of the systematic risk is included to analyse the impact of investor sentiment in the cross-section of stock returns in a more rigours manner. This analysis involves the regression of long-short portfolios returns dependent on the market risk premium and the market risk premium interacted with investor sentiment (measured ISI┴ by and CCI). The long-short portfolios are
constructed as enunciated in the predictive regressions for long-short portfolios analysis.
The results obtained in the study of the aggregated market suggest that CCI is the most adequate index in this context. Using this index, investor sentiment reveals a significant negative impact on the aggregated stock returns for all the time horizons under investigation.
Contrariwise, the results obtained in the study of the cross-section market returns show ISI┴ to be the most suitable index for this context. Using ISI┴, both the sorts and the predictive
regressions for long-short portfolio analysis arrive to the same conclusions. Results support that small, high volatility, unprofitable, non-dividend-paying, less tangible, extreme growth and distressed stocks tend to earn subsequent higher (lower) returns after periods of low (high) sentiment. Results also show that changes in investor sentiment have a higher impact on these type of stock returns, which can be explained by the fact that these firms are harder to value and more difficult to arbitrage. These findings are in line with Baker and Wurgler (2006) for the U.S. stock market and with Baker et al. (2012) for six major financial markets (including the French
11 market). As for the systematical risk analysis, the main conclusion obtained is that, in general, the patterns indicated for both sentiment indexes, ISI┴ and CCI, do not reflect a compensation for classical systematic risk.
This dissertation is organized in 6 chapters. The next chapter presents the literature review divided into different subsections to allow for a better understanding of important topics related with behavioural finance and, particularly, with investor sentiment. The literature review starts by enunciating the generic differences advocated by classical and behavioural finance theories and describing the limits of arbitrage that market participants may be subjected to. Then, it is presented the definition of investor sentiment and the different measures used to capture its impact (direct and indirect measures and investor sentiment indexes). The most relevant empirical findings in the field of investor sentiment are also described. Chapter 3 describes the construction of the two sentiment measures, the characteristics portfolios and presents the macroeconomic variables used to control for macroeconomic conditions. Chapter 4 describes the methodology implemented to construct the two sentiment measures and to study the impact of investor sentiment in the aggregated stock market and in the cross-section. Chapter 5 presents the results and their interpretations. Chapter 6 describes the main conclusions achieved and enunciates some suggestions for further investigation.
12
2. Literature review
2.1. Classical finance vs. Behavioural finance
Shiller (2006) divided the financial theory into two distinct paradigms: the neoclassical finance theory, starting around 1960s, which formulates the well-known capital asset pricing model (CAPM) and the efficient market hypothesis; and the behavioural finance, beginning in the 1980s, which tries to include the prospect theory (Kahneman and Tversky, 1979) and other psychological effects to understand financial markets.
Statman (2005) presents the four blocks that built the classical finance theory: (i) financial markets are constituted by rational investors; (ii) these investors participate in an efficient market; (iii) rational investors create their portfolios according to the rules of mean-variance portfolio theory; (iv) the stocks expected returns are depending on risk factors alone.
Traditional finance argues that investors are rational and, therefore, securities must trade at their fundamental values. The fundamental value represents the discounted sum of all future cash flows. The premise that market participants are rational means that all available information is correctly interpreted and that all information is fully incorporated in the security prices (Fama, 1970). The Efficient Market Hypothesis also emphasizes that even if some sentiment-driven investors do exist, their activities will be neutralized by the action of rational investors, taking advantage of arbitrage opportunities (Shleifer, 2000).
However, the history of financial markets is full of events that seems to defy the foundations of traditional finance. In fact, Baker and Wurgler (2007) present an inventory of bubbles and crashes, such as: the Black Monday Crash (October 1987), the Great Crash (1929), Tronics Boom (early 1960s), Go-Go Years (late 1960s), the Nifty Fifty Bubble (early 1970s) and the Dot.com Bubble (1990s). These events occur due to an extreme level or change in stock prices that cannot be explained only by the available information about the financial markets. This contradicts one of the principal ground of the traditional finance theory.
The difficulty to explain these patterns led to the emergence of the behavioural finance theory. Shefrin (2001) says that behavioural finance is the study of how psychology affects financial decision-making process on financial markets.
13 The two basic assumptions of behavioural finance are that (i) investors’ decision-making process is influenced by sentiment (Delong et al., 1990); (ii) exploiting arbitrage opportunities are both costly and risky, Shleifer and Vishny (1997).
One of the main differences that separate traditional finance and behavioural finance is the way how investors are perceived. On the one hand, traditional finance suggests that financial markets participants are rational. On the other hand, behavioural finance beliefs that instead of rational, investors are in fact normal. Statman (2005) suggests that normal investors are influenced by psychological biases and emotions and that this type of investors construct their portfolios not only influenced by expected returns and risk factors. In fact, normal investors include other factors on their decision making process.
The literature about this topic has other terminologies to define financial market participants. Shiller (2003) separates the market participants into two broad categories: smart money and ordinary investors. He argues that smart money participants could not always drive market prices to their fundamental values. The effects of these two types of market participants draw the attention of many researchers. De Long et al. (1990) stated that smart money investor’s activity can intensify the effects of bias investors in the market, rather than make prices go back to their fundamental values. The authors suggest that smart money investors try to anticipate an increase in prices created by the activity of ordinary investors by buying them first. In their study, they also pointed out that rational investors might not always want to offset all of the effects of irrational investors because they are rationally concerned about the risk generated by the irrational investors. Barberis and Shleifer (2003) share the same view about this topic. Goetzmann and Massa (1999) provided empirical evidence that supports the existence of two types of market participants. The authors called them feedback traders and smart money investors.
Despite the abundant terms that define financial market participants, all of them try to separate the financial market into two groups. One that is influenced by psychological factors and sentiment and other that is constituted by professional or institutional traders that construct their portfolios based only in the risk associated and the expected returns of their overall portfolios performance. This dissertation choose to apply the terms rational and normal investors.
14
2.2. Limits of arbitrage
Theoretically, arbitrage is perceived as a riskless activity that allows investors to take advantage of stock mispricing in different markets. By buying and selling the same asset in different markets, with different prices, investors can profit the difference. These investors are called arbitrageurs and their activity is key to understand the securities markets. In fact, the actions of arbitrageurs bring prices to their fundamental values, thus guaranteeing market efficiency (Sharpe and Alexander, 1990).
Shleifer and Vishny (1997) present a remarkable study about this topic that goes against the traditional view of markets’ activity. The authors contest the two main assumption about arbitrageurs’ activity. They demonstrate that rational investors cannot fully exploit arbitrage opportunities and they also reject the idea that arbitrage is a riskless and costless activity.
Many scholars have evaluated the risks and costs that are associated with arbitrage, and linked it with different types of stocks (Wurgler and Zhuravskaya, 2002; D’Avolio, 2002; Jones and Lamont (2002)). Even if investors can perceive arbitrage opportunities, they may be constrained to act due to capital restrictions. In fact, arbitrageurs may be unwilling to take an opposite position in a situation where, in theory, they can gain the most, i.e., when the mispricing they have bet against gets even worse (Shleifer and Vishny, 1997).
Young, small, unprofitable, extreme growth or distressed stocks have shorter trading history, and are more difficult and uncertain to compare with other stocks (Baker and Wurgler, 2006). This makes their valuation highly subjective. The stock market can take a long time to realise these stocks’ true value, and thus, arbitrageurs may face the risk that their positions can be left open for a superior period that they intend to invest, if other investors are hesitant to trade. The risks and costs associated with these types of stocks can, therefore, influence arbitrageurs’ actions, leading prices away from their fundamental values for a long period, making markets inefficient.
15
2.3. Investor sentiment
2.3.1. Definition of investor sentiment
The main literature has defined investor sentiment in a various ways. Baker and Wurgler (2006) define sentiment as the propensity to speculate or as investor’s optimism or pessimism about financial markets. In 2007, the same authors defined investor sentiment as the belief about future cash flows and investment risks that is not explained by the available information. Chang et al. (2009) suggest that investor sentiment corresponds to the investor’s opinion about future cash flows and investment risks, influenced by emotion. Brown and Cliff (2004) consider that sentiment embodies the expectations of market players in relation to a norm: a bullish (bearish) investor presumes returns to be above (below) average.
This dissertation understands investor sentiment as the emotional investor’ belief about future market returns, that are not supported by the existing stock information.
2.3.2. Proxies for investor sentiment
Investor sentiment is not straightforward to measure (Baker and Wurgler, 2007). Therefore, in order to test the effect of investor sentiment, it is necessary to find some imperfect measures and used them as proxies for investor sentiment. The existing literature presents several proxies, but none of them is considered as being definitive and uncontroversial measures. However, there are a set of variables that are most exploited by the scholars in this area.
The proxies for investor sentiment can be divided into two different groups: direct measures and indirect measures, depending on how investor sentiment is captured. Next, it is presented these two types of measures and it is described some of the most accepted proxies in the prevailing literature, in each category.
The sentiment proxies can be studied individually or they can be used to construct a sentiment index that captures the joint influence of several proxies on stock returns. In this chapter, it is also presented a number of research that study the effect of investor sentiment in the stock market, using sentiment indexes that combine information relatively to several proxies of investor sentiment.
16 2.3.2.1. Direct measures
The direct measures capture the investor sentiment by directly asking investors about their expectations about current and future economic environment and stock market conditions. Baker and Wurgler (2007) believe that by asking investors about their optimism or pessimism about the market, it is possible to understand how they formulate their financial decisions.
Consumer confidence surveys are the most explored direct measure in the literature, used to study the impact of sentiment in financial markets (Finter et al. 2011). This measure presents some advantages, such as: data availability (for long horizons periods and for several international countries) and data comparability (because is a measure available for several countries and with similar approaches, allows the comparison of the results obtained in an international level – Schmeling, 2009).
In the case of European countries, the consumer confidence index that is more explored by researchers is the Consumer Confidence Indicator (CCI), published on a monthly basis, by the Directorate General for Economic and Financial Affairs (DG ECFIN). Currently, the CCI is conducted to nearly 40,000 consumers from 29 countries in the European Union, using a questionnaire with 15 questions. The questions introduced in this survey can fall into two different categories (Jonsson and Lindén, 2009): micro-oriented questions (e.g. the financial situation of the household and the intention of the respondent to save money) and macro-oriented (e.g. the general economic situation in the country and unemployment).
Lemmon and Portniaguina (2006), Schmeling (2009), Brathia and Bredin (2012), Fisher and Statman (2003), conducted important studies about investor sentiment, using CCI as a proxy for investor sentiment.
Lemmon and Portniaguina (2006) concluded that over the last two decades, the returns on small stocks and future macroeconomic activity can be explain by consumer confidence surveys.
Brathia and Bredin (2012) inspected the relationship between investor sentiment and the G7 stock markets, and showed that investor sentiment (measured through CCI) exhibits a negative relationship with future sock returns. In fact, their results are in line with the prevailing existing literature: periods of high (low) sentiment are followed by low (high) stock returns.
17 2.3.2.2. Indirect measures
Another way to capture investor sentiment is through the study of market variables. In this approach, the investor sentiment is inferred from market statistics, like price movements and trading patterns.
Beer and Zouaoui (2012) pointed out some advantages of using indirect measures. The authors suggest that these measures are easier to construct, because they correspond to simple market data that is widely available for different countries. Investor’s decisions can be observed in real time and show the power of market participants and their bull or bearish’ behaviour towards the market.
The volatility premium is an indirect measure that is used to capture investor sentiment. This variable identifies investor demand between high and low periods of volatility (Corredor et al. 2013). The motivation for this variable is related with the limits of arbitrage and the valuation difficulty. High volatile stocks are the ones that can experience extreme fluctuations in their valuation. Therefore, noise traders can defend extreme values for this type of stocks, according to their current optimism or pessimism towards the market. Volatile stocks are also the ones that are riskier and costlier to arbitrage (Baker and Wurgler, 2012). Corredor et al. (2013) suggest that volatility premium is expected to be directly related with investor sentiment.
This variable is analogous to the dividend premium, applied in the work presented by Baker and Wurgler (2004, 2006), and is a measure of investor demand between dividend-paying and non-paying stocks. Paying firms are usually associated with larger, more profitable firms with weaker growth opportunities (Baker and Wurgler, 2006). The dividend premium is seen as a proxy for the relative investor demand for stocks with these characteristics. Dividend premium and volatility premium are highly inversely related.
The market turnover, or liquidity, is consider a proxy for investor sentiment. In fact, in a market with short-selling constraints, high liquidity is associated with the actions of normal investors that are optimistic about the market. This means that high liquidity can be seen as a symptom of overvaluation (Baker and Stein, 2004). Trading volume is associated with differences of opinion and therefore associated with valuation levels (Scheinkman and Xiong, 2003). In fact, Jones (2002) exposes that high levels of liquidity are linked with low future market returns. Summarizing, the
18 literature suggests that market turnover is inversely related with sentiment: periods of high (low) sentiment lead to low (high) future stock returns.
The outstanding returns earned in the first day of Initial Public Offerings (IPO) have been a phenomenon that is hard to explain without considering investor sentiment (Baker and Wurgler, 2007). Ritter (1998) indicate that high first-day returns on IPOs is in fact a well-known pattern related with the procedure of going public. The author also suggests that on IPOs market, it is possible to distinguish three patterns: short-run underpricing, long-run underperformance, and cycles in volume and the level of underpricing. The last pattern, also known as “Hot Issue” market, suggest that first-day returns and volume of IPOs are extremely cyclical. In fact, high first-day returns follow periods of high volume on IPOs. This pattern is difficult to explain under rational explanations. These reasons combined indicate that IPOs market is viewed as sensitive to sentiment (Baker and Wurgler, 2006). High first-day returns are considered a signal of investor enthusiasm and, on the contrary, low first-day returns are seen as an indication of market timing (Stigler, 1964 and Ritter, 1991). Baker and Wurgler (2012) pointed out that the theoretical reason to use the volume of IPOs is easier to understand: insiders and long-run shareholders are prone to go public in periods when valuations are greatest, which is likely in periods when sentiment is highest.
In addition to the two proxies mentioned, the existing literature presents another variable that measures the financing activity in order to capture sentiment. The equity issues over total equity and debt issues represents the proportion of equity issues in the total issues (equity or debt). It is believe that the choice between financing through equity or debt is related with cost of capital concerns. In fact, Baker and Wurgler (2000) reveal that periods when equity is preferred over debt as a financing source are followed by periods of low stock market returns. The authors could not find an explanation for this situation under the Efficient Market Hypothesis, so the predictive power of equity share indicates inefficiency and reveals that firms time the market when issuing new securities.
The closed-end fund discount (CEFD) is a measure that has been widely accepted in the literature as a proxy for investor sentiment. A closed-end fund differs from an open-end fund because the first issues a fixed number amount of shares and to redeem them the investor has to sell their shares directly to others investors, instead of trade them with the fund itself. The
closed-19 end fund discounts represent the average difference between the net asset value (NAV) and their market prices (Baker and Wurgler 2006, 2007).
Lee et al. (1991) study the so called end fund puzzle, and point out that the closed-end funds are usually sell at a discount of 10 to 20 percent. In their work, the authors tested the theory that proposes that changes in individual investors sentiment concerning with closed-end fund and other securities are the reason for the fluctuations of prices and discounts on closed-end funds. Higher discounts are associated with periods when investors are pessimistic about stock market and, inversely, discounts tend to decrease in periods when investors are optimistic about the marker. The authors conclude that closed-end fund discount is in fact a measure of investor sentiment, and add that investor sentiment may affect the prices of stocks just as the prices of closed-end funds.
Other scholars study the closed-end fund discount as a measure of investor sentiment. Zweig (1973) argues that the closed-end fund market is dominated by non-professionals traders and that the CEFD reflects their expectations. A smaller discount is associated with a bullish investors’ behaviour and as the discount increases, it means that investors are getting pessimistic about future returns, as a compensation for the buyers (Baker and Wurgler, 2007). The prevailing understanding about the closed-end fund discount is that CEFD may be used as a sentiment proxy and it is inversely related to the sentiment factor (De Long et al (1990), Neal and Wheatley (1998) and Lee et al (1991)).
In contrast to these studies, Qiu and Welch (2004) analyse the closed-end fund discount as a measure of investor sentiment, and concluded that CEFD does not appear to be a suitable proxy of investor sentiment, when using UBS/Gallup Investor sentiment survey data.
Baker and Wurgler (2007) indicate that individual investors are expected to be more influenced by sentiment than professional or institutional investors. Greenwood and Nagel (2009) used age as a proxy for managers’ investment experiences, and conclude that younger and unexperienced investors tend to buy more overvalued assets during bubble periods than their older and more experienced colleagues. Other authors also based their work in retail investor trades. Barber et al. (2009), on their work on stock trading behaviour of individual investors, concluded that: individual investors underperform comparatively to a benchmark; exhibit the disposition effect (sell winners too soon and hold losers for too long); are extremely affected by past returns in their
20 portfolio construction; tend to repeat past behaviours that they relate with pleasure and avoid past behaviours that generated pain; and tend to hold undiversified stock portfolios.
The choice between “safe” securities and “risky” securities has been another measure of sentiment. This can be viewed studying the mutual fund flows, in order to understand how mutual fund investors allocate their portfolios across fund categories (Baker and Wurgler, 2007). Frazzini and Lamot (2008) use mutual fund flows as a measure of individual investor sentiment of different stocks and show that high periods of sentiment lead to low future stock returns. The authors found that funds that hold a particular stock that experienced strong inflows, the future return of that stock is relatively poor. Brown et al. (2003) found evidence that equity fund flows are inversely related with bearish investor behaviour.
The put-call ratio is also been used as a proxy of investor sentiment (Finter et al. 2011) and represent the ratio of the number of put option over all options (put or call) transacted on the market (Bathia and Bredin, 2012). Finter et al. (2011) propose that the put-call ratio can be seen as a market barometer. In fact, a high (low) put-call ratio is a symptom of investor’s pessimism (optimism) about the market.
Baker and Wurgler (2007) point out that insider trading can be seen as a way to capture investor sentiment. It is easy to understand that corporate managers are the ones that are in the best position to assess their company value. In this sense, looking at executives’ personal portfolio can reveal their opinions about stock valuation. Therefore, the actions of this particular type of investor can contain a systematic sentiment component.
2.3.2.3. Investor sentiment indexes
As mentioned earlier, none of the investor sentiment proxies is considered definitive and uncontroversial. For this reason, the existing literature presents several research that study the joint effect of several proxies, instead of conduct a study based only on one measure, to capture investor sentiment. Researchers construct they own sentiment indexes, in order to overcome some of the limitations identified in the studies that only consider one investor sentiment variable.
The four above studies are examples of research that apply several proxies on their methodology.
21 Baker and Wurgler (2006, 2007) studied the U.S. financial market and constructed a composite sentiment index that is based in the common variation in six underlying proxies for sentiment: the closed-end fund discount, NYSE turnover, the number and average first-day returns on IPOs, the equity share in new issues and the dividend premium.
Baker et al. (2012) construct investor sentiment indices for six major stock market, such as, Canada, France, Germany, Japan, the U.K. and the U.S. The authors choose to investigate investor sentiment through the study of four sentiment measures: volatility premium, the total volume of IPOs and their first-day returns and market turnover.
Corredor et al. (2013) studied the French, German, Spanish and U.K. markets using three sentiment proxies: a direct measure such as, the Consumer Confidence Index, and two indirect measures, market turnover and volatility premium.
2.4. Empirical findings
In this section, it is presented some of the most relevant findings about investor sentiment and its effects in the financial markets. The studies presented constitute important sources of inspiration to this dissertation, according to the methodology implemented, the sentiment proxies applied and the markets under investigation.
Baker and Wurgler (2006) study how investor sentiment affects the cross-section of stock returns. The authors conduct this study for the period between 1962 through 2001, by collecting firm’s characteristics, on a monthly basis, and sentiment proxies, measured annually.
Firm’s characteristics are divided in groups: returns, size and age, profitability, dividend policy, asset tangibility and growth opportunities and/or distress. This division are made in order to understand which stocks are more influenced by sentiment. It was formed a composite index of sentiment that is based on the common variation in six underlying proxies for sentiment: the closed-end fund discount, NYSE share turnover, the number and average first-day returns on IPOs, the equity share in new issues and the dividend premium.
The sentiment index is constructed by applying PCA, in order to capture the first principal component common among the six proxies. The relative timing of the variables is also considered,
22 giving the fact that some variables may take longer to reveal the same sentiment than others. In order to distinguish between a common sentiment component and a common business cycle, the raw sentiment proxies are regressed with some macroeconomic conditions (growth in industrial production index, growth in consumer durables, nondurables, and service, and a dummy variable for NBER recessions).
The main conclusion that arises from this study is that the cross-section of future stock returns is conditional on beginning-of-period proxies for sentiment. Periods of high sentiment are followed by relatively low subsequent returns for young, small, unprofitable, non-dividend-paying, high volatility, extreme growth, and distressed stocks. These types of stocks are considered to be attractive to optimistic investors and speculators and, on the contrary, unattractive to arbitrageurs. The authors also suggest that several firms’ characteristics show strong conditional patterns with future stock returns, after controlling for investor sentiment.
Baker et al. (2012) conduct a study to explore the effect of global and local components of investor sentiment on six major stock markets: Canada, France, Germany, Japan, United Kingdom and the United States, for a period starting in 1980 and ending in 2005. The authors construct a total sentiment index for each of the countries under investigation, by applying PCA analysis in order to obtain a first principal component common among the four measures used as proxies for investor sentiment. These variables are the volatility premium, the market turnover and the volume and first-day returns on IPOs. Then, the authors formed a global sentiment index that incorporates the first principal component of the six total indices.
The authors conclude that the evidence suggests that investor sentiment affects the time series of the analysed markets returns, and also support the idea that investor sentiment influences the cross-section of international stock markets. Specially, the results predict that the future market returns of high volatility, small, distressed or growth stocks are inversely related with both, total or global, sentiments.
Corredor et al. (2013) analysed the investor sentiment in four important European markets: France, Germany, United Kingdom and Spain. The authors construct a sentiment index for each the above mentioned countries, using three proxies of investor sentiment, such as: volatility premium, market turnover and the consumer confidence index. The period under analysis start in 1990 and ends in 2007.
23 The stock characteristics considered were the book-to-market ratio, size (measured as the stock market capitalization), volatility (measured as the last twelve months’ standard deviation) and the dividend per share ratio. Each of the above firm’s characteristics is used to construct long-short portfolios. The impact of sentiment is then tested trough regression analysis, for different time horizons (6, 12 and 24 months).
The study concludes that investor sentiment strongly affects future returns of firms that are hard to value and difficult to arbitrage, when the selected markets are analysed separately. Despite this conclusion, the results differ across the countries evaluated, making clear that the results are influenced by the choice of the measures used to construct the sentiment index.
The authors also report another important finding in this research. There is evidence that factors, such as cultural or institutional differences, have to be taking into account when studying the sentiment effects.
Schmeling (2009) examined if consumer confidence, used as a proxy for investor sentiment, affects expected stock returns, in 18 industrialized countries (including the French market). On average, the study concludes that sentiment is a significant predictor of expected returns. The author also show that this effect have much more impact for short and medium term horizons (one to six months). This effect is diminished for 12 to 24 months horizons.
Despite the general conclusion that sentiment affects future stock returns, the magnitude of this effect varies across countries (in some countries, sentiment does not exhibit predictive power for future stock returns). For this reason, Schmeling (2009) explore some possible factors that strength the relation between sentiment and stock returns. He found that the impact of sentiment on future stock returns is higher for countries that are culturally more influenced by the actions of herd-like investment behaviour and in countries with less efficient regulatory law or less market integrity.
24
3. Data
This dissertation studies the effect of investor sentiment in the French market. The study of the French market is attractive for several reasons. First, most of the main studies in this area of behavioural finance are focused on the U.S. market. Hence, by focusing on a European country this study contributes to the current literature, allowing for a more global understanding of this topic and providing results to compare and contrast to the American context. Secondly, due to limited time and resources, by focusing on a single country a more extensive and careful study could be performed. Data availability had to be taken into consideration, thus implying the selection of a major European financial market. The French market meets such criteria and is a country that has yet to be solely analysed.
The main literature in this field only explores the effect of investor sentiment in the French market when studying this effect in a global context and incorporating other countries in the study. Bathia and Bredin (2013) examined the relationship between investor sentiment and G7 stock market returns. Baker et al. (2012) explore the effect of global and local components of investor sentiment on major markets, as Canada, France, Germany, Japan and the United Kingdom.
In this sense, this dissertation aims to overcome this gap in the literature by conducting a research specifically on the French market, considering its own idiosyncratic characteristics.
The data period under investigation begins on January 01, 1993 and ends on December 31, 2013, combining a total of 252 months. The data is treated on a monthly basis and incorporates all French stocks present in the Euronext Paris stock exchange.
3.1. Sentiment Proxies
Up until now, the existing literature in the area of investor sentiment and its explanatory power of stock returns has not found any final and uncontroversial measures to capture investor sentiment. In fact, there exists a large body of proxies that seem to be adequate in explaining future stock returns. It is important to notice that the sentiment proxies’ adequacy is depending on the market that is under study, i.e., different proxies may be accurate in studying markets with different characteristics (Corredor et al. 2013).
25 Sentiment proxies can be segmented in two different categories. There are explicit measures, resulting by directly asking investors what their expectations are about the market, as in investor surveys, and indirect measures. These measures attempt to capture the effect of investor sentiment in future stock returns by studying patterns in market variables.
This dissertation tries to analyse the effect of investor sentiment using two different indexes of investor sentiment – one direct measure and one indirect measure. Following Baker and Wurgler (2006) and Baker et al. (2012), a sentiment index is formed using indirect measures of investor sentiment. These proxies include: share turnover (TURN), number of IPOs (NIPO) and its average first-day returns (RIPO), the share of equity issues (S), dividend premium( 𝑃𝐷−𝑁𝐷) and volatility premium (PVOL). As a direct measure it is considered the effect of Consumer Confidence Index for the French market.
This section presents each of the proxies used, the data necessary and the methodology followed to construct them. In the appendices section, table 1 exhibits all the variables that are necessary to collect for the construction of the sentiment proxies.
Market turnover (TURN) is the natural log of total turnover, i.e., total euro volume traded (VO) during a month over the total market capitalization (WC08001) of the previous month. The monthly market turnover (TURN) is defined as mentioned in equation (1):
𝑇𝑈𝑅𝑁𝑡 = ln (𝑡𝑢𝑟𝑛𝑜𝑣𝑒𝑟 𝑏𝑦 𝑣𝑜𝑙𝑢𝑚𝑒𝑡⁄𝑀𝑎𝑟𝑘𝑒𝑡 𝐶𝑎𝑝𝑖𝑡𝑎𝑙𝑖𝑧𝑎𝑡𝑖𝑜𝑛𝑡−1) (1) Share turnover can simply be viewed as market liquidity. Baker and Stein (2004) point out that share turnover can be used as a proxy for investor sentiment. In a market with short-sales constraints, opening and closing a position is desirable, so sentiment-driven players are prone to trade, thus adding liquidity to the market. The authors suggest that investors tend to trade more when they are optimistic rather than when they are betting that the stock price will fall. In this sense, Scheinkman and Xiong (2003) stated that trade volume suggests differences of opinion among the market players. Share turnover and stocks returns are believed to be inversely related (Jones, 2002).
The number of IPOs (NIPO) over a given month and the average first-day return of these IPOs (RIPO) is a measure of investor’s enthusiasm towards the market. Outstanding first-day returns on IPOs, or underpricing, are associated with the investor’s level of optimism or pessimism. Market players are interested in timing the equity market for periods when valuations are great,
26 which presumably occurs in times when investor sentiment is high (Baker, et al., 2012). Baker and Wurgler (2006) propose that IPO volume is directly related with sentiment. Stigler (1964), Ritter (1991) and Loughran et al. (1994) have also debated which factors are behind the volume and the return of IPOs.
NIPO represents the number of IPOs in each month and is extracted at SDC. Equation (2) presents the computation of this proxy, following the methodology implemented by Baker and Wurgler (2006):
𝑁𝐼𝑃𝑂𝑡 = ∑ 𝑁𝑢𝑚𝑏𝑒𝑟 𝑜𝑓 𝐼𝑃𝑂𝑠𝑡 (2) RIPO follows the methodology presented by Baker, et al. (2012), and is calculated as shown in equation (3):
𝑅𝐼𝑃𝑂𝑡 = 𝐹𝑖𝑟𝑠𝑡 𝑡𝑟𝑎𝑑𝑖𝑛𝑔 𝑝𝑟𝑖𝑐𝑒𝑡− 𝑂𝑓𝑓𝑒𝑟 𝑃𝑟𝑖𝑐𝑒𝑡
𝑂𝑓𝑓𝑒𝑟 𝑃𝑟𝑖𝑐𝑒𝑡 (3) The equity-share of new issues (S) represents the percentage of gross equity in total capitalization after the issuing, using data from SDC. Baker and Wurgler (2000) show that high values of equity share are followed by low market returns. When sentiment is high, equity is favoured despite debt, in order to reduce the cost of capital. Equation (4) presents the calculation of this proxy:
𝑆𝑡 = 𝐶𝑜𝑚𝑚𝑜𝑛 𝐸𝑞𝑢𝑖𝑡𝑦𝑡
𝑇𝑜𝑡𝑎𝑙 𝐶𝑎𝑝𝑖𝑡𝑎𝑙𝑖𝑧𝑎𝑡𝑖𝑜𝑛𝑡 (4) The dividend premium, 𝑃𝐷−𝑁𝐷, is calculated as presented by Baker and Wurgler (2006), using raw data from Datastream. Firms are grouped as payers firms and nonpayers firms, taking into account the dividends per share of each firm. The dividend premium is the natural log of the difference of the average market to book ratio of payers and the average market to book ratio of nonpayers. Equation (5) presents the proxy computation:
𝑃𝐷−𝑁𝐷 = ln( 𝑀𝑇𝐵𝑉̅̅̅̅̅̅̅̅𝑁𝑜𝑛𝑝𝑎𝑦𝑒𝑟 − 𝑀𝑇𝐵𝑉̅̅̅̅̅̅̅̅𝑁𝑜𝑛𝑝𝑎𝑦𝑒𝑟) (5) Baker and Wurgler (2004) defend that the dividend premium can be used as a proxy for the relative demand for dividend paying stocks and suggest that the dividend premium is inversely related with sentiment. The explanation lies with the fact that firms are more predisposed to pay
27 dividends when they are at a premium rather than when they are at a discount (Fama and French, 2001).
The volatility premium represents the natural log of the ratio of the value-weighted average market to book ratio of high volatility stocks to that of low stocks. To do so, it is calculated the monthly stock returns and their variance. Then, the data is divided into deciles and it is computed the average market to book ratio of the top three deciles of the variance and the bottom three deciles. Equation (6) shows the construction of this proxy:
𝑃𝑉𝑂𝐿𝑡 = ln 𝑀𝑇𝐵𝑉̅̅̅̅̅̅̅̅↑3𝑑𝑒𝑐𝑖𝑙𝑒𝑠 𝑀𝑇𝐵𝑉
̅̅̅̅̅̅̅̅↓3𝑑𝑒𝑐𝑖𝑙𝑒𝑠 (6) The premise that investor sentiment affects stocks in a different way according to their characteristics justifies the adoption of this proxy. Particularly, younger, small, unprofitable, non-dividend paying, high volatility, extreme growth and distressed stocks tend to have low subsequent returns when sentiment is high (Baker and Wurgler, 2006). These types of stocks are considered the hardest to value and the most difficult to arbitrage. Therefore, it makes sense that high volatile stocks are prone to be more affected by noise traders, because they can defend extreme valuations according to their beliefs about the market. Baker et al. (2012) suggest that high volatile stocks tend to be less attractive to arbitrageurs due to the high transaction costs associated and the higher risk related with these types of stocks.
The Consumer Confidence Index (CCI), from the Directorate General for Economic and Financial Affairs (DG ECFIN), is employed in order to introduce an explicit measure of investor sentiment. For the French market, this measure is based on the answers of 3300 participants asked about their past and future financial private situation, past and future economic situation and about private consumer behaviour. For this reason, this index is considered to point out the level of consumers’ enthusiasm towards the economic state, portrayed by their saving and spending actions.
The CCI has been explored by the main literature. In fact, Schemling (2009) presents a paper studying the effect of investor sentiment in future returns in 18 industrialized countries. This research reports that CCI presents a significant explanatory power of expected returns, on average across the examined countries. The author shows that in periods of high (low) sentiment, future stock returns are likely to be lower (higher) on aggregate stock market returns. This evidence is
28 also seen for returns of value, growth and small stocks and for different predicting periods of analysis. In 2006, Lemmon and Portniaguina conduct an important study on this field, using consumer confidence as a degree of investor optimism. The authors conclude that consumer confidence, used to capture the effect of investor sentiment, can in fact predict the returns of small stocks and stocks with low institutional ownership, during the last 25 years. This research makes a link between their results and those obtained using noise-trader sentiment models.
3.2. Firm-level Data
To study how investor sentiment affects stock returns in the cross-section, a number of specific stock characteristics has to be gathered so as to assess the impact of investor sentiment on them.
The firm-level data is collected from Datastream. The sample includes all common stocks of companies listed on the Euronext Paris (dead or alive). To collect the data several filters are applied: category (Equities), exchange (Euronext.liffe Paris), market (France) and type (Equity). This search yielded a total of 2139 firms. However, it is necessary to remove from the sample all companies that are included in the database after 2013 (end of period under analysis) and those that do not present sufficient available data to calculate the variables necessary to construct the portfolios. Thus, this research examines a final set of 2013 companies.
Following Baker and Wurgler (2006) and Baker et al. (2012), the data is selected to study a specific group of firm-level characteristics, namely: size, profitability, dividend policy, asset tangibility and growth opportunities and/or distress.
In the appendices section, Table 2 presents all variables that are collected in order to construct the firm-level characteristics portfolios and to compute the stock market returns.For each variable, it is presented the source and the code in the database. The data is collected on the first day of each month and is computed on a monthly basis. Table 3 displays the summary statistics (mean, standard deviation, minimum and maximum) obtained for the stock market returns and for each portfolio. Table 3 also presents the means obtained for the stock market returns and for each portfolio for two periods: from 01 January, 1993 through 31 December, 2003 and from 01 January, 2004 through 31 December, 2013.
29 To calculate the stock market returns it is obtained the Total Return Index (RI) from Datastream (RI already incorporates dividends in is calculation). Despite not being a salient characteristic, Momentum is calculated and presented as a control variable of known mispricing patterns. Momentum (MOM) is defined as the accumulation of 11 monthly returns from 12 to 2 months prior to the given month
The Size portfolio represents the firm’s size. Size is measured by the market equity (WCO8001) from Datastream. Datastream calculates market equity as the stock’s price multiplied by common shares outstanding.
The Total Risk portfolio embodies the risk (systematic or non-systematic) that each firm is subjected to. Total risk is calculated as the standard deviation of monthly returns for 12 months, from January to December each year.
The Profitability portfolio is incorporated to study the impact of investor sentiment in profitable firms and in unprofitable ones. This is reflected using the return on equity ratio (E+/BE), which is positive for profitable firms and zero for unprofitable ones. Earnings (E) is calculated as net income before extraordinary items/preferred dividends (WC01551) plus deferred income taxes and investment tax credit on income statements (WC04101), and minus preferred dividend requirements (WC01701). Book equity (BE) is measured as the sum of total shareholders’ equity (WC0395) and deferred taxes on balance sheets (WC03263). It is also included a profitability dummy variable (E>0), which takes the value of 1 for profitable firms and 0 for unprofitable firms. The dividend policy portfolio is constructed to distinguish the impact of investor sentiment on dividend-paying firms and on non-dividend-paying firms. To study this impact, it is calculated the dividends to equity ratio (D/BE). Dividends (D) are measured as dividends per share (DPS) times the number of shares outstanding (WC05301). Equity is represented by book equity (calculated as mentioned above). In this analysis, it is also included a dividend payer dummy (D>0), which is set as 1 for dividend paying firms and 0 for firms that do not pay dividends.
Asset tangibility is a proxy for valuation difficulties (Baker and Wurgler, 2006). Firms that are constituted mainly of intangible assets are considered the ones harder to evaluate, making them more sensitive to investors’ concerns about their value (Baker et al., 2012). Firms with more
30 tangible assets are considered easier to assess their true value. Thus, these firms’ value is not dependent on each investor sentiment considerations.
To study the impact of investor sentiment in firms with less tangible assets in opposition to firms with high values of tangible assets it is constructed two portfolios. The PPE/A portfolio, which is based on the ratio of property, plant and equipment (WC02301) over assets (WC02999) and the RD/A portfolio, which is based on the ratio of research and development (WC01201) over assets. A high PPE/A ratio means that a firm is constituted predominantly of tangible assets. On the other hand, a high RD/A ratio means that a firm is constituted mainly of intangible assets.
Following Baker and Wurgler (2006), the impact of investor sentiment on firms with growth opportunities and in distress is studied through the joint analysis of two portfolios: the book to market ratio portfolio (BE/ME) and the external finance ratio portfolio (EF/A). The elements of the book to market ratio are calculated as stated earlier. External finance, represents external financing (WC04500) over total assets. Growth opportunities and distress portfolios are analysed together due to their particular interactions. In fact, low values of book to market ratio may be a signal of growth opportunities and high values may indicate distress. The book to market ratio is also related to a firms’ valuation that may vary depending on any source of mispricing or rational expected returns. Likewise, external finance may suggest distress (when EF/A takes low values) or may reflect growth opportunities (when EF/A takes high values). External finance also suggests generic misevaluations because market timing promotes high values of external finance.
31
Table 3.
Summary Statistics of stock market returns and firm-level characteristics portfolios, 1993-2013
The table presents the summary statistics (mean, standard deviation, minimum and maximum) for stock market returns and for each firm-level characteristics portfolios constructed. The data is computed on a monthly basis. Stock market returns are computed as monthly changes in the Total Return Index (RI) from Datastream. Momentum (MOM) is defined as the cumulative return for the 11-month period between 12 and 2 months prior to t. The Size portfolio
represents the firm’s size. Size is measured by the market equity (ME) from Datastream.The Total Risk portfolio
embodies the total risk that each firm is subject. Total risk (𝜎) is calculated as the standard deviation of monthly returns for 12 months, from January to December each year. The Profitability portfolio is constructed through the return on equity ratio (E+/BE) for firms with positive earnings. Earnings (E) is calculated as net income before extraordinary items/preferred dividends (WC01551) plus deferred income taxes and investment tax credit on income statements (WC04101), and minus preferred dividend requirements (WC01701). Book equity (BE) is measured as the sum of total shareholders’ equity (WC0395) and deferred taxes on balance sheets (WC03263). A profitability dummy is introduced and is equal to 1 for firms with positive earnings and equals 0 for unprofitable firms. The dividend policy portfolio is constructed trough the dividends to equity ratio (D/BE). It is incorporated a dividend payer dummy (E>0). Dividends (D) are measured as dividends per share (DPS) times the number of shares outstanding (WC05301). Equity is represented by book equity. The dividend payer dummy is set 1 to dividend-paying firms and
0 to firms that do not pay dividends. Asset tangibility is measured by the PPE/A ratio portfolio and by the RD/A ratio
portfolio. Plant, property and equipment (WC02301) and research and development (WC01201) are scaled by assets (WCO2999). The growth opportunities and/or distressed are measured by the BE/ME ratio portfolio and by the EF/A ratio portfolio. The book-to-market ratio (BE/ME) is obtained as the book equity over market equity for the 12 months prior to t. External finance (EF) represents external financing (WC04500) over total assets.
32
Full Sample Subsample Means
Variable Obs. Mean Std. Dev. Min. Max 1993-2003 2004-2013
Returns
𝑹𝒕(%) 296,786 1.16 28.41 -99.92 8,433.33 1.43 0.92
𝑴𝑶𝑴𝒕−𝟏(%) 275,944 12.02 96.44 -301.59 8,412.50 13.46 11.18
Size portfolio
𝑴𝑬𝒕−𝟏(€𝑴) 203,438 2,00 8.24 0.00 148.47 1.67 2.32
Total risk portfolio
𝝈𝒕−𝟏(%) 507,264 23.15 14.69 11.10 78.98 23.73 22.51
Profitability portfolio
𝐄 +/𝐁𝐄𝒕−𝟏(%) 45,258 0.16 1.23 0.00 75.04 0.13 0.17
𝑬 > 𝟎𝒕−𝟏 507,276 0.10 0.31 0.00 1.00 0.07 0.14
Dividend policy portfolio
𝐃/𝐁𝐄𝒕−𝟏(%) 119,967 0.36 0.16 0.00 19.28 0.04 0.04
𝑫 > 𝟎𝒕−𝟏 307,266 0.51 0.50 0.00 1.00 0.61 0.44
Asset tangibility portfolios
𝑷𝑷𝑬/𝑨𝒕−𝟏(%) 172,142 45.70 42.60 0.00 785.12 50.45 41.85
𝑹𝑫/𝑨𝒕−𝟏(%) 44,915 6.27 11.82 0.00 174.73 5.18 6.91
Growth opportunities and/or distress portfolios
𝑩𝑬/𝑴𝑬𝒕−𝟏 139,376 1.05 10.05 0.00 913.47 0.88 1.17
33
3.3. Macroeconomic variables
Chen et al. (1986) conduct a study to investigate if macroeconomic variables are priced in the stock market. They conclude that stock returns are in fact exposed to systematic economic news and that these variables are priced in the stock market.
In order to control the effect of macroeconomic conditions on stock returns, six macroeconomic variables are collected. The Industrial Production Index (IPI) measures the monthly variation of quantities produced by the French industry. The Consumer Price Index (CPI) measures the experienced cost of living in the French market. The Gross Domestic Production (GDP) represents the health of the French economy. The inflation rate (INFR) in the French market stands for the rising or falling of the goods and services’ monthly prices, and consequently represents the purchasing power. The policy interest rate (INTR) reflects the foundations of the French monetary policy. The employment growth (EG) reflects the monthly variation in employment in France. The macroeconomic variables are used to construct the orthogonalized Investor Sentiment Index (ISI┴) and are employed in the regression analysis, which are conducted for the Consumer
Confidence Index (CCI), in the aggregated stock market.
In the appendices section, table 4 presents the source and the code in the database for each macroeconomic variable. The data is obtained for the first day of each month on a monthly basis for the period of the examination of this dissertation (from 01 January, 1993 through 31 December, 2013)
34
4. Methodology
The methodology applied in this dissertation follows mainly the work presented by Baker and Wurgler (2006) and Baker et al. (2012). However, this research introduces some differences comparatively to the works mentioned. In fact, this dissertation measures sentiment through two sentiment indexes, which are constructed based on distinct sources of information. The investor sentiment index is based on market data and the Consumer Confidence Index is a survey that directly asks investors their expectations about the stock market. The inclusion of these two sentiment measures is made in order to investigate potential differences in the impact of sentiment in the aggregated stock market returns and in the cross-section of stock returns, when sentiment is measured by an indirect measure and when sentiment is captured by a direct measure.
4.1. Construction of the sentiment indexes
The methodology applied in this dissertation begins with the construction of two sentiment indexes: the Investor Sentiment Index (ISI) and the Consumer Confidence Index (CCI).
CCI involves the standardization of the raw data, as applied by Schemling (2009). The standardization guarantees that the CCI coefficient has a zero mean a standard deviation of 1. This step aims to increase the similarity of the procedures used in the construction of both indexes.
Following the methodology applied by Baker and Wurgler (2006), the ISI is constructed using a Principal Component Analysis (PCA). The six proxies used as sentiment measures (market turnover, number and average first-day returns on IPOs, the share of equity issues, dividend premium and volatility premium) contain a sentiment component, as well as its own idiosyncratic components, non-sentiment related. The PCA allows isolating the proxies’ data, thus creating an index that represents the common sentiment component among the six proxies.
Baker and Wurgler (2006) suggest that some variables take longer to reveal a shift in sentiment than others. More specifically, the authors find that proxies that reflect firm supply decisions (TURN, RIPO and 𝑃𝐷−𝑁𝐷) are prone to lag behind proxies that represent direct choices by investors (S and NIPO).