Mariam Eissa
Análise do ciclo de vida usando
Lourenço modelo Caso da cidade
de Damasco (1960-2015)
Mariam Eissa
junho de 2015
UMinho | 2015
Análise do ciclo de vida usando Lour
enço
modelo Caso da cidade de Damasco (1
960-20
1
junho de 2015
Dissertação de Mestrado
Mestrado Internacional em Ambiente Construído Sustentável
Trabalho efetuado sob a orientação do
Professora Doutora; Júlia Maria Brandão Barbosa
Lourenço
Mariam Eissa
Análise do ciclo de vida usando
Lourenço modelo Caso da cidade
de Damasco (1960-2015)
iii
Dedication
I dedicate this Master dissertation to my parents; Mohamad Hadi Eissa and Salma Eissa for their great support in my educational journey, to my siblings; Adel, Hadel and Obada
for their loving and caring.
Also, I dedicate this study to my friends; Lujain, Eiad, Nahed and Housam for their great help.
iv
ACKNOWLEDGEMENT
I would like to present my greatest thanks for my supervisor Júlia Maria Brandão
Barbosa Lourenço, who have given my all the support, encouragement and help.
Also, I would like to thank my professors in the Sustainable Built Environment
International Master for their dedication through the learning process of this master.
I am also grateful for the Department of civil engineering members for their help and support.
I wish to express my sincere thanks for President Jorge Sampaio and Doctor Helena
Barroco for their continuous encouragement for me and my colleagues.
I take this opportunity to express gratitude to the entire global platform for Syrian
student for their help and work to provide this opportunity for us to complete out studies.
I also place on record, my sense of gratitude to one and all, who directly or indirectly have lent their hand in this venture.
v
ABSTRACT
Life cycle assessment is considered a modern concept in recent times. The life cycle of urban areas may be built upon mathematical equations that can deal with the assumptions and data. But it can also be built upon methods and tools to study urban changes and finding statistics on the development and modernization of the city’s urban form and structure. This dissertation presents the state of the art, and the methodologies and the results of studying the life cycle analysis of the capital of Syrian Arab republic, which is based upon studying the urban changes that happened in the city together with the developments of its master plan over the years 1960-2015. Using the Lourenço’s model for study, this model can be represented as a graphical tool to assimilate the progress of city evolution phases in order to monitor the behavior of an urban area and its planning process, by comparing the idealistic analysis from Lourenço’s meta-analysis for urban growth areas to the current noticeable trends from the Syrian capital city´s current situation. The studying of urban life cycle analysis includes the settlements study intertwined with the city’s plans and monitoring the future stages for the master plans and the workflow of several cycles and their intensities. The achieved life cycle of Damascus city allows comparing the negatives and the positives of each plan’s stages, the urban areas distribution, the state of the current master plan for Damascus and the general phases of the city´s developments. It is also perceived through a specific study on the general effects of these phases´ impacts on the city, the effects of the on-going conflict in Syria and the enormous damages that affected the whole city and the normal life cycle. This negative occurrence can be analysed through a pulsar effect analysis which interferes in the cities´ life cycle, showcasing changes in the normal behavior of the city. The analysis of these changes caused by the conflicts and relating to the present main problems can be used for developing new strategies to help improve the future urban planning for Damascus. This case study can further advance urban studies applicable to disaster areas.
Keywords: Life Cycle Analysis, Damascus, Post-war Urban Planning, Monitoring, Master Plans.
vi
RESUMO
A avaliação de ciclo de vida é considerado um dos conceitos modernos dos nossos tempos. O ciclo de vida de áreas urbanas não é apenas baseado em equações matemáticas que podem lidar com suposições e informações. É um conjunto de métodos e ferramentas para o estudo de mudanças urbanas assente em levantamentos estatísticos do desenvolvimento e modernização do tecido urbano de determinada cidade.
Esta dissertação apresenta os objetivos e a metodologia de estudo da análise do ciclo de vida da capital da República Árabe da Síria, a qual é baseada no estudo das mudanças que ocorreram no Plano de desenvolvimento urbano ao longo dos anos, assim como suas alterações, fazendo para tal uso do modelo de Lourenço (Lourenço, 2003).
O estudo de análise do ciclo de vida inclui a avaliação das alterações dos planos da cidade, a monitorização de futuras etapas para os planos urbanos segundo os ciclos de vida detetados na cidade de Damasco. Também é efetuada a comparação de cada uma das fases, tanto positivas quanto negativas do plano, assim como da distribuição de áreas, do sistema das construções, e de suas alterações durante o período estudado do ciclo de vida da cidade. Inclui, ainda, o estado atual do Plano de Urbanização, e os pontos positivos e negativos de cada projeto destinado para Damasco, as fases gerais dos desenvolvimentos da cidade e também o estudo dos efeitos gerais dos impactos na cidade. Para tal, os efeitos da guerra actual na Síria, e os enormes danos causados que têm afetado a cidade como um todo e o seu ciclo de vida normal, serão levados em consideração.
Palavras chave: Análise de ciclo de vida, Damasco, Planeamento urbano de pós-guerra, Planos Diretores.
vii
CONTENTS
1 INTRODUCTION ... 1
2 STATE OF ART ... 2
2.1 Life Cycle Analysis... 2
2.2 Pulsar Effect ... 10
3 THE COMPONENTS OF LIFE CYCLE ANALYSIS MODALLY ... 14
3.1 Planning ... 14 3.2 Actions ... 16 3.3 Living ... 18 3.4 Disruption ... 20 4 APPLICATION TO DAMASCUS ... 23 4.1 Damascus profile ... 23
4.1.1 Damascus history changes ... 25
4.1.2 Ecochard plan... 28
4.1.3 The most important points of Ecochard Master Plan ... 28
4.1.4 Analyzing Ecochard Master Plan... 29
4.1.4 The changes on Ecochard Master Plan in the following years ... 37
4.2 The components of life cycle analysis ... 38
4.2.1 Planning in Damascus ... 39
4.2.2 Actions in Damascus... 45
4.2.3 Living in Damascus ... 50
4.2.4 Disruption in Damascus ... 55
viii
5.1 Results ... 61
5.2 Syrian revolution as a pulsar effect ... 72
6 Conclusion ... 75
6.1 Conclusion ... 75
6.2 Recommendation and possibilities for future work ... 78
ix
LIST OF FIGURES AND TABLES
Figure 2.1 Lourenço model for ideal behavior ... 2
Figure 2.2 Quasi-model of Knowledge-Based Research Saint-Paul, R. and Teniere-Buchot (1974) ... 3
Figure 2.3 Zoning of Jonggol Green Islamic City ... 7
Figure 2.4 The Plan process Behavior of Jonggol Green Islamic City ... 9
Figure 2.5 Supply and demand-side aspects of a ‘big event’ and its ‘pulsar effects’ ... 11
Figure 2.6 the Mesones taxonomy for the pulsar effects ... 13
Figure 2.7 Behavior of Expo-98 in Lisbon (Nation’s Park Plan-Process) ... 13
Figure 3.1 Ideal behavior of a planning process; Planning curve ... 15
Figure 3.2 ideal behavior of a planning process; action curve ... 17
Figure 3.3 ideal behavior of a planning process; Living curve ... 19
Figure 3.4 Tourism area life cycle for the Opatija Riviera (1883-2001) ... 20
Figure 4.1 Damascus’s Location Source (Own work) ... 23
Figure 4.2 The great Umayyad mosque in the city center ... 24
Figure 4.3 changes in old city of Damascus plan between the Roman period and the Ottoman period ... 27
Figure 4.4 The development of Damascus ... 27
Figure 4.5 the city parts density rates ... 30
Figure 4.6 Population distribution in Damascus ... 31
Figure 4.7 Ecochard Concept Master Plan of Damascus of 1968 showing expansion areas Source: (Juvara, 2012) ... 32
Figure 4.8 Green area by Ecochard master plan ... 35
Figure 4.9 the expansion of Al-Ghouta illegal settlements (1965-2006) Source: Own work ... 37
Figure 4.10 The urban expansion and the green areas suggested in Ecochard Master plan ... 38
Figure 4.11 Damascus expansion area by the 1992 proposed plan (1992-2015) Source: Own work... 42
x
Figure 4.13 AL-Marjeh square development 1940-1970 Source: Own work ... 46
Figure 4.14 Ecochard proposals for the national museum Source: Own work ... 47
Figure 4.15 Al-Mazzah development Source: Own work ... 50
Figure 4.16 The immigration wave from the suburbs into Damascus Source: Own work54 Figure 4.17 the death rate in Syria (2011-2013) ... 56
Figure 4.18 Syria population (Prospects UN World, 2015) ... 57
Figure 4.19 The destruction in Damascus suburb ... 59
Figure 4.20 The destruction in Al-Yarmouk camp in Damascus ... 60
Figure 4.21 The destruction in Al-Tadamon in Damascus suburb ... 60
Figure 5.1 planning process of Damascus 1960-1982 ... 61
Figure 5.2 Actions in Damascus 1960-1982 ... 62
Figure 5.3 the expected population in Damascus by Ecochard and the actual population Statistics ... 62
Figure 5.4 Living in Damascus 1960-1982... 63
Figure 5.5 Planning in Damascus 1982-1992 ... 64
Figure 5.6 Actions in Damascus city 1982-1992 ... 64
Figure 5.7 Population in Damascus 1982-1992 ... 65
Figure 5.8 Living in Damascus 1982-1992... 66
Figure 5.9 Planning in Damascus city 1992-2015 ... 67
Figure 5.10 the Actions in Damascus 1992-2015 ... 68
Figure 5.11 the Population in Damascus 1992-2014 ... 69
Figure 5.12 the Livings in Damascus 1992-2015 ... 69
Figure 5.13 A, B, C The planning process for the three periods, D the population Damascus city 1960 – 2015 ... 70
Figure 5.14 Mesones taxonomy of Damascus case ... 72
Figure 5.15 Damascus behavior on planning process 1960-2015 ... 73
Figure 5.16 the Ideal behavior in Damascus 1960-2015 ... 74
Figure 6.1 the relationship between the three aspects of the planning process; Planning, Actions and living ... 76
xi
List of Tables
Table 1 Determinant factors ... 5
Table 2 Matrix of interdependencies in the plan process with innovations ... 6
Table 3 The Resume Data of Jonggol Green Islamic City Plan Process ... 8
Table 4 Negatives and positives of Ecochard Master Plan for Damascus ... 29
Table 5 the expected growth rate between 1965-1084 ... 29
Table 6 Syria Statistic in 2014 estimation ... 56
1
1 INTRODUCTION
Since the beginning of times with the overpopulations of the cities, they suffered from the shortness of natural resources due to the unconditional and overloaded consumption of the natural gas and petroleum products, which can lead to serious impacts on the environment and the sustainability of the natural materials. The important of the sustainability studies which reflect the state of balance between the environmental, economic and social parameters and objectives, takes great significance in the recent times due to the inability of most of the developing countries to meet the urban sustainable goals in its comprehensive concept. Sustainability can be established by achieving a prime life cycle for the building as a whole unit, this life cycle helps understand the three dimension parameters for the sustainability. Therefore, it helps make more informed decisions and plan to improve the urban environment. The boundary work done in the name of sustainability created an important momentum for innovation in ideas, political mobilization and policy change (Scoones, 2007).
In the case of developing countries, the life cycle analysis is further important due to the fact that sustainability indicators are harder to estimate. In the Arab World, these indicators must consider the physical, local and social situations that those countries have, and the lack of precise studies that can distinguish the special indicators make it more difficult to apply the methods set for more developed countries. In an agreement, argued that various case studies found in the literature are difficult to compare because of their specific properties such as building type, climate, comfort requirements, local regulation, etc.
The life cycle analysis (LCA) methods are used for evaluating products process or progress with time, LCA takes an inclusive approach for establishing environmental evaluation (Cabeza, 2014), where the life cycle of urban areas can be built upon methods and tools to study urban changes and finding statistics on the development of the city’s urban form.
Applying the life cycle analysis for urban areas help creating better understanding for the impact of the
2
2
STATE OF ART
2.1
Life Cycle Analysis
Life cycle analysis is an applied theory to a better understanding of the changes and the process of the studied subject and the interaction with the time. Lourenço’s model for study is one of the methods for life cycle analysis. It was presented first in 2003 and applied to area of tourism development. It consists in a three-dimensional graph (Figure 2.1) which represents the consistency of the life cycle and the time periods of the study. The time is illustrated in the horizontal axis and its measured as each period T represent 10 years, the consistency of the life cycle is illustrated in the vertical axis and its represented by three levels; (I) for minimum level, (II) for medium level and (III) for strong level, and this is compatible to the planning stages, it could be S-multiples curves to indicate the action and the living aside from the planning, curves present the cycle of planning process. (Figure 2.1) This model attempts to show the planning efforts, also what affects the urbanization and the public infrastructure (Lourenço, 2003a).
Figure 2.1 Lourenço model for ideal behavior Source: (Lourenço, 2003)
According to Lourenço’s study considering Holton model, the flawed four-level evaluation model. Human Resource Development Quarterly which was proposed in 1996 “Holton model is based on existing research and accounts for the impact of the primary intervening variable such as motivation to learn, trainability, job attitudes, personal
3
characteristics and transfer of training conditions” (Holton, 1996), the model has psychometric, social, and environmental properties, which depicted the gold mining booming growth in a quasi-model of the population prediction, the model started as evaluation Holton broke the attraction that surround gold mining and the excitement of a new field discovery to an analogy with the gold rush (Lourenço, 2003a), after that an acknowledged-based research was conducted by Saint-Paul, R. and Teniere-Buchot in 1974 (Figure 2.2) under the terms of discovery’s time and importance, in the first period (O,T) there is an increasing in the flow of participation in fundamental research but this participation refluxes in the second period, also the fundamental knowledge curve decreases regularly while the applied knowledge increases (Elwood, et al., 2005).
Figure 2.2 Quasi-model of Knowledge-Based Research Saint-Paul, R. and Teniere-Buchot (1974) Source: (Lourenço, 2003a)
Lourenço relied on the framework of prediction heuristics in the quasi-model of holton in the process of defining the urbanized area, as it was mentioned earlier Lourenço noticed that Holton broke the attractiveness of gold mining, as a result Lourenço suggested a model of planning cycle which included three curves: planning, action and living, Lourenço proposed depending on those curves the ideal behavior of a planning process.
Lourenço depended on the knowledge-based graphic in the theoretical explanation of the planning process suggested model, where the base curve which is planning is demonstrated as participation in the fundamental research curve, the associated actions
4
curve is demonstrated as the logistic curve of fundamental knowledge and the living curve is demonstrated by the applied knowledge curve .
Never the less it must be mentioned that both the plan- process model suggested by Lourenço and the gold-rush model evolutions were conducted with an almost metaphor mathematical model that depended on a graphical representation of an explicit visualization.
Normally the achievement of the ideal model planning process is hardly possible and also it is problematic, this because of the uncertainty and complexity that come along with the reality, there are good chances that the planning will be interrupted, stopped, penetrated and even became unable to reach the normal stages of development, the same thing could happen to actions, not to forget that the living also could be affected by experiences. In analyzing the achievement of the model, its noticeable that it was first lunched based on calculation of mathematical expressions, which vary from one area to another, due to the changes in each area geographical, social and climatological nature, causing the official standers of the intensity of each life cycle to change from one site to another, but in proportion to the general instances, Lourenço model can be considered as a reference in studying the planning process of an urban area. In the case of Damascus, the model was applied in order to analysis the planning process of the city and compare the ideal behavior of the city to the observed behavior of the city as it will be signified in the results.
S-curves parameterization could be calculated by mathematical expressions, in the cases which are analyzed as a field to implement static analysis and evidence, for example the intensity of planning could be measured by the number of plans that are created, or by the amount of invested money that was spent on the plans and projects which includes the costs of consulting, planning and other different possible resources, also the intensity of actions curve could be calculated in a similar way to the planning curve by numbers or by costs and resources required to achieve development, while the intensity of the living curve could be concluded by analyzing the urbanization of an area or by population growth. This model could be useful in the cases of the presentation of a master plan process where the parameterized graphics are introduced for a long period of time.
5
Lourenço concluded that in order for the planning process to be successful there are several factors that must be taken under consideration and must not be negligible. The success of a plan is considered to be depending on the numbers of the rules that were adopted in the planning process; the rules were set according to their ability in achieving effectiveness of the plan actions, or at least their ability in maintaining safety of the proposed structural framework at local level.
However although the advantages of applying this methodology are hugely significant, it has some obstacles which can be explained by the meagre adequacy of reality, the methodology is based on a rational intellectual approach without any consideration for the intuitive in the character. In another hand in the contrast of the envelope analysis, it contains matrices of interdependence, methods of simulation and critical factors (table 1).
Table 1 Determinant factors
Physics Technical Cultural
Land Use Planning Proposals Public Participation
Morphology and the constitution of the land
Technique and economic indicators Policy measures Accessibility Management of urbanization Land policy
Cadaster Fines Organizations and
institutions
Source: (Lourenço, 2003a)
However as it was mentioned above, plan-process model has an utopian conception which means it is hard to be practically achieved in the real life, that can be explained by the interruptions and disruptions that comes along with the concentrated planning sessions of actions and experiences, as a result to conduct a more effective assessment for the planning process the critical factors must be considered to be complemented with a range of interdependencies (Table 2) from this it can be noticed that the factors of continuation and perception of the innovations are considered to be effective factors according to their level of involvement in the planning process especially at crucial moments of the analysis. Normally those factors are related to the type of relations that were established between the social partner, the strategies that were developed and the
6
corresponding detour on the scale of time, also the discrimination is still used in the process and is preferred to be quantified if it was possible, in addition to that the resources that are necessary to provide the perfect tools for the process of master plan must be quantified under the framework of one or more planning sessions. (Astuti, 2012)
Table 2 Matrix of interdependencies in the plan process with innovations
Plan-process Politicians Technical Staff Private Group
Lobbies Politicians Technical Staff Private Group Lobbies
Innovations perception (I1, …., In) Persistence abandonment Strategies used (S1, …., Sn) Dominant relations (Consensus &Conflict) Provision of resources (Financial,
Human, Technical, Others)
Source: (Lourenço, 2003a)
Jonggol green Islamic city
To illustrate a study case of the Lourenço model done in 2014 on the city of Jonggol in Indonesia, where the city is located in the Cibodas Village, Jonggol District, Bogor Regency West Java, 60 km southeast from Jakartaethe capital of Indonesia; it is a city that is considered to be a developing residential area due to its strategic location.
7
The master plan of Jonggol divided the 100 ha area into three zones of Medina, Sunda and Mecca (Figure 2.3). Each of those zones was planned to have its own function and features and it is assigned with its own facilities, but also those zones were completed with several facilities such as a dormitory, market and hospital.
Figure 2.3 Zoning of Jonggol Green Islamic City Source: (Kusumawanto, et al., 2014)
The main concept of the designing process is to maintain the level of wastes on zero, that concept could be considered to be an ethical concept by reducing the waste production and deal with it as a resource. There are a lot of opportunities that could help in achieving this concept, one of them is the availability of a large agricultural area which helps in providing a self-sufficient amounts of food and energy, furthermore there are the possibility of using the green area in the city as a free car zone which eventually will support the concept of an ethical modern Islamic city, the plan process of Jonggol green Islamic city is designed for 15 years, that long time is aimed toward accomplish the planning and implementation of the necessary infrastructure and basic buildings.
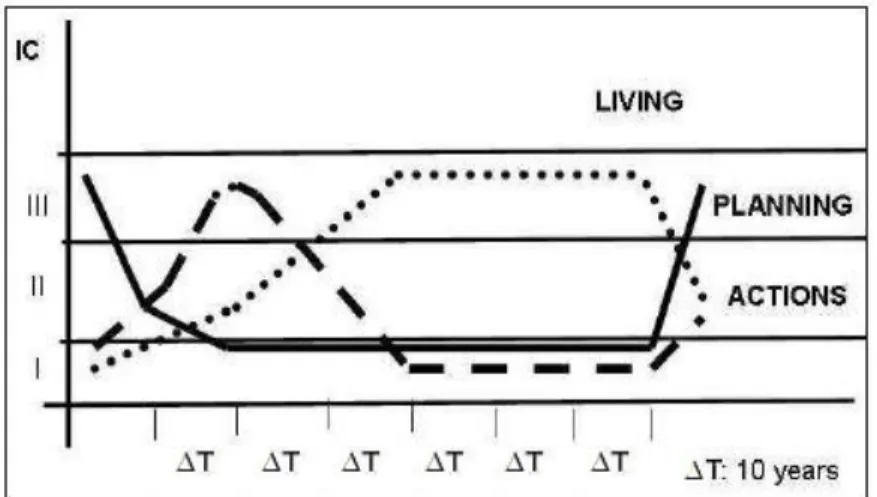
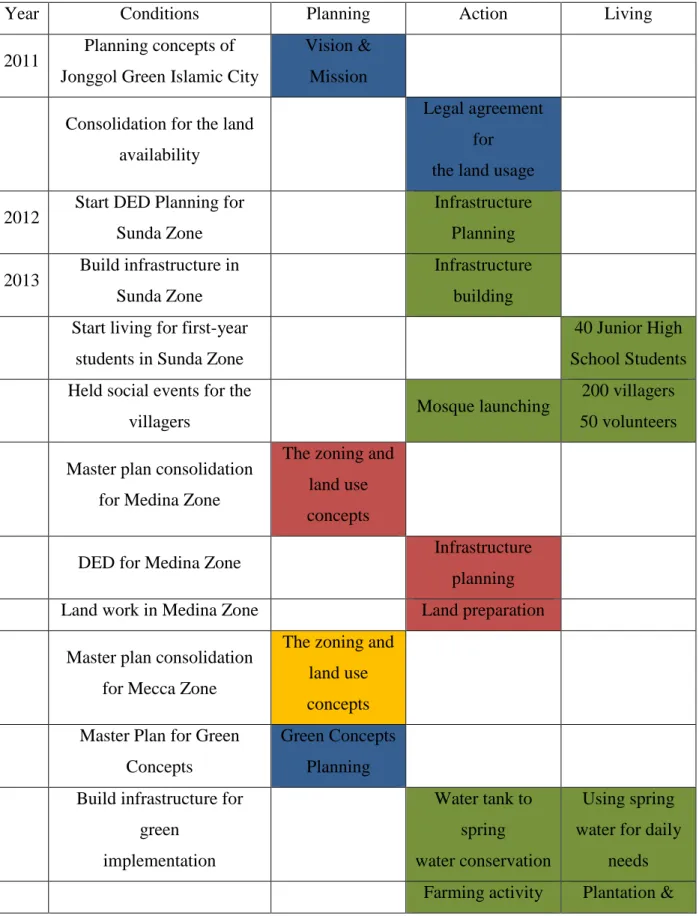
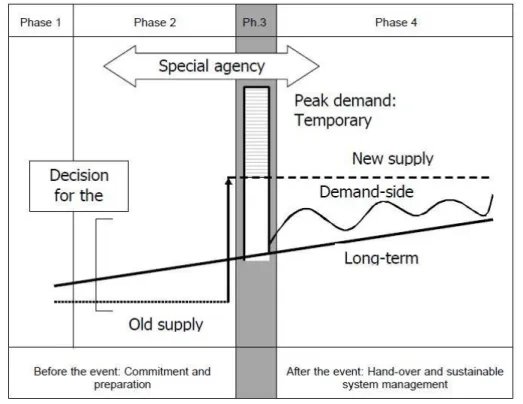
However, to evaluate the master plan process of Jonggol Green Islamic city, Lourenço model was applied (Figure 2.4) , and each zone and green concepts implementation was analyzed, between the year of 2011- 2014 (Table 3) it can be noticed that the conditions are broken down into chronological orders and classified depending on the zone development.
8
Table 3 The Resume Data of Jonggol Green Islamic City Plan Process
Year Conditions Planning Action Living
2011 Planning concepts of Jonggol Green Islamic City
Vision & Mission
Consolidation for the land availability
Legal agreement for the land usage
2012 Start DED Planning for Sunda Zone Infrastructure Planning 2013 Build infrastructure in Sunda Zone Infrastructure building Start living for first-year
students in Sunda Zone
40 Junior High School Students Held social events for the
villagers Mosque launching
200 villagers 50 volunteers
Master plan consolidation for Medina Zone
The zoning and land use concepts
DED for Medina Zone Infrastructure
planning
Land work in Medina Zone Land preparation
Master plan consolidation for Mecca Zone
The zoning and land use concepts Master Plan for Green
Concepts
Green Concepts Planning Build infrastructure for
green implementation Water tank to spring water conservation Using spring water for daily
needs Farming activity Plantation &
9
livestock Fund raising through private
property business to build facilities in Sunda Zone
Zoning for
property land Selling activity
60% already sold out
Build more infrastructure for the second-year students
More houses and classroom
2014 Changing plan for Mecca
Zone Quran Academy
Quran Academy DED Preparing start living for the
second-year students in Sunda Zone
Source: (Kusumawanto, et al., 2014)
Where: blue represents all zones, red represents Medina Zone, green represents Sunda Zone, and yellow represents Mecca Zone.
Figure 2.4 The Plan process Behavior of Jonggol Green Islamic City Source: (Kusumawanto, et al., 2014)
Lourenço’s model shows that the planning process for the concepts of the Jonggol Green Islamic city was intensive since the year of 2011 and it continued until 2012 then it went down in 2013-2014, meanwhile the action was still in the first stage and it didn’t start to get intensive until the year of 2014 which includes the intensity in the infrastructure building in Sunda Zone and for some action activity starting to occur in Medina Zone.
10
However, the small amount of building and infrastructure in Sunda Zone allowed it to be occupied by permanent students of the Junior high school and the Islamic Teacher Academy, as a result, it can be concluded that the infrastructure in this zone interrupted in the creation of a new education-oriented living area, it also provided the opportunity for networking with the Government, the private companies and volunteers which enable the Zone to have some events held involving the villagers, In another hand the green concepts were applied to several fields including agriculture, livestock’s raising, using the local materials for building and maintaining water resources. According to the procedure of applying the planning process model on the Jonggol city master plan, the importance of creating the ideal city integrating both education and tourism is still high. However, because of the basic needs this stage requires, the economic and social values are the first priorities, and the green concepts for the city could be developed and enhanced in the afterward process of development (Kusumawanto, et al., 2014).
2.2 Pulsar Effect
Pulsar effect is a special classification of a series of events or forces that led to the need to apply changes in the process of urban planning and the city life cycle. In this study it will be applied as a definition of the Syrian revolution impact over Damascus planning process. Biased on the definition given in ISoCaRP 2002, “Pulses” is the peaks troughs and recurrent or repeat events which have a distorting effect on the day- to-day operations of the contemporary city. These events may be shaped by a formal planning process or by haphazard and unpredictable forces, which put them beyond normal control mechanisms. It often demands new operational arrangements, new forms of governance and new approaches to participation and partnership.
Also, a conceptual line must be drawn between routine jobs and recurrent special events, based on criteria of their size, periodicity, predictability and risk. This would then enable us to define our core problem, as follows: A special events always require special management, including non-routine investments of public resources, in order to cope with the special events that are usually short-term as such but may have potential for longer-term benefits. The conditions of ‘Pulsar effects’ may lead to serious imbalances between public and private investments and their efficient use for certain periods of time and in certain areas. The challenge is to avoid such imbalances or, once they occur, to
11
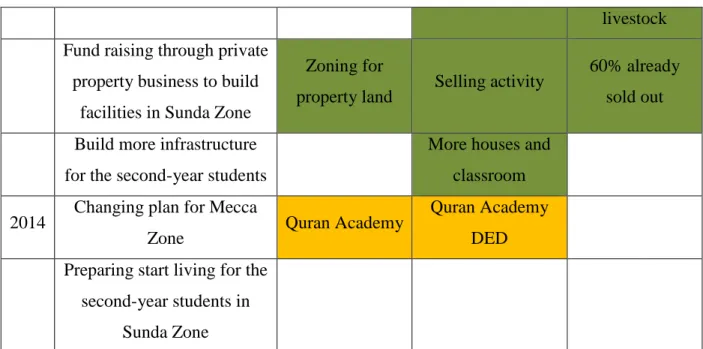
manage them in the best possible way. There is enough evidence that this can be done, but it requires very capable management. (Kammeier, 2002). To overcome the effects of each Pulsar happening in the life cycle, it is easier to study the effects on different phases, (Kammeier, 2003 b). The issues of special events and their ‘Pulsar effect’ on urban development comprise four major phases that have to be handled by good management (Figure 2.5).
Figure 2.5 Supply and demand-side aspects of a ‘big event’ and its ‘pulsar effects’ Source: (Kammeier , 2003 a)
Phase 1: The time before and around the city’s application for being a host of the big event (such as major sports competitions, exhibitions or trade fairs). This phase (and the time long before the application) must include a serious capacity analysis and pre-investment studies centered on the expected demand and supply functions. Without such ‘dryruns’, the preparation for the event in the short Phase two would hardly be sufficient.
Phase 2: The preparations for the additional infrastructure and services required to host the event itself (sports arenas, e.g.) and to cope with the additional demand
12
(hotels, housing, transport, communications, e.g.); this includes planning, financing and implementation of all measures.
Phase 3: The management of the event itself.
Phase 4: The long-term management after the ‘hand-over’, including post-event adjustments (such as dismantling temporary buildings and winding up ad-hoc services).
Phases two and three would require some specific institutional arrangements, including an authority for overall planning, coordination and implementation. At the beginning of Phase four, most of the special institutional arrangements would end as the facilities are handed over to the agencies that are normally in charge. While Phases two and three are concerned with supply-side management. The preparatory Phase one must provide solid answers to both demand and supply-side questions. (Kammeier, 2003 b).
Based on Mesones (Mesones, 2003) who built taxonomy for the pulsar effects, it can demonstrate the characteristics of the events and this taxonomy present the relationship between them, it present various classification for the events recurrence in the X axis, either once, yearly, fortnightly or daily, however in the axis Y the taxonomy present the position classification of the event, that range from one point, sparse or ubiquitous. For example, Guimares (Portugal) in 2012 was labeled as European Capitals of Culture and Guangzhou (China) in 2010 to host the Asian sports games, and both classified one-point events that happen once because both events are recurrence event that passes between different cities and countries in every rotations, in the other hand, those events are concentrated in one city without the having any impact on the surroundings cites (Figure 2.6).
13
Figure 2.6 the Mesones taxonomy for the pulsar effects Source: (Mesones, 2003)
The planning process behavior can change in different ways by ‘pulsar effects’, Expo-98 in Lisbon (Portugal) which is the world fair that took place in Lisbon between May and September, 1998, can be example of pulsar that affected the urban plan process of the Nation’s park site in Lisbon which was planned without future outlooks of the needs and demands, it was polluted with near land used for illegal waste dumping, after the planning of Expo-98 the entire area was rebuilt for this event, the site now have new urban design to be considered one of the largest urban redevelopment projects in Europe. (Lourenço, 2010), the planning process was speeded up from 20 into 10 years (1990-2010) (Figure 2.7).
Figure 2.7 Behavior of Expo-98 in Lisbon (Nation’s Park Plan-Process) Source: (Lourenço, 2010)
14
3
THE COMPONENTS OF LIFE CYCLE ANALYSIS
MODALLY
The Lourenço´s model adopted for urban areas, analyses three dimensions for the planning process of the urban sites; planning, actions and living dimensions.
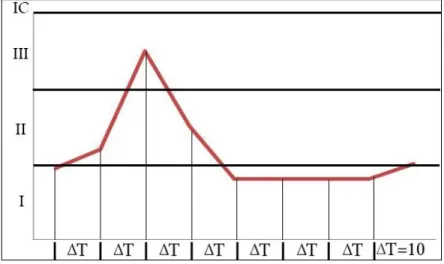
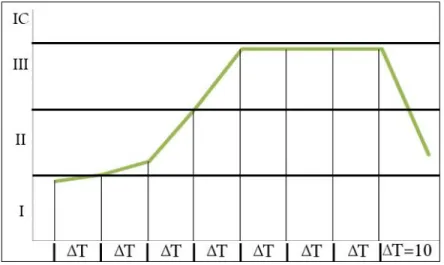
The ideal behavior of a planning process shows a life cycle of about 70 years from the beginning to the end of the cycle where new plan process analysis starts, the studied time periods of 10 years clarify the development of the planning process dimensions with successive periods of time to monitor its changes and affects by the site circumstances. (Figure 2.1)
At the beginning of the life cycle of the planning process, it starts with high level of the planning ratio, however, low values of the actions and living curves, they reaches their highest ratio in the second and fourth decade respectively, the action curve descended to its lowest value after forty years and continue with steady low value until the end of the life cycle, also it is noticeable that living curve keep on steady high value until the middle of the sixth decade where it records a significant decline to its lowest values after seventy years of the urban plan.
3.1 Planning
Planning which also called urban, city’s or regional planning it is a dynamical tool used to improve the welfare of the people and the communities by creating more convenient, healthful, efficient spaces for present and future generations. Planning enables public participation to play a meaningful role to create the rich communities and improves the people lives, offering better choices for the urban spaces and urban activities.
Professional planners research, design and develop the society image of the site with considering the data provided by earlier studies and by social work on the affected public parts to ensure setting the appropriate measures for preparing the site urban plan.
In creating the urban plan the main element is to specify the social strategies decided by the community to reach its objectives and purposes, planners responsible for designing and applying those strategies, often need to coordinate the teams and divide the working
15
sections, it’s important to understand that the urban plan could take many forms included in its modality; policy, community, regulatory and incentive strategies, comprehensive and actions plans. (APA, 2015)
Planning requires different fields of specialization; these specializations represent different competence in planning knowledge so jointly enhance the plan performance to provide people welfare. Here several specializations within the planning profession discipline;
Community development.
Land use and law enforcement.
Transportation planning.
Environmental / natural resource planning.
Economic Development.
Urban Design.
Planning management / financial.
Housing.
Parks and recreation.
Historic Preservation.
Community activism / empowerment. Δ
Other examples of plans including; redevelopment and investment plan, economic strategic plan, site plan, tourism plan and disaster preparation plan. (APA, 2015).
16
The planning S-curve including data like number of urban and regional plans, urban infrastructure, public recommendation, structural behest and administrative policies and studies. Also it indicate the development of those data with the time periods in the life cycle, in the first of the cycle the high planning ratio values caused by the initial big investment in urban planning and the beginning of the planning efforts to cover the maximum need to start the cycle, after the second decade the curve start to decline because of the end of the urban planning activities and starting the actions to develop the site plan and using it for the designed purposes. By starting the third planning process decade the planning ratio values stabilized at its lowest rate for period exceeding four decades because of the idle of the required planning to sustain the site life cycle, and continue by this rate until it reach the end of the cycle, where the need arises to establish new life cycle studies (Figure 3.1).
The severity of the planning measurable for example by; the number of the urban plans suggested for the site, the money spent on this planning period, planning projects, data researchers, also the human and technical recourses.
3.2 Actions
Represents the second studied dimension of the model it could be measured by the financial sources and the amount of investment dedicated for establishing the approved site plan, also the works and construction actions of the plan aspects. It can be monitored by the work on two main aspects construction and infrastructure.
These actions should propose objective and organized new solutions to the problems in the planning policies and the integrated district project created in the urban plan.
In order to enhance the urban planning the administrative direction should manage to consider the three main aspects of sustainability; environment, social and economic, so the action can manage to enhance the welfare of the people by guardianship the rights for the future generation on the city plan.
The work on construction aspects including these action elements
Public safety and site security.
17
Air and dust management.
Water sources control.
Waste and materials reuse.
Traffic management.
In the case of city planning process the action should take magnificent role in the process because of the big scale procedures needed to take actions and pursuance the suggested plan, and with the high amount of actions comes the big initial investment from the governments into construction operations, also the study of the infrastructure needed to be used or to establish in the plan, which causes a big amount of studies and researches to avoids mistakes in sources supply where any delay or misplace can affect the whole life cycle of the city. The other major interest is the labor force of construction actions which could be majored by the workers number and shifting hours, used techniques and raw materials provided to the constructions sites. All of these forces included in the action dimension and considered in the model to study its development with time.
Figure 3.2 ideal behavior of a planning process; action curve
The actions curve data are; the investments provided for construction, labor values and construction materials. These data change over the time of the life cycle causing the differences in the curve, by the beginning of the cycle, the action curve starts with its lowest rate because of the planning periods where with the development of the urban plan there is no investment in any actions, with the times progress and the decline of the
18
planning curve the action curve witness a remarkable rise so that it reach its highest value by the second decade, this rising caused by the need for the rapid interfering with the actions over the urban plan settled in the planning period and the high initial investment dedicated for the construction actions, after this peak it descended rapidly to reach its lowest value at the end of the fourth decade and keep stable low value until the end of the life cycle and that because of ending the application of the plan and move to the utilization period where the living rate can take the highest rate also because of the end of investments and labor for constructing the urban site plan (Figure 3.2).
3.3 Living
The third dimension of the Lourenço´s model which indicate the demographical studies of the planning process, related to the population and the density rates which can be observed through the population statistics, economic and social opportunity, which can be epitomized in two main factors; population and natural resources.
Population considered to be variable and important element and effective constants related to the spatial domain, and the size of the population considered essential for the growth of the site, formulated in the terms of density, indicating the volume of activity and the strength for defending the place, and refer to the possibility of migration to or from the site, but after connecting it to the economic potential, the diversity in the population could refer to the accumulation of delegations migrations of the place.
Natural resources which is elements related to the activities in the place that can be increasing or decreasing, such as agriculture, fishing, timber, mining and precious stones, and the spatial domain of a place related to its core values of natural resource and it’s quality and the wealth here is the productivity of trade exchanges, which cannot make a reciprocal processes without the presence of commercial lines, which imposes a kind of complementary relations between the population and the spatial domain. (Research Department, 2008)
19
Living dimension for city urban planning process defined by many factors including the city scale and capacity to obtain high population numbers, the city infrastructure and mobility structure, major initial investment in the action and planning area which in return dedicated to a massive population number with all the living and socializing activities, which in return provide most of the privet investment and economic exchanges between the private and the public’s parties.
Figure 3.3 ideal behavior of a planning process; Living curve
The Living data are the; numbers of the population in the site, the density values, numbers of yearly visitors and tourism, economics and social activities.
At the beginning of the life cycle where the site is starting with urban plan and the urban condition, the values of living rate is at its lowest because of the uprising actions to implement the new plans, this lead to difficulty in population stability, economic state and social activities that can occur in the site. With time passing and the implement of the actions the living rate increases to its highest values by the fifth decade so that it equivalent the capacity of the site, and this uprising due to the stability of the site with time and its ability to provide the population welfare and the appropriate spaces to social and community activities, which in return increase the economic outcome because of the consummation behavior of the inhabitance.
20
By the end of the life cycle the living rate decline due to the low efficiency of the old planning process and the need to establish new studies and new planning process to amendment the breaking down of the site. (Figure 3.3)
3.4 Disruption
In the ideal life cycle analysis by Lourenço Model, the site has three dimensions, planning, action and living but this happens when the site is going through normal ideal life cycle but in many cases the site goes through abnormal conditions causing it to be divided into separate phases of development, and some of this phases could be studied as separate life cycle, this abnormal conditions could have positive effect on the site like a motive to accelerate the planning process to achieve certain time goal, for example the cases of preparing for hosting Lisbon 1998 exhibitions (Expo-98 in Lisbon) where the time scheduled for the site caused the process to be speed up, nevertheless not all abnormal conditions can be as corroborative as exhibitions, in the case of Opatija Riviera, Croatia, studying the tourism area life cycle of this destination that has been developing tourism for more than 150 years. The data for Opatija Riviera indicate that the area has witnessed all phases of the life cycle, and it’s noticeable that the sharp declines in visitor numbers were caused by the exogenous factor; the wars which were the World War I, World War II and the most recent War for Independence from 1991 to 1995, so in this area the tourism has developed from almost zero activities four times.
Figure 3.4 Tourism area life cycle for the Opatija Riviera (1883-2001) Source: (Corak, 2006)
21
the long tourism life of this destination was abruptly halted by wars three times so that it had not followed the classic development curves, so the area development were divided into four phases depending on the three wars as time intervals for the life cycle analysis. (Figure 3.4).
Period I “ Exploration and involvement” (1883-1914)
In this period the area experienced development phase driven by several actors who developed the infrastructure and built capacity necessary for tourism activities, as the health tourism dominated in this period key development directions of this period were quality of services, hotels accommodation, care for environment and product exclusivity that enabled it to attract tourists with a high spending power and to develop unique product features.
Period II “Involvement and decline” (1919-1940)
The second period was characterized by the development of new products and thus health tourism ceased to dominate, the destination used the risky strategy of new product development including orientation to the new market. However, this reorientation was driven politically, rather by the stakeholders involved in the tourism development which causes fluctuation in the numbers of tourists and degradation in the quality of the area.
Period III “Development” (1946-1990)
After several years of Wars, the area experienced initial stages of tourism development and caused it quickly entrance to the development phase, but this time was marked by the non-existence of a tourism development plan. The principles of the market economy were applied only partially and, therefore, the tourism development was not a subject of strategic decisions, this because of different reasons, the insufficient marketing, unsophisticated promotional efforts and a confused development vision. In this period, a congress tourism development introduced to the market but without the necessary investment in infrastructure and research.
22
Period IV “development and consolidation” (1990—)
In this period, the area was on the tourist market but with the inherited problems. It went through consolidation and party stagnation according to some parameters such as slowing growth rate, low occupancy rate, heavy reliance on repeat trade and reaching the limits of carrying capacity. Although the tourism numbers continued to grow, because of several problems in infrastructure and an aging product, the decline stage began to emerge slowly. If the area fails to increase the investment and does not apply appropriate strategic measures that enable it to enter the rejuvenation phase, the decline is inevitable (Corak, 2006).
23
4
APPLICATION TO DAMASCUS
4.1 Damascus profile
Damascus city is the capital of Syrian Arab Republic, the Middle Eastern country with population of 22,087,048 which is considered hastily growing country; the population grow from 8 million in 1972 to a current population of 22 million. Syria population also contains different refugee’s communities. In 2014, there were 1.8 million refugees from Iraq, 540,000 refugees from Palestine and Syria was home to 130,000 Armenians (Estimates, 2014). However, Syria is a land that has been inhabited since ancient times. Given its strategic location firmly placed between East and West, Syria has long been the battleground site and “victim of various regional and international balances of power” (Quilliam, 1999).
Damascus today is the production of many successive civilizations, and its urban origin goes back to periods far in ancient history, coordinated and planned in every era according to geometric and scientific foundations as a response of religious, political, economic, environmental and security requirements, it was studied in advance and organized forms, and its legislation and plans were putted specific for its growth and development, Damascus can be classified as creative pre-planned capital, moved from the residence of gods and a houses of worship into cultural city, economical and finally political capital (Abdin, Al-Masri, 2008).
Figure 4.1 Damascus’s Location Source (Own work)
24
Located in southern western Syria, Damascus is the center of a large metropolitan of 4.3 with its suburb (estimate 2009), and in 2014 estimated to be over 3 million. While proud to be the world’s oldest inhabited capital, Damascus celebrated its title of the Arab capital of culture in 2008. The city turned into cultural platform to attract the attention over full year of 2008, the most important urban activities; Rehabilitation of the open spaces in the city and removal of infringements and distortions.
Damascus as a city has an uninterrupted history goes back to 6 thousand years, owing the city’s strategic geographical location in a plain narrated by Barada River and its branches, which are separated in seven branches distributed across Damascus, and the city is characterized by the existence of Qasioun Mountain in western north Damascus.
In 1979 UNESCO lapelled the old city of Damascus as world heritage, because the city represent a masterpiece of human creative genius (selection criteria I), and it considered an outstanding example of building, and it illustrates a significant stage in human history (selection criteria IV). This labelling caused the development of the rehabitations movement of this part of the city.
Figure 4.2 The great Umayyad mosque in the city center Source: UNESCO, Silk Road.
Damascus City located in Syrian Arab Republic which is one of the developing countries in the Arab world, in 2011 the Syrian revolution started heading from the south of the country to the capital and with political events turned into a war, caused the destruction of more than the half of the city rural areas in Damascus and those changes can cause the need to do more studies on their effects, one of them is the pulsar effect analysis.
25
4.1.1 Damascus history changes
Evidence of inhabitancy for Damascus city was found from 5000 BC in the rich plains of Al-Ghouta. After 1000 BC Damascus become the capital of Persian province Syria, In 64 BC Under the Roman Empire, the rectangular stone Roman wall with seven gates is approximately the same size as the old walled city today. (Figure 4.3)
635 AD the city was under the Islamic rule. 661 AD the Umayyad mosque was built on the same site as Cathedral of St. john the Baptist.
Damascus became meeting point on the holy Hajj to Mecca under the Ottoman Empire, the city expanded with 25000-60000 people meeting in Midan area twice a year, the Hajj-migration added over 30% of the population and caused the rapid expansion of the suburbs. The French mandate continued what late Ottoman planners began, with master planning the city, after World War I the first master plan for the city ignored the local tradition of the old city.
2015
1932
1968
1979
2008
2011
Ecochard’ sMaster plan for Damascus. UNESCO listed old city of Damascus as World Heritage Area. Damascus was chosen as the Arab Capital of Culture. Expected enforcement of new Damascus Master Plan (But not implemented)2011
Danger’s Master plan for Damascus. Start of Syrian Revolution which led to the war going on in Syria.Timeline of milestones in Damascus urban history Source: Own work
Normal life movements in the city center, but full life disable in most suburb areas.
27
Figure 4.3 changes in old city of Damascus plan between the Roman period and the Ottoman period Source: (Wifstrand, 2009)
1963 the Bath Socialist Party took control over Syria in a military coup, the Baath Party, is still ruling in Syria, between 1964-1968 Ecochard traffic plane is implanted. In 1970 upper-class suburb Dummar is built, the 1979 Ancient City of Damascus is World Heritage listed. And by 2007 a new master plan was suggested for the city with the help of the Japanizes agency JICA.
Figure 4.4 The development of Damascus Source: (AlQattan, 2002)
28
4.1.2 Ecochard plan
In 1963 the Baath party took over ruling and it claimed the modernization of Syria, though these political changes in the country a new plan for Damascus represent the new era in the country history which is the end of French Mandate and the colonial period. After the end of the French Mandate, between 1950 -1968, Ecochard was granted the setting the full plan for the city, the work was assigned 18 months to finish but it took four years from 1964-1968 and during this period he worked on studying the roads in the capital and the links between Damascus and other cities. In 1979, the UNESCO labeled the old city of Damascus as a World Heritage, which caused disruption the working on some of Ecochard’s ideas to expanding small streets inside the old city.
4.1.3 The most important points of Ecochard Master Plan
1. Creating important main rod’s network: the Southern Highway, Al-Thawra street and its extension, the rods around the old city walls, the sixth of Tishreen street, Al-Ithad street, Al-Hamra street, turning the Al-Salhiyeh street into pedestrian path, creating parking spaces for the area.
2. Edit residential roads labels: from Al-Koussour, first, second, third, etc, until it is named an old town, old town extension, modern residential area and newly organized area.
3. Creating a new residential area in Al-Malky, Kafar-Sousah, and outside the eastern gate, and organize it closer to free planning than to straight planning. 4. Expanding the commercial concept in Mouhajrin passing Marjeh until
Al-Midan, and building commercial office building.
5. Creating industrial areas outside the city, and limit the industries allowed.
6. Suggest planning solution for the old city of Damascus inside the walls dividing it to zones from its current situation, and creating roads network, but the work on this suggestion stopped.
7. Creating green areas around Barada River, from Al-Rabwah into Dummar, with tourism serves.
29
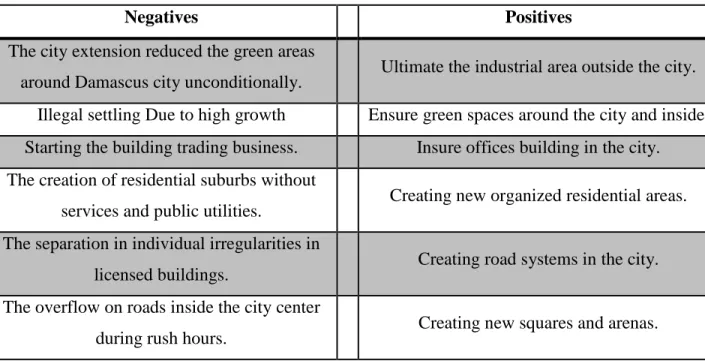
Table 4 Negatives and positives of Ecochard Master Plan for Damascus
Negatives Positives
The city extension reduced the green areas
around Damascus city unconditionally. Ultimate the industrial area outside the city. Illegal settling Due to high growth Ensure green spaces around the city and inside.
Starting the building trading business. Insure offices building in the city. The creation of residential suburbs without
services and public utilities. Creating new organized residential areas. The separation in individual irregularities in
licensed buildings. Creating road systems in the city.
The overflow on roads inside the city center
during rush hours. Creating new squares and arenas.
Source: Own work
4.1.4 Analyzing Ecochard Master Plan
The growth rate
The plan counted on reducing the growth rate, in the following years it was almost 4% and the plan proposed three theories or possibility for population increases and the authorities requested fourth possibility which based on unify the yearly growth rate in 20 years of plan use, while the first and third possibility based on reducing the growth rate and table explain the growth rates (Table 5).
Table 5 the expected growth rate between 1965-1084
Growth rate 1965-1974 1974-1979 1979-1984 First possibility 4% 3.7% 3.7% Second possibility 3.7% 3.7% 3.7% Third possibility 3.5% 3% 3% Fourth possibility (submitted) 4.5% 4.5% 4.5%
30
In conclusion, the city before 1970 had a high growth rate because it was promoted by the residents, while the country was repellent to residents, but in the next years this image changed and Damascus suburb become attraction to residents and what contribute to that the tight area in administrative boundaries, which make suburbs contain the growth in population from city residents to the immigrants, but the growth rate in Damascus decreased to 1.7% between 1981-1994 below average while in Damascus suburbs it was 6.1% in the same period (CBSSYR, 2011).
The density
The plan showed that the average density of the city is 290/h in the consideration of the city area is 2000 h, it also indicate that the expected average density in the following years of 1964-1984 will be 200/h, and the expected density rate in organized residential areas is 350/h, also this density rate in proposed areas for resident in the future is 246/h. In comparing, on the statistical data collected from 1981 – 1994, in Damascus city across residential neighbourhoods, which count to be 61 in 1981, and 62 in 1994 after adding Dwel'a area, the average city density rate 303/h in 1994, and this rate is at lowest in Dummar as 130/h, and its highest in Al-Yarmouk as 828/h. (Figure 4.5) in the year of 2011 from the CBSSYR statistic (CBSSYR, 2011).
Figure 4.5 the city parts density rates Source: (CBSSYR, 2011)
31
In conclusion, the density is high on the sides of the city where there are illegal settlements, while the density decreased in the central parts where the building function changed from residential to commercial and services and the change in the inhabitant sections, when the inhabitants in 27 parts from 62 decreased from 378 -302 thousand, while in 16 parts it increased from 402 -728 thousand during the same periods, and that caused the high density. This continuous increasing in density with its random levels and the growth in the sides parts of the city contribute not only to erosion of Al-Ghouta, but also in increasing the concentration of serves activities in central areas of the city which causes the decreasing in density in those areas (Figure 4.6).
Figure 4.6 Population distribution in Damascus Source: (Wifstrand, 2009)
32
The urbanism and residential areas
Figure 4.7 Ecochard Concept Master Plan of Damascus of 1968 showing expansion areas Source: (Juvara, 2012)
The urbanism plan certified in the 1968 (Ecochard) master plan was:
Inhabiting the predicted population’s increases estimated with 840 thousand in 1984.
Reduce the density by 100/h in the crowded areas of the city which is: 1- Al-Akrad and its area 170/h.
2- Saroujah and its area 80/h.
3- Al-Midan and its area 160/h (Figure 4.7) .
Reduce the density by 200/h in the old city of Damascus inside the walls and its area 110/h and inhabiting 23 thousand in results.
From mentioned above the residential areas of expansion must allowed to inhabit 904 thousand inhabitants distributed as following
1. Under preparation organized regions with an area of 316 hectare to accommodate 145 thousand inhabitants.
2. Regions of acquisition of popular housing to accommodate 52 thousand.
3. Future expansion regions with an area of 2875 hectare to accommodate 710 thousand.
1
2
33
In comparing, the suggested organized areas in 1968, all have been done except, Bab Sharqi and southern Al-Midan. The future expansion regions inside the administrative boundaries have been established either legally or illegally, except west Qasioun where now it is the location of unknown soldier monument and its surrounding, and in the 1970th a new residential suburb been established inside the administrative boundaries in Dummar unlike what in the Master plan and most of it have been done in the 1980th, most of future expansion outside the administrative boundaries in west Mazzah, Al-Sahnaya and east Barzeh have not been appointed for residential purposes, but military purposed.
In conclusion, the idea of conforming Dummar Suburb is a positive alternative step in the field of urban planning compared to preparation of similar projects like new Qasioun city, and Assad suburb in north of Harasta, from the principle of establishing new cities and suburbs, not like the linear expansion used in the past, which caused destroying Al-Ghouta, and overcrowding the city, and the recommended points are, to accelerate in establishing the organized areas and the new expansion areas outside the administrative boundaries, and to use this empty land instead of having it owned by the military.
The city center by the Master plan in 1968
This area forms an expansion in the commercial area in Building system from 1948, by adding Saroujah, Oukaibeh, Faisal Street, Al-Qanawat and Qassaa Street to it.
To study this commercial facility it must be mentioned that the plan did not point to sub-commercial centres, but practically it adopted the past master plans which defined local services centres and the building system from 1968 and allowed opening shops in the old residential areas (area C).
In comparing, the parts added to the commercial areas have not been operated as city centre facilities, most of it is located in the old traditional building conforming the heritage urban fabric, and a lot of this building have been recorded as cultural building, in other hands the illegal commercial facilities spread in the old and new residential buildings next to the cultural buildings.
34
In conclusion, the old organized areas established by the urban law, was all divided into real estates to build it by the working laws, which lead to the rise of new residential neighbourhoods without considering commercial services, like Abou Rommaneh, Al-Mazraa, etc, where the building’s basement worked as shops and stores.
While today those suffer from changing their function from residential to commercial because of its centration and the lack of central commercial area, in a lot of areas the privacy of residents mixed with the public functions, also its clear that the economic and services section did not receive the attention needed even it will contain 75% of the workers from all over the country by 2000.
Since the commercial areas did not develop from the year of 1948 even that the number of worker rises from 46% in 1970 to 64% by 1994 and decreased in 2004 to 48.2%. The trading in the city is based on individual radiance and suffers from the lack of a big modern institution, but the two areas in the west of the legal courts and Saroujah provide good opportunity for working markets.
The city green areas and its classification1968
The proposed city green areas in Ecochard master plan. By the plan the green areas in the city is classified to:
1. Area (A) agricultural activities.
2. Area (B) protected zone which located on the foot of mountain Qasioun and around the urban area in east and south of the city.
3. Area (C) internal agricultural which is the following areas: East park, between Kafar-Sousah and Al-Mazzah, Jobar surrounding and the internal southern railway sides next to electrical faculty.
4. Area (D) the gardens area which is in those locations: Tishreen Park, on Barada River sides, net to Bab Touma around Barada River and different parts of the city. 5. Area (E) picnic and entertainments areas around Barada River.
35
Figure 4.8 Green area by Ecochard master plan Source: (Abdin, Al-Masri, 2008)
In comparing and conclusion
Most of the area (A) located outside the city administrative boundaries and confirmed parts of Al-Ghouta, to heavy agricultural lands, but the illegal settlements spread in it and cost the erosion of Al-Ghouta with the expansion of urban plans of cities and villages, which require second reconsider for those plans.
Area (B) the protected area was not safe from illegal settlements and establishing random buildings in it.
Area (C) the illegal settlements spread to the internal agricultural lands until the urban is connected through it, like in Jobar and in decreased level of green area between Kafar-Sousah and Al-Mazzah, but the east park area part of area (C) was owned by the Damascus municipality after the organizing Al-Adawi and Ruken-Al-Din, but it wasn’t made as a public park, and now its contain some military facilities with no connection to park function.
36
Area (D) the western park have been established with a good amount of separated gardens, but the areas around Barada River was not promoted in the specified way of the plan either inside the city or outside.
Area (E) to be picnic and entertainment area around the river, in this areas some building plans have been certified and done by the Dummar side, also near the city sides of the river several project have been established like Dedman and Sheraton Hotels and the national theatre (Figure 4.8).
The city’s industrial area
The industrial areas provided in the master plan are located in eight areas, two of them specified to be heavy industrial in Adra and Al-Kiswah and both of them outside the administrative boundaries while other six locations are: Al-Qaboun, East and South of Al-Hal Market, next to Al-kadam, south Kafar-Sousah square, next to Al-Moadamyeh and Housh plas. The plan adopted the industrial density as 200/h for light industrial and 150/h for heavy industrial.
In comparing and conclusion:
Qaboun, next to Al-kadam and Housh plas industrial areas matches the plan, but the industrial facilities are a little out of its defined areas on the sides green areas.
South of Kafar-Sousah square industrial area was turned into an administrative area, including Al-Thawra magazine building.
New Al-Hal market ( south of Bab Sharqi) includes part of the organized area of Bab Sharqi and the specified area for it include Al-Dabaghat area which is less than the area on the Master plan.
The industrial area next to Al-Moadamyeh it is not established yet and it is useful to reconsider it the result of corresponding between the Damascus Master plan and the suburbs plans, also it is important to coordinate between Damascus and its suburbs municipalities to move the heavy industrial from the city to appropriate locations (Jaboor, 2001).