Rev Saúde Pública 2005;39(4) www.fsp.usp.br/rsp
A nationwide wealth score based on the 2000
Brazilian demographic census
Aluísio J D Barros and Cesar G Victora
Centro de Pesquisas Epidemiológicas. Universidade Federal de Pelotas. Pelotas, RS, Brasil
Supported by the World Bank through the Reach the Poor Program (Grant n. 7122804).
Presented at the VI Brazilian Congress of Epidemiology, Recife, June 2004, and at the V European Conference on Health Economics, London, September 2004.
Received on 1/12/2004. Approved on 7/4/2005.
Correspondence to:
Aluísio J D Barros
Centro de Pesquisas Epidemiológicas - UFPel Caixa Postal 464
96001-970 Pelotas, RS, Brasil E-mail: [email protected]
Keywords
Socio-economic survey. Censuses. Social class. Income. Poverty. Brazil.
Abstract
Objective
To propose an asset based indicator of wealth for Brazil using variables present in the demographic census.
Methods
The indicator, named IEN (Indicador Econômico Nacional/ National Wealth Score), was developed using 12 assets and the schooling of the household head, through principal component analysis. Data from the 2000 Brazilian Demographic sample was used for deriving the score and for the calculation of decile cut-off points.
Results
The indicator, first component obtained from the analysis with the 13 variables, retained 38% of the total variability, and presented a Spearman correlation of 0,74 with total family income and of 0,67with per capita income. The necessary scores to calculate the indicator are presented, as well as reference distributions for the 27 states and their capitals, the five major regions as for the whole country. An example of use of indicator is presented.
Conclusions
Differently from other economic indicators, the Indicador Econômico Nacional has local reference distributions available, along with the national distribution. It is therefore possible to compare a study sample to the municipal, state or country distribution. The small number of variables allow investigators to calculate the Indicador Econômico Nacional in research studies where economic classification is of interest.
INTRODUCTION
Public health research has a tradition of investigat-ing not only biological but also socio-economic de-terminants of illness. In Latin America investigations on the importance of socio-economic conditions in health status have been conducted for quite a long time.1 This approach demands some socio-economic indicator to classify the study individuals. Most com-monly, schooling of the head of the household and family income have been used, despite all of the dif-ficulties related to collecting good information on the latter, as clearly explained by Ferguson et al.3
The Marxist concept of social class has also been used with success, after an operational definition was proposed in the late eighties in Brazil.2,7 This method classifies people into six groups: under proletariat, typical and atypical proletariat, and petty, new petty and traditional bourgeoisie. Despite its theoretical appeal, it has proved difficult to use, mainly because it requires manual classification of families, as it was not feasible to transform the criteria into a program-mable algorithm.
Rev Saúde Pública 2005;39(4) www.fsp.usp.br/rsp
Brazilian wealth score Barros AJD & Victora CG
veys or epidemiological studies. National, regional, state and local wealth score distributions were gener-ated to serve as a reference to position other study samples in terms of wealth in relation to the desired comparison group. The use of the proposed score makes it possible to compare a given sample against the wealth distribution of several different geographi-cal levels, as well as estimating the proportion of the poor (or of the rich) they include.
M ETH O D S
The 2000 Brazilian Demographic Census collected a limited number of variables from every household in the country. A more detailed questionnaire was applied in a sample of households, chosen randomly in each municipality through systematic sampling within each census tract. The sampling fraction was 10% in municipalities with an estimated population greater than 15,000 people and 20% in the other towns. A total of 5,304,711 households were included in the sample, resulting in a average sampling fraction of 11.7%. The final weights were calculated by IBGE using a calibration technique in relation to a set of variables for which the population totals are known (obtained from the Census universe). Details of the Census sample methodology are described at IBGE homepage.***
Using more than 5 million households to estimate a wealth score is not only impractical but also unnec-essary. The available data was re-sampled using a frac-tion of 10%. This was done by state, using the Stata command sample,9 and varying the pseudo-random number generator seed for each state according to the time (hh:mm:ss) the procedure started. A fixed sam-pling fraction was chosen so that the original weights calculated by IBGE could be used simply multiply-ing them by 10 if population totals were needed.
The score was developed for urban areas only. Ru-ral areas are fairly different from urban areas in terms of infrastructure and way of life, what would justify separate scores. As most research is done for urban areas, this setting was selected for this exercise. A similar score for rural areas may well be developed in the future, if needed. The total study sub-sample was, then, 418,032 households, with the largest state con-tributing 104,348 households and the smallest 690.
Principal components analysis (PCA) was the method of choice for several reasons. There is no need for the variables used with PCA to be of any
particu-*Available in URL: http://www.anep.org.br [24 nov 2004]
**Available in URL: http://www.anep.org.br/codigosguias/CCEB.pdf [24 nov 2004] ***Available in URL: http://www.ibge.gov.br/censo/text_amostragem.shtm Brazil, the first criterion for economic classification based on assets was proposed in 1970 by the Brazil-ian Advertisers Association (ABA). Four classes, labeled from A (richest) to D (poorest), were used in the classification that was based on eight assets, pres-ence of domestic employees and the education level of the household head. This classification was modi-fied in 1976, and a full revision was made in 1978. This time, six assets, domestic employees, and edu-cation were used to classify the population into five groups, labeled A to E.8 Other two revisions have been made so far. In 1996, a revision carried out by the National Association of Market Research Companies* (ANEP), updated the classification using slightly dif-ferent indicators, but maintaining the general idea. A last update was made in 2000 using data from a sur-vey covering nine metropolitan regions. The previ-ous criterion was kept, except for the inclusion of DVD players as an alternative to VCR.** From the beginning, the methodology used aimed at creating a proxy for household income.
One difficulty with this criterion is that it is not feasible to disaggregate the source data into smaller geographical areas. One reason is that the data are not publicly available and such data has not been produced, the other is that the survey did not cover the entire country. Therefore, it is not possible to de-termine the specific distribution of the proposed score for more limited geographical areas. For instance, a study was carried out on households covered by the Family Health Program in the city of Porto Alegre (Rio Grande do Sul State capital, Brazil). In order to compare this population with the whole capital it was necessary to know the economic score distribu-tion for city (which is completely different from the national distribution).
The use of data collected by the 2000 Brazilian Demographic Census (Brazilian Institute of Geogra-phy and Statistics - IBGE) could solve this specific problem and would also offer a general solution for Brazilian investigators, as a score derived from Cen-sus sample data could be calculated for every mu-nicipality of the country, as well as for larger geo-graphical areas such as states and regions.
sur-!
Rev Saúde Pública 2005;39(4) www.fsp.usp.br/rsp
Brazilian wealth score Barros AJD & Victora CG
lar type or have any specific distribution. Its main objective, to summarize the variance of a set of vari-ables, can be achieved with any type of data.6 It pre-cludes data on income or consumption, which are difficult to obtain and frequently are of questionable quality.3 Finally, the score derived is not arbitrary -the first component yielded by PCA captures -the greatest possible amount of the data variability with a single linear combination. PCA has already been evaluated4 and used for this purpose in many situa-tions, such as in the “Country Reports on Health, Nutrition, Population, and Poverty” series published by the World Bank.*
PCA can be performed with the covariance or the correlation matrices of the selected variables, the latter option being equivalent to using standard-ized variables. The results are not the same or a sim-ple function of each other. The difference in results will be most striking when the variances of the vari-ables used are very different. This happens, for ex-ample, when the variables are measured in different scales. In such cases, variables with large variances will dominate the first principal component.5 In the present case, most of the variables are binary, indi-cating the presence of an asset, some of them are counts (e.g., the number of TV sets), and one is cat-egorical (level of education). The use of standard-ized variables (or the correlation matrix) helps to minimize the considerable differences in variance that are observed in this case. When this strategy is used, there is little difference between using the origi-nal variables or a set of indicators for the polytomic variables. Correlation coeff icients between the scores generated by the two alternatives were typi-cally greater than 95%.
In order to obtain a valid wealth score it was
impor-*Available in URL: http://www.worldbank.org/poverty/health/data/index.htm)
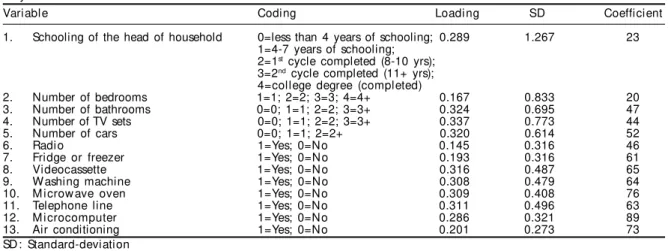
Table 1 - Variables available in the 2000 Brazilian Demographic Census (IBGE) used for creating a wealth score, and how they w ere coded.
Variable Coding Loadi ng SD Coefficient
1. Schooling of the head of household 0=less than 4 years of schooling; 0.289 1.267 23 1=4-7 years of schooling;
2=1st cycle completed (8-10 yrs);
3=2nd cycle completed (11+ yrs);
4=college degree (completed)
2. Number of bedrooms 1=1; 2=2; 3=3; 4=4+ 0.167 0.833 20
3. Number of bathrooms 0=0; 1=1; 2=2; 3=3+ 0.324 0.695 47
4. Number of TV sets 0=0; 1=1; 2=2; 3=3+ 0.337 0.773 44
5. Number of cars 0=0; 1=1; 2=2+ 0.320 0.614 52
6. Radi o 1=Yes; 0=No 0.145 0.316 46
7. Fridge or freezer 1=Yes; 0=N o 0.193 0.316 61
8. Videocassette 1=Yes; 0=N o 0.316 0.487 65
9. W ashing machine 1=Yes; 0=N o 0.308 0.479 64
10. M i crow ave oven 1=Yes; 0=No 0.309 0.408 76
11. Telephone line 1=Yes; 0=No 0.311 0.496 63
12. M icrocomputer 1=Yes; 0=No 0.286 0.321 89
13. Air conditioning 1=Yes; 0=No 0.201 0.273 73
SD : Standard-deviation
tant to work with a reasonable number of variables. On the other hand, an excessive number of assets could make the score impractical for use in small scale stud-ies. Twelve variables related to household assets and size were selected, and the education level of the household head from the 2000 Brazilian Demo-graphic Census. The variables used and how they were coded are shown in Table 1. The upper cut-off points for count variables were chosen based on their dis-tribution, leaving at least 5% of the households in the last groups.
In summary, the principal components analysis was performed using the covariance matrix of 13 variables, and using the sample weights calculated and provided with the data by IBGE. The coefficients were calcu-lated by rounding the expression loading/s.d.x100 to the nearest integer, and the individual scores were ob-tained through the expression Σ civi where ci is the coefficient and vi the coded value of the ith variable. This strategy produced a score that is shifted from the standard PCA score by a fixed amount Σ civiwhere vi is the mean of vi, with the practical advantage that all scores are positive.
After the wealth score was derived, deciles for the country, geographic regions, states and state capitals were calculated. The entire Census sample was used to calculate the deciles for the state capitals, while the study sub-sample was used for the other levels. All analyses were performed with Stata 8.9
RESU LTS
The first principal component was extracted based on the 13 variables presented in Table 1, with the corresponding numeric codes. The results obtained are summarized in the same table, where the variable
" Rev Saúde Pública 2005;39(4) www.fsp.usp.br/rsp
Brazilian wealth score Barros AJD & Victora CG
each population quintile of the wealth score are also shown in Figure 1. There is evident increase in per capita income mean and me-dian values as well as in its dispersion.
Correlations (Pearson) were calculated be-tween the wealth score and total household income and per capita income with values of 0.40 and 0.38, respectively. The correla-tions with the logarithms of income were considerably higher: 0.76 for log total in-come, and 0.68 for log per capita income. Spearman rank correlations were also cal-culated: 0.74 with total household income, 0.67 with per capita income, and 0.75 and 0.68 with their respective logarithms. Due to the sample size (408,976 households), all p-values were virtually zero.
Decile cut-off points for the for the whole country, the five geographic regions and 26 states plus the Federal District (calculated using the study sub-sam-ple) are shown in Table 2. The state and regional dif-ferences are obvious from the table. The Federal Dis-trict (DF), where, the federal capital Brasília is lo-cated, presented the highest median score (484). São Paulo (SP), Brazil most industrialized state, ranked second, with a median score of 463, followed by Santa Catarina (SC), Rio de Janeiro (RJ) and Rio Grande do
Figure 1 - Box plots of per capita income (in Reais), by quintiles of the proposed wealth score.
0
500
1,000
1,500
2,000
2,500
Per capita income
Quintiles of score Excludes outside values
1 2 3 4 5
loadings, standard deviations and the final score co-efficients (loading / std. deviation x 100 rounded to the nearest integer) are presented. The first compo-nent retained 38% of the total data variability, while the second component had only 9%.
For the national sample, the minimum value for the score was 20, the maximum 1,086, the mean 412 and the median 358. The frequency distribution was skewed to the right, though less asymmetrical than income distributions use to be (Figure 1). Box plots showing the distribution of per capita household income for
Table 2 - Deciles of household distribution of the wealth score by Region and State, and for the whole of Brazil, calculated from the study sub-sample.
Percenti l e
Regi on/State 10 20 30 40 50 60 70 80 90
N orth 110 170 203 240 281 326 389 479 630
RO Rondônia 147 197 246 282 321 365 420 505 637
AC Acre 113 171 209 238 281 329 390 475 625
AM Amazonas 133 191 218 261 307 368 443 548 710
RR Rorai ma 150 191 238 281 320 362 433 543 689
PA Pará 104 150 191 220 261 306 369 453 598
AP Amapá 127 173 214 254 304 350 410 479 598
TO Tocantins 86 133 177 214 243 281 324 388 540
N ortheast 112 171 211 238 264 307 366 447 611
M A M aranhão 84 127 165 192 218 258 303 366 485
PI Piauí 107 156 194 236 258 290 341 403 549
CE Ceará 110 157 195 238 261 305 366 453 617
RN Rio Grande do Norte 130 180 218 243 281 324 387 479 646
PB Paraíba 130 177 215 238 261 305 365 453 619
PE Pernambuco 130 180 218 256 282 325 378 474 654
AL Alagoas 110 168 200 238 258 287 345 424 595
SE Sergi pe 134 192 238 258 284 324 372 469 636
BA Bahi a 127 177 218 241 281 324 374 461 613
Southeast 218 264 316 369 425 494 573 671 804
M G M inas Gerais 192 239 281 321 366 415 485 573 718
ES Espírito Santo 195 238 264 306 351 412 486 595 760
RJ Rio de Janeiro 236 267 325 370 429 494 574 675 825
SP São Paulo 238 287 345 399 463 532 609 697 818
South 218 263 313 365 417 480 555 651 785
PR Paraná 214 258 301 344 394 457 536 640 778
SC Santa Catarina 238 287 336 389 441 505 580 672 808
RS Rio Grande do Sul 220 269 324 370 423 486 558 650 784
M id-west 174 235 261 303 345 394 464 564 731
M S Mato Grosso do Sul 179 238 261 304 345 391 453 544 714
M T Mato Grosso 157 215 243 281 321 365 422 509 671
G O Goi ás 172 218 243 281 313 356 415 488 628
D F D istrito Federal 240 304 353 412 484 564 651 761 885
#
Rev Saúde Pública 2005;39(4) www.fsp.usp.br/rsp
Brazilian wealth score Barros AJD & Victora CG
Sul (RS), all located in the South or South-east. On the other extreme, the poorest states were Piauí (PI), Alagoas (AL), Tocantins (TO) and Maranhão (MA), located in the North-east and North of the country. Their median scores ranged from 258 to 218, respectively. The differences are so striking that the me-dian for Maranhão is lower than the first decile cut-off point for São Paulo.
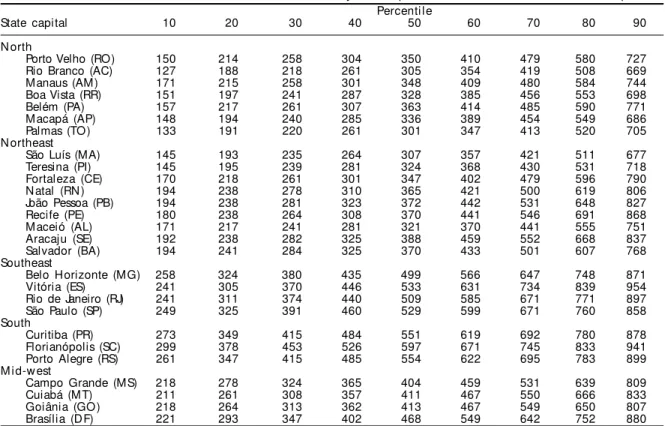
The score deciles for the 26 state capitals
plus the federal capital (using the whole Census sam-ple) are shown in Table 3. People living in the state capitals are evidently better off than the whole state population. It is also clear that the richest states do not make the richest capitals. Among the capitals, Florianópolis (SC), ranks first, followed by Porto Ale-gre (RS) and Curitiba (PR). The city of São Paulo is only fifth in terms of median score. Again, on the low end of the rank are capitals located in the North and Northeast. Palmas (TO), Rio Branco (AC) and São Luís (MA) are the three presenting the lowest median scores.
As a practical application exercise of the score, a sample of approximately 3,000 individuals drawn from areas covered by the Family Health Program in the city of Porto Alegre, (RS) was used. The score was calcu-lated and compared to the distributions for Porto Ale-gre and Brazil. If the sample was similar to the city population, it would be observed a histogram showing five bars close to 20%. Instead, Figure 2 (left
hisgram) shows that the study sample is concentrated to-wards the lower reference quintiles, meaning that the population covered by the Family Health Program in Porto Alegre comes from a much poorer group. Almost 40% of the sample fall below the first quintile cut-off point. On the other extreme, less than 5% of the sam-ple are within the range of the fifth reference quintile.
A different picture emerges when the sample is com-pared to the score distribution of the whole country (Figure 2, right). The sample is now concentrated in the 3rd and 4th reference quintiles. That is, this popula-tion compared to the Brazilian reference is no longer concentrated on poor side, but more towards the mid-dle of the distribution.
D ISCU SSIO N
The availability of census data on income and on household assets provided a unique opportunity for
Figure 2 - Score distribution for a sample of the population living in areas covered by the Family H ealth Program in Porto Alegre (RS) using the reference quintiles for the city and for the country.
0
10
20
30
40
Percent
Quintiles of economic score Porto Alegre as reference
Quintiles of economic score Brazil as reference
1 2 3 4 5
0
10
20
30
40
Percent
1 2 3 4 5
Table 3 - Deciles of household distribution of the wealth score by State capital, calculated from the full Census sample. Percenti l e
State capital 10 20 30 40 50 60 70 80 90
N orth
Porto Velho (RO) 150 214 258 304 350 410 479 580 727
Rio Branco (AC) 127 188 218 261 305 354 419 508 669
Manaus (AM) 171 215 258 301 348 409 480 584 744
Boa Vista (RR) 151 197 241 287 328 385 456 553 698
Belém (PA) 157 217 261 307 363 414 485 590 771
M acapá (AP) 148 194 240 285 336 389 454 549 686
Palmas (TO) 133 191 220 261 301 347 413 520 705
N ortheast
São Luís (MA) 145 193 235 264 307 357 421 511 677
Teresina (PI) 145 195 239 281 324 368 430 531 718
Fortaleza (CE) 170 218 261 301 347 402 479 596 790
N atal (RN ) 194 238 278 310 365 421 500 619 806
João Pessoa (PB) 194 238 281 323 372 442 531 648 827
Recife (PE) 180 238 264 308 370 441 546 691 868
M aceió (AL) 171 217 241 281 321 370 441 555 751
Aracaju (SE) 192 238 282 325 388 459 552 668 837
Salvador (BA) 194 241 284 325 370 433 501 607 768
Southeast
Belo Horizonte (MG) 258 324 380 435 499 566 647 748 871
Vitória (ES) 241 305 370 446 533 631 734 839 954
Rio de Janeiro (RJ) 241 311 374 440 509 585 671 771 897
São Paulo (SP) 249 325 391 460 529 599 671 760 858
South
Curitiba (PR) 273 349 415 484 551 619 692 780 878
Florianópolis (SC) 299 378 453 526 597 671 745 833 941
Porto Alegre (RS) 261 347 415 485 554 622 695 783 899
M i d-w est
Campo Grande (MS) 218 278 324 365 404 459 531 639 809
Cuiabá (MT) 211 261 308 357 411 467 550 666 833
Goiânia (GO) 218 264 313 362 413 467 549 650 807
$ Rev Saúde Pública 2005;39(4) www.fsp.usp.br/rsp
Brazilian wealth score Barros AJD & Victora CG
REFEREN CES
1. Almeida-Filho N, Kawachi I, Pellegrini-Filho AP, Dachs JN. Research on health inequalities in Latin America and the Caribbean: bibliometric analysis 2000) and descriptive content analysis (1971-1995). Am J Public Health 2003;93:2037-43.
2. Barros MB. A utilização do conceito de classe social nos estudos dos perfis epidemiológicos: uma proposta. Rev Saúde Pública 1986;20:269-73.
3. Ferguson B, Tandon E, Gakidou E, Murray CJL. Estimating permanent Income using Indicator variables. Geneva: World Health Organization; 2002.
4. Filmer D, Pritchett LH. Estimating wealth effects without expenditure data-or tears: an application to educational enrollments in states of India.
Demography 2001;38(1):115-32.
5. Johnson RA, Wichern DW. Applied multivariate statistical analysis. Englewood Cliffs, NJ: Prentice-Hall, Inc.; 1982.
6. Jolliffe IT. Principal Component Analysis. New York: Springer; 2002.
7. Lombardi C, Bronfman M, Facchini LA, Victora CG, Barros FC, Béria JV et al. Operacionalização do conceito de classe social em estudos epidemiológi-cos. Rev Saúde Pública 1988;22:253-65.
8. Mattar FN. Análise crítica dos estudos de estratifica-ção socioeconômica de ABA-Abipeme. Rev Adm 1995;30(1):57-74.
developing a wealth score based on a large sample and with national, regional and local representative-ness. Unlike other wealth scores currently available, which only have a national reference distribution, the score can be contrasted to different levels of re-gional aggregation, as shown in the example.
The number of variables to compose the score was kept manageable for small scale surveys and epide-miological studies. The 13 variables that compose the score are straightforward to collect and to code. Other possible variables available in the Census sam-ple data set, such as type of construction materials or coverage by public services were not included. The main reason was that they did not add significantly to the score (results not shown). Also, it was wanted to keep the number of variables small and some of these additional variables are difficult to collect. Specifi-cally, ownership of the house was not included be-cause, contrary to the expected, ownership was more frequent among the poor, while renting was more com-mon acom-mong the better-off. It is also a tricky variable to collect, as many peculiar situations are frequent; for example, the poor often own the shack but not the plot where it is located.
The set of variables selected produced a valid wealth indicator. This is suggested by the behavior of household income across the quintiles of the score. Also, the percentage of the total variability explained by the first PCA component was higher than the 26% obtained by Filmer et al,4 and the Spearman correla-tion was higher than those found by Ferguson et al3 for a PCA score and permanent income: 0.49 for Pa-kistan (38 indicator variables), 0.68 for Greece (24 variables) and 0.73 for Peru (28 variables). Using the
example data from Porto Alegre, the distribution of household income showed the expected increase in the median values by score quintile. Unfortunately, other health related outcomes were not available in this dataset so that it could further validate the score – stunting would have been a nice option.
Higher correlation coefficients were found be-tween the score and total household income, sug-gesting that it is a better proxy for this measure than for per capita income. It is not surprising since the score is not adjusted for the number of people in the household. As a consequence, larger households tend to have a higher score, given there are more people to contribute in economic terms. However, simply dividing the score by the number of people is not a sensible option since economies of scale will not be taken into account. It is obvious that the number of TV sets or cars will not increase steadily with the number of people living in a household. Alterna-tives to correct this score for household size are cur-rently being explored.
In conclusion, it is presented a valid wealth score based on good quality and easily accessible data that can be used for the economic classification of sub-samples from the Census data or for new studies that include information on the 13 variables used. Given the availability of reference distributions for several geographical aggregation levels, it is not only possi-ble to use this score to do a within sample economic classification, but also to compare the sample to the municipality, the state or the country distributions. This score was named IEN, acronym for “Indicador
Econômico Nacional”, or National Economic