EFFECTIVE PRECIPTATION, SOIL LOSS AND PLANT COVER SYSTEMS IN
THE CAATINGA BIOME, BRAZIL
1HELBA ARAÚJO DE QUEIROZ PALÁCIO2, JACQUES CARVALHO RIBEIRO FILHO3*, JÚLIO CÉSAR NEVES
DOS SANTOS4, EUNICE MAIA DE ANDRADE5, JOSÉ BANDEIRA BRASIL5
ABSTRACT – The objective of this work was to evaluate the influence of anthropic activities on the effective precipitation (eP) and soil loss in watersheds under different land uses in a tropical dry forest region. The experimental area was located in the central part of the State of Ceará, Brazil. The land uses evaluated were: fallow Caatinga (FC), thinned Caatinga (TC) and deforested Caatinga followed by a burning procedure and pasture cultivation (DBP). The areas were monitored in the rainy season (January to May, 2010), when 57 natural rainfalls occurred, totaling 941 mm of precipitation. The eP and sediment productions were quantified by the sum of all occurrences during the study period, and the soil loss was represented by suspended and
dragged sediments. The eP was 15.13 mm and sediment produced was 167.81 kg ha-1 in FC conditions. The eP
values was smaller (11.28 mm) in the watershed with TC, which had soil loss sum of 42.04 kg ha-1. The largest
annual eP was found in the DBP area, with 112.88 mm yr-1 of accumulated water depth, which also showed the
greater annual soil loss (3114.97 kg ha-1). The greatest interference of plant cover in the two variables evaluated
occurred in the first precipitation events, when the plants were not yet fully developed.
Keywords: Water erosion. Semiarid region. Surface runoff.
PRECIPITAÇÃO EFETIVA E PERDAS DE SOLO EM DIFERENTES SISTEMAS DE COBERTURA VEGETAL NO BIOMA CAATINGA
RESUMO- O presente estudo objetivou investigar a influência da ação antrópica na precipitação efetiva (Pe) e
nas perdas de solo em microbacias submetidas a diferentes usos do solo em região de floresta tropical seca. A área experimental está localizada na parte central do estado do Ceará, Brasil. Os usos do solo investigados foram: Caatinga em Pousio (CP), Caatinga Raleada (CR) e manejo de Desmatamento da Caatinga seguido de Queima e cultivo de Pastagem (DQP). O monitoramento foi realizado na estação chuvosa (janeiro a maio) de
2010, com uma ocorrência de 57 eventos naturais de chuva, totalizando 941 mm precipitados. Na quantificação
da Pe e produção de sedimentos foi feito um somatório para todos os eventos ocorridos no período de estudo e
nas perdas de solo consideraram-se os sedimentos em suspensão e em arraste. Em condições de pousio, a Pe e a
produção de sedimentos foram de 15,13 mm e 167,81 kg ha-1 respectivamente. Os menores valores de Pe (11,28
mm) ocorreram na microbacia cujo uso da terra era o CR, cujas perdas de solo totalizaram 42,04 kg ha-1. No
uso da terra DQP foi registrada a maior Pe anual com 112,88 mm ano-1 de lâmina escoada acumulada, bem
como as maiores perdas de solo anual (3.114,97 kg ha-1). A maior inferência da cobertura vegetal nos dois
processos investigados ocorreu para os primeiros eventos, quando o estrato herbáceo ainda não estava desenvolvido.
Palavras-Chave: Erosão hídrica. Semiárido. Escoamento superficial.
___________________
*Corresponding author
1Received for publication in 05/27/2015; accepted in 06/24/2016.
Paper extracted from the doctoral thesis of the first author.
2Department of Education, Instituto Federal do Ceará – Campus Iguatu, Iguatu, CE, Brasil; [email protected].
3Department of Environmental and Technological Sciences, Universidade Federal Rural do Semi-Árido, Mossoró, RN, Brasil;
Rev. Caatinga
INTRODUCTION
The intensification of anthropic interference on natural resources in the Brazilian semiarid region has caused degradation of soil and water resources and vegetation and biodiversity loss, which, under the influence of the regional climatic factors, may result in significant changes in hydrological processes, especially rain and overland flow (ALMEIDA et al., 2012; ARAÚJO NETO et al., 2013; RODRIGUES et al., 2013b). Water erosion and sediment production have been a subject of growing concern to all situations related to the soil management and water use (PARANHOS; PAIVA, 2008).
Water erosion is the result of the interaction of precipitations, soil, topography, soil coverage and conservation practices (WISCHMEIER; SMITH, 1978), and is an emerging subject among researchers, since it interferes directly on agricultural productivity and causes economic and environmental damages (KANG et al., 2001; LOBATO et al., 2009; NEVES et al., 2011; TELLES et al., 2011). The quantification of water erosion and information on the physical processes related to it is crucial for develop means to maximize the use of the water resources available and avoid the negative effects of soil erosion (SILVA et al., 2011).
The FAO (1967) established a soil loss limit
of approximately 12.5 Mg ha-1 yr-1 for deep,
permeable and well-drained soils; 2 to 4 Mg ha-1 yr-1
for shallow or impermeable soils and losses between those limits to other soils. The US Soil Conservation
Service estimates this limit in 11.2 Mg ha-1 yr-1 for
agricultural activities and approximately 0.224 and
2.42 Mg ha-1 yr-1 for natural erosion (EFFLAND et
al., 2006). Santos (2009) stated that erosion is the main cause of early depletion of fertile lands. Overland flow of waters that were not retained or infiltrated into the soil, carry soil particles in suspension and nutrients that would be used by plants.
Brazil loses annually at least five hundred million tons of agricultural soil due to erosion (BERTONI; LOMBARDI NETO, 2012), directly influencing the yield of crops and, in some cases, resulting in total loss of productive capacity of the soil. Lima Neto et al. (2011) found sediment
production rate of 1.48 Mg ha-1 yr-1 in Alto Jaguaribe
Basin, which is located in a semiarid region, with
area of 24,600 km2 and approximately 4,000
reservoirs. These sediments were 70% suspended and 30% dragged.
The impact of effective precipitation and sediment production on springs of water courses are more or less pronounced depending on the soil management system adopted, which may cause a
hydrological disconnectivity (WESTER et al., 2014). Several studies evaluate the return on investment and social balance of agroforestry suggest the use of these activities to minimize impacts on the environment (TAVARES FILHO et al., 2011).
Therefore, considering the importance of information on processes related to changes in the soil use, the objective of this work was to evaluate the influence of anthropic activities on the effective precipitation (eP) and soil loss in watersheds under different land uses in a tropical dry forest region.
MATERIAL AND METHODS
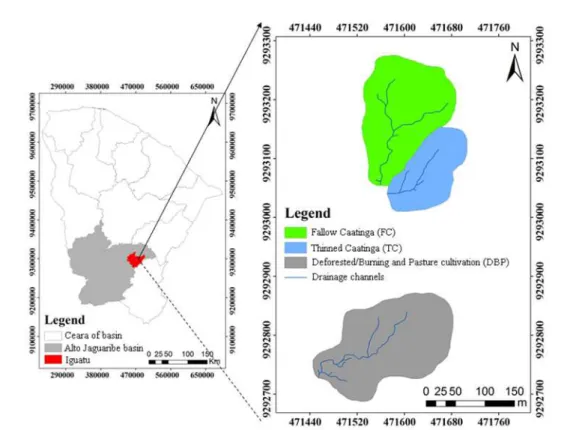
The watersheds evaluated are from the Iguatu Experimental Basin (IEB) located in the Alto Jaguaribe basin, Iguatu, Center South region of the state of Ceará, Brazil (Figure 1), in a Federal area controlled by the Federal Institute of Education, Science and Technology of Ceará, Iguatu campus.
The region climate is type BS (hot semiarid) and the aridity index, according to Thornthwaite, is 0.44, i.e., semiarid, with average potential
evaporation of 1,988 mm yr-1. The average
precipitation (1932-2013) in the county of Iguatu is
864±304 mm, and the temporal distribution of rainfall is 85%, concentrated from January to May, with about 30% in March.
Trenches of two meters deep were opened for soil classification: one between the watersheds with FC and TC, since they were small and adjacent areas; and another in the watershed with BPD. The soils of the two areas were classified as typical Calcic Vertisol (Pellic) (KRASILNIKOV et al.,
2009), relatively deep (2-3 m) with a high content of
silt and clay in the surface and subsurface layers
(Table 1). Due to the type of clay (2:1 montmorillonite), surface cracks develop during dry
periods.
The areas were monitored during the rainy season (January to May) of 2010. Three different land use were evaluated. The first was fallow
Caatinga (FC) in a 2.06-ha watershed densely
covered with Caatinga plants, with original vegetation regenerating for over thirty years. The
second was a thinned Caatinga (TC) in a 1.15-ha
watershed, from which all the trees that had diameter at breast height (DBH) less than 10 cm were removed, allowing the development of herbaceous plants due to higher input of light. The third land use was a deforested Caatinga followed by burning
procedure and pasture cultivation (DBP) in a 2.80-ha
Figure 1. Location of the experimental watersheds in the state of Ceará, Brazil.
Table 1. Granulometric analysis of the watersheds with fallow Caatinga (FC), thinned Caatinga (TC) and deforested Caatinga followed by burning procedure and pasture cultivation (DBP).
(Adapted from PALACIO, 2011).
Precipitation data were obtained from an automated weather station installed in the study area, which contained a rain gauge with data acquisition every five minutes, from which data were collected every 24 hours, according to the methodology described by Dereczynski et al. (2009).
The sum of two precipitation events was used
as a measure of 2-day previous precipitation for
correlation with soil loss. The sum of the precipitation events before each erosive event were calculated for the entire study period. The evaluation of the influence of precipitation height in soil loss was performed by grouping rainfall events in classes: 0.00 to 14.99 mm (Class 1), 15.00 to 29.99 mm (Class 2), 30.00 to 44.99 mm (Class 3), 45.00 to
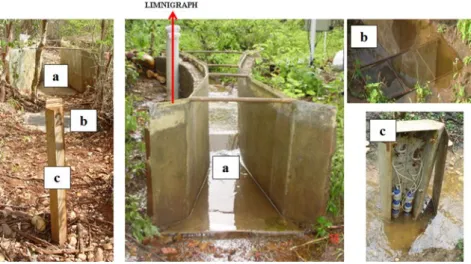
was monitored with a Parshall flume installed on the watersheds estuary. Capacitive level sensors, consisted of an oscillator with frequency set by a capacitor that can vary the dielectric and a fixed resistor of 10 kΩ was used to measure the water level variation in the flume.
The sensors were calibrated, since they measure the frequency by an equation (potential frequency / height of the water column) (Figure 2a), to measure the surface runoff height, with data acquired every five minutes (RODRIGUES et al., 2013a). The surface runoff was determined by Equation 1, following the procedure used by Fang et al. (2012), Rodrigues et al. (2013b) and Zhou et al. (2016).
Watersheds FC e TC DBP
Horizons A B BCv A B1 B2 C1
Deep (cm) 0 a 5 5 a 21 21 a 31 0 a 25 25 a 103 103 a 116 116 a 137
Physical parameters
Sand (g kg-1) 137 205 182 315 291 166 322
Silt (g kg-1) 447 405 470 425 387 502 478
Clay (g kg-1) 416 390 348 260 322 332 200
Rev. Caatinga
Where: Q is the Parshall flume flow (L s-1); W is the
width of the flume bottleneck (cm), with value of 47.5 for FC and TC and 30 for the DBP flume; and h is the height of the water in the flume (cm).
The monitoring of the sediment production
upstream in the flume was performed with 180-liter
pits collecting dragged sediment in the river course
and a tower for collect suspended sediments (Figure 2 b and c).
Figure 2. Parshall flume (a), pit to collect dragged sediments (b) and tower to collect suspended sediments (c). Flow data of suspended and dragged
sediments were collected immediately after a hydrological event, with collections performed always at the same time. The retained material was homogenized in the pit and, subsequently, 500 mL of the dragged sediments were collected to determine the total solids, following the methodology of Piveli and Kato (2005). The pit was emptied after each collection and thus prepared for the new runoff event.
The automatic sediment collecting tower had
six 100-mL bottles spaced 15 cm apart. The water
was collected through a tube connected to the bottle (Figure 2c), and the atmospheric air was released by a respirator system (plastic tubes) that had contact with the atmospheric air at the top of the tower. The samples were collected soon after the surface runoff events that reached the collection point in the sediment tower. The total solid concentration analysis was carried out in the Water, Soil and Plant Tissue Laboratory of the IFCE, Iguatu campus, following the methodology described by Piveli and Kato (2005).
The elements that most influenced the soil losses were assessed by applying the Pearson's correlation method on the soil losses, total
precipitation, I30 (maximum intensity of precipitation
in thirty minutes), accumulated rainfall of the last
two days and runoff, using the software SPSS-16.0.
Correlations were subjected to the T test a 1% level of significance.
RESULTS AND DISCUSSION
The results of the influence of land use on soil losses showed that the area with deforested Caatinga followed by burning procedure and pasture cultivation (DBP) had the greatest soil loss, which
were 74-fold higher than the area with thinned
Caatinga (TC) and 19-fold higher than the area with
fallow Caatinga (FC) (Table 2). The influence of vegetation removal and the use of fire on soil loss was evident, since this was the first year of management after the burning procedure in the area (ARAUJO NETO, 2012; WESTER et al., 2014). The
TC area had less soil loss, with loss 4-fold smaller
than the FC, proving to be an efficient soil protection management for the region (RODRIGUES et al., 2013b).
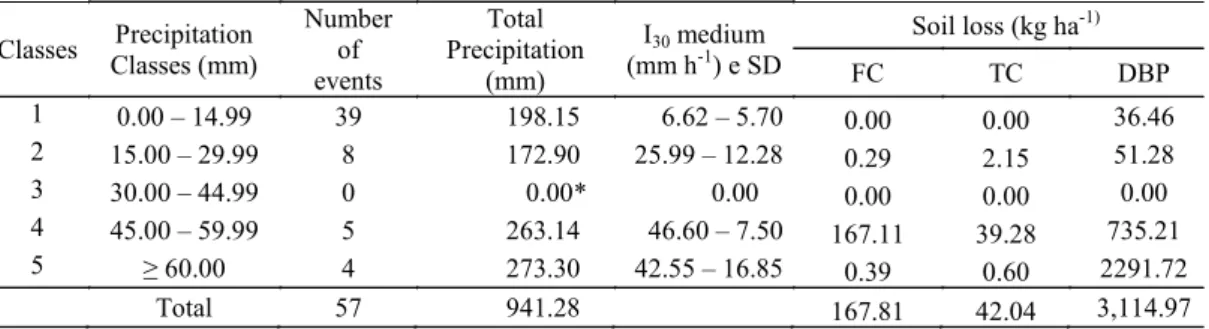
Table 2. Precipitation classes, number of events and characteristics of precipitation per class and soil loss in the experimental watersheds of Iguatu, Ceará, Brazil, in 2010.
Classes Precipitation Classes (mm)
Number of events
Total Precipitation
(mm)
I30 medium (mm h-1) e SD
Soil loss (kg ha-1)
FC TC DBP
1 0.00 – 14.99 39 198.15 6.62 – 5.70 0.00 0.00 36.46
2 15.00 – 29.99 8 172.90 25.99 – 12.28 0.29 2.15 51.28
3 30.00 – 44.99 0 0.00* 0.00 0.00 0.00 0.00
4 45.00 – 59.99 5 263.14 46.60 – 7.50 167.11 39.28 735.21
5 ≥ 60.00 4 273.30 42.55 – 16.85 0.39 0.60 2291.72
Total 57 941.28 167.81 42.04 3,114.97
SD - Standard Deviation; * No precipitation events was recorded for this class.
Significant increases in the runoff water depth and soil loss was found with precipitation over 45 mm (Table 2), which had higher responses from the
DBP area, which reached soil loss of 3,027 kg ha-1
(97% of total losses). The least amount of soil lost in this range of precipitation occurred in the watershed
with TC, with 40 kg ha-1 (95% of the total losses).
The FC area had soil loss of 167 kg ha-1, resulting
from precipitation events over 50 mm, corresponding to 99.8% of the total soil loss during the year. Fang et al. (2012) found that the effect of vegetation, as a physical barrier for surface runoff, increases the possibility of the runoff water generated upstream to infiltrate in the soil and the likelihood of sediment deposition due to the lack of means of transport, not reaching the basin estuary.
The highest number of precipitation events was within the Class 1 precipitation (lowest or equal to 14.99 mm), however, they did not produced sediments in the FC and TC areas. Class 1 precipitations caused soil loss in the DBP area, but accounted for only 1% of the sediment produced in the studied period (Table 2). Fang et al. (2012) evaluated rainfall events related to runoff and sediment production in an area in Three Gorges, China, and found that rainfall lower than 31.8 mm and larger than 54 mm were the main cause of runoff and sediment production on managed watersheds.
The water interception by vegetation was another fact that also prevented soil loss in Caatinga areas. Izidio et al. (2013) evaluated rainfall interception in the Caatinga biome and observed higher interception by vegetation in precipitation events with heights lower than 20 mm, contributing to prevent surface runoff.
The analysis of the water and soil loss in all erosive events in the period showed that the land management influenced both parameters evaluated and that the DBP area had the highest water loss
(Table 3), which was 10-fold higher than the FC area
and 7.5-fold higher than the TC area (THOMAZ,
2009; RODRIGUES et al., 2013b; LEA et al., 2014).
Therefore, the TC area was more effective in reducing soil loss than water loss, with the effect of runoff water depths on soil loss markedly influenced by the land use, confirming the findings of Rodrigues et al. (2013a).
The highest soil losses occurred in the first two precipitation events of the year for the watershed with DBP (Table 3), soon after the burning procedure in the area, when the grass was still in an early phenological stage, not covering the soil.
Moreover, these precipitations had the highest I30
(maximum intensity of precipitation in thirty minutes). Zhou et al. (2016) assessed the influence of rain on soil loss and found that the determining
factor for the formation of erosive groups was the I30.
Wester et al. (2014) also studied the interaction of these factors and pointed the soil exposure as a major factor for sediment transport in areas that had a burning procedure.
Rev. Caatinga
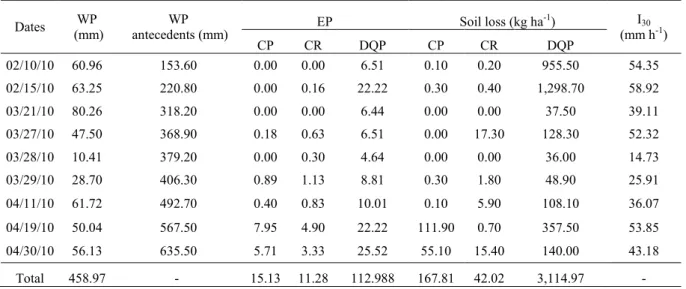
Table 3. Rain, effective precipitation, soil loss and I30 (maximum intensity of precipitation in thirty minutes) in the
experimental watersheds of Iguatu, Ceará, Brazil, in 2010.
WP – Water Precipitation; EP – Effective Precipitation. The soil lost in the three areas presented different magnitudes, however, precipitations over
45 mm presented higher I30 (Table 3), accounting for
over 95% of soil loss of each area. Thus, these events represent almost the entire erosion of the areas. Neves et al. (2011) evaluated watersheds in southwestern Mato Grosso State and found 78% of soil losses in pasture areas over a Red Argisol. Almeida et al. (2012) evaluated soil loss in the Brazilian semiarid region and found reduction of 68% in runoff after ten years of fallow, compared to a degraded area.
The soil loss from the last two precipitation classes (Table 2) showed that the watersheds with TC and FC lost more soil from precipitation of these
classes (over than 45 mm), which had the highest I30
(Table 3).The watershed with DBP lost more soil
with precipitation greater than 60 mm, even with I30
lower than those found in Class 4. Two of these events occurred when the soil of this watershed was also not covered, since the planted grass was in early
development. According to Rodrigues et al. (2013a), after the plants provide a good coverage of the soil, sediment runoff is reduced, and the study of the connectivity, which evaluates the sediments deposited over the drainage channels is necessary.
Linear relations were developed to identify the parameters that presented higher correlation with the soil loss occurred in the watersheds, considering the total sediment production (suspension and dragged) as a dependent variable, and as independent variables, the total precipitation, maximum intensity
of precipitation in thirty minutes (I30), precipitation
accumulated in 2 days and runoff (Table 4). The highest correlation with the runoff were found in the watershed with FC. The highest correlation with the
I30 were found in the watershed with DBP, however,
the watershed with TC had very low correlations. Runoff and sediment production in semiarid regions are dependent on the interaction of various factors, and cannot be explained by isolated factors (ZHOU et al., 2016).
Table 4. Linear correlation between soil loss and rainfall and runoff in the experimental watersheds of Iguatu, Ceará, Brazil, in 2010.
* significant correlation at 1%.
Overall, no predominance of any variable explained the soil loss in the three watersheds at the same time, thus suggesting that soil loss mechanisms are different in the three areas. Rodrigues et al. (2013a) pointed out that from the first events, the
vegetation of the Caatinga regrow its leaves, presenting greater vegetation coverage, leaving crop residues on the ground, acting as energy dissipation points, thus promoting greater probability of infiltration, favoring water retention in the system
Dates WP
(mm)
WP antecedents (mm)
EP Soil loss (kg ha-1) I
30 (mm h-1)
CP CR DQP CP CR DQP
02/10/10 60.96 153.60 0.00 0.00 6.51 0.10 0.20 955.50 54.35
02/15/10 63.25 220.80 0.00 0.16 22.22 0.30 0.40 1,298.70 58.92
03/21/10 80.26 318.20 0.00 0.00 6.44 0.00 0.00 37.50 39.11
03/27/10 47.50 368.90 0.18 0.63 6.51 0.00 17.30 128.30 52.32
03/28/10 10.41 379.20 0.00 0.30 4.64 0.00 0.00 36.00 14.73
03/29/10 28.70 406.30 0.89 1.13 8.81 0.30 1.80 48.90 25.91
04/11/10 61.72 492.70 0.40 0.83 10.01 0.10 5.90 108.10 36.07
04/19/10 50.04 567.50 7.95 4.90 22.22 111.90 0.70 357.50 53.85
04/30/10 56.13 635.50 5.71 3.33 25.52 55.10 15.40 140.00 43.18
Total 458.97 - 15.13 11.28 112.988 167.81 42.02 3,114.97 -
Variables Soil loss (kg ha
-1 )
FC TC DBP
Total precipitation (mm) -0.250 0.343 0.448
I30 (mm h-1) 0.269 0.161 0.663*
Antecedents precipitation of 2 days (mm) 0.512 0.172 0.431
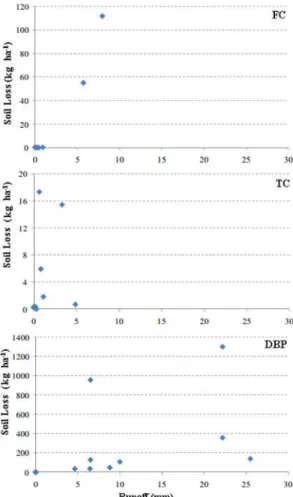
and changing the pattern of hydrological responses. The results show that the runoff mechanism is
more important than the total precipitation and the I30
to understand soil losses in the watershed with FC, where the effective precipitation showed correlation of 0.980 at significance level of 1% with the sediment production (Table 4). This fact is also
represented in Figure 3 by the increase in soil loss with an increase in water depth (ZHOU et al., 2016). The soil loss scales in Figure 3 are different, but clearly shows that the flow does not define the patterns of soil loss in the watersheds with TC and DBP.
Figure 3. Surface runoff and soil loss in watersheds with FC, TC and DBP in Iguatu, Ceará, Brazil, in 2010.
The variable that had the highest correlation
with soil loss in the DBP area was the I30. This
variable is directly related to rainfall erosion capacity (WISCHMEIER; SMITH, 1978). However, the soil loss occurred in the watershed with FC showed no significant correlation with any of the variables evaluated, therefore, soil losses are dependent on other variables for this vegetation coverage, which were not assessed in this study (Table 4). Kang et al. (2001) reported that the emergence of thinned herbaceous vegetation of great light penetration, with conservation of plant residues on the soil, favors the infiltration and contributes to the maintenance of water in the system, reducing surface runoff.
The TC and FC areas presented a trend to increase soil loss in the last events of April, despite the dynamics of the processes involved. However, the DBP had a pronounced peak of soil loss in
cause a Hortonian runoff.
February 10 and 15 presented 60.96 and
62.25 mm of total precipitation, I30 of 54.35 and
58.92 mm h-1 (Table 3), soil humidity of 39 and 40%,
causing soil loss of 955 and 1,299 kg ha-1,
respectively (Table 4). In these days, the vegetation in the DBP area had not yet developed and the area was not covered, since the Andropogon gayanus Kunt grass was planted only 40 days before this period. Greater soil loss was found in other studies from areas that had burning procedures in the first runoff events (THOMAZ, 2009). Wester et al. (2014) pointed out the soil exposure as a major sediment transport factors in areas that had burning procedures.
The evolution and magnitude of total soil loss during the experiment was different in each area
Rev. Caatinga
impermeable soils (Table 5). On the other hand, the total soil loss from the Caatinga environment at
regeneration for over 30 years was 0.18 Mg ha-1 yr-1,
showing a limit of soil loss below those recommended by FAO (1967), which are from 2 to 4 Mg ha-1 yr-1.
Table 5. Soil loss and its fractions for individual events in the experimental watersheds of Iguatu, Ceará, Brazil, in 2010.
The distribution of sediment fractions produced in the watersheds showed that the watershed with TC had produced 86% of dragged sediments, while the watershed with CF produced only 0.7% of this fraction, and the watershed with DBP had 9% of its sediments in this fraction (Table 5). This result needs more detailed studies to determine whether, in semiarid conditions, the sediment production can be monitored with only the fraction of suspended sediments. Lima Neto et al. (2011) evaluated sediment production in the Alto
Jaguaribe Basin (20,670 km2) and found 21% of the
total sediment production transported by dragging.
CONCLUSIONS
Precipitations with heights greater than 45 mm accounted for 57% (Fallow Caatinga), 94%
(Thinned Caatinga) and 97% (Deforested
Caatinga-Burning-Pasture) of the production of
suspended and dragged sediments in the watersheds. The lower sediment production and runoff were found in the thinned Caatinga area, and this area had the greatest loss by drag, different from the other areas, which denotes the need to assess whether soil losses in managed areas in the semiarid region can be evaluated considering only the suspended sediments.
Effective precipitation was the factor that most influenced the sediment production in the watershed with fallow Caatinga, with a correlation of 0.98, however, this correlation was not significant for the managed areas.
The absence of vegetation coverage in the
first precipitation events caused the largest soil losses to the watershed with deforested Caatinga followed by burning procedure and pasture cultivation.
ACKNOWLEDGEMENTS
The authors thank the National Council for Scientific and Technological Development (CNPq) for financial support and the Foundation for Support Scientific and Technological Development of the State of Ceará (FUNCAP) for financial support and the scholarships granted to the authors.
REFERENCES
ALMEIDA, C. L.; OLIVEIRA, J. G. B.; ARAÚJO, J. C. Impacto da recuperação de área degradada sobre as respostas hidrológicas e sedimentológicas
em ambiente semiárido. Water Resources and
Irrigation Management, Cruz das Almas, v. 1, n. 1,
p. 39-50, 2012.
ARAUJO NETO, J. R. Efeito de diferentes
manejos sobre o escoamento superficial em microbacias experimentais no semiárido tropical. 2012. 128 f. Dissertação (Mestrado em Engenharia
Agrícola: Área de Concentração em Manejo de
Bacias Hidrográficas) - Universidade Federal do
Ceará, Fortaleza, 2012.
ARAÚJO NETO, J. R. et al. Análise comparativa do escoamento superficial de microbacias experimentais
em clima semiárido tropical. Water Resources and
Date of events
Precipitation (mm)
Soil loss ( kg ha-1)
FC TC DBP
Suspended In drag Total Suspended In drag Total Suspended In drad Total
01/20/10 52.6 0.0 0.0 0.0 0.0 0.0 0.0 0.0 1.7 1.7
01/27/10 27.9 0.0 0.0 0.0 0.0 0.0 0.0 0.0 0.3 0.3
02/08/10 7.4 0.0 0.0 0.0 0.0 0.0 0.0 0.0 0.5 0.5
02/10/10 61.0 0.0 0.1 0.1 0.0 0.2 0.2 921.3 34.2 955,5
02/15/10 63.2 0.0 0.3 0.3 0.0 0.4 0.4 1,274.2 24.5 1,298.7
03/21/10 80.3 0.0 0.0 0.0 0.0 0.0 0.0 0.0 37.5 37.5
03/27/10 47.5 0.0 0.0 0.0 0.0 17.3 17.3 126.7 1.5 128.3
03/28/10 10.4 0.0 0.0 0.0 0.0 0.0 0.0 0.0 36.0 36.0
03/29/10 28.7 0.0 0.3 0.3 0.0 1.8 1.8 47.7 1.2 48.9
04/11/10 62.2 0.0 0.1 0.1 0.0 5.9 5.9 43.5 64.5 108.1
04/16/10 18.5 0.0 0.0 0.0 0.0 0.3 0.3 0.0 1.9 1.9
04/19/10 50.0 111.8 0.2 111.9 0.0 0.7 0.7 325.4 32.0 357.5
04/30/10 56.1 54.9 0.2 55.1 6.0 9.4 15.4 95.0 45.0 140.0
05/05/10 19.3 0.0 0.0 0.0 0.0 0.0 0.0 0.0 0.2 0.2
Irrigation Management, Cruz das Almas, v. 2, n. 3,
p. 111-120, 2013.
BERTONI, J.. LOMBARDI NETO, F. Conservação
do Solo. 8. ed. São Paulo, SP: Ícone, 2012, 335 p.
DERECZYNSKI, C. P.; OLIVEIRA, J. S.; MACHADO, C. O.. Climatologia da precipitação no
município do Rio de Janeiro. Revista Brasileira de
Metereologia, São José dos Campos, v. 24, n. 1, p. 24-38, 2009.
EFFLAND, W. R. et al. “A Digital Collection of
Selected Historical Publications on Soil Survey and Soil Classification in the United States of America”, Soil Survey Division, USDA Natural Resources Conservation Service, Washington, DC. 2006.
EMPRESA BRASILEIRA DE PESQUISA
AGROPECUÁRIA. EMBRAPA. Sistema
Brasileiro de Classificação de Solos. 3. ed. Rio de Janeiro, RJ: Embrapa Solos, 2013. 353 p.
FAO – FOOD AND AGRICULTURE
ORGANIZATION OF THE UNITED NATIONS.
La erosion del suelo por El água: algunas medidas para combatirla en las tierras de cultivo. Roma, 1967. 207 p.
FANG, N. F. ET AL. The effects of rainfall regimes and land use changes on runoff and soil loss in a
small mountainous watershed. Catena, Amsterdam,
v. 99, n. 1, p. 1-8, 2012.
IZÍDIO, N. S. C. et al. Interceptação da chuva pela vegetação da caatinga em microbacia no semiárido
cearense. Agro@mbiente On-line, Boa Vista, v. 7,
n. 1, p. 44-52-52, 2013.
KANG, S. et al. Runoff and sediment loss responses to rainfall and land use in two agricultural catchments on the Loess, Plateau China.
Hydrological Processes, Malden, v. 15, n. 6,
p. 977-988, 2001.
KRASILNIKOV, P. V.. A Handbook of Soil
Terminology, Correlation and Classification. Earthscan. London. 2009, 440p.
LEA, W.; DAN, M.; RONEL, B. The differential response of surface runoff and sediment loss to
wildfire events. Catena, Amsterdam, v. 121, n. 1,
p. 241-247, 2014.
LIMA NETO, I. E.; WIEGAND, M. C.; ARAÚJO, J. C. Sediment redistribution due to a dense reservoir network in a large semiarid Brazilian basin.
LOBATO, F. A. O. et al. Perdas de solo e nutrientes em área de Caatinga decorrente de diferentes alturas
pluviométricas. Agro@mbiente On-line, Boa Vista,
v. 3, n. 2, p. 65-71, 2009.
NEVES, S. M. S. et al. Estimativa de perda de solo por erosão hídrica na bacia hidrográfica do Rio
Jauru/MT. Sociedade & natureza, Uberlândia, v.
03, n. 3, p. 423-434, 2011.
PALÁCIO, H. A. Q. Avaliação emergética de
microbacias hidrográficas do semiárido submetidas a diferentes manejos. 2011. 159 f.
Tese (Doutorado em Engenharia Agrícola: Área de
Concentração: Manejo de Bacias Hidrográficas)
-Universidade Federal do Ceará, Fortaleza, CE, 2011.
PARANHOS, R. M; PAIVA, J. B. D. Avaliação de metodologia de estimativa de produção de sedimentos em uma pequena bacia rural de encosta.
Revista Brasileira de Recursos Hídricos, Porto
Alegre, v. 13, n. 1, p. 7-18, 2008.
PIVELI, R. P.. KATO, M. T. Qualidade das águas
e poluição: aspectos físico-químicos. 1. ed. São
Paulo, SP: ABES, 2005. 285 p.
RODRIGUES, J. O. et al. Sediment loss in semiarid
small watershed due to the land use. Revista Ciência
Agronômica, Fortaleza, v. 44, n. 3, p. 488 - 498,
2013a.
RODRIGUES, J. O. et al. Respostas hidrológicas em pequenas bacias na região semiárida em função do
uso do solo. Revista Brasileira de Engenharia
Agrícola e Ambiental, Campina Grande, v. 17, n. 3,
p. 312-318, 2013b.
SANTOS, L. L. Quantificação do escoamento superficial e erosão do solo em regiões semiáridas.
Revista Brasileira de Geografia Física, Recife,
v. 2, n. 1, p. 14-25, 2009.
SILVA, R. M.; SANTOS, C. A. G.; SRINIVASAN, V. S. Perdas de água e sedimento em diferentes sistemas de manejo no semiárido da Paraíba.
Mercator, Fortaleza, v. 10, n. 21, p. 161-170, 2011.
TAVARES FILHO, J.; FERREIRA, R. R. M.; FERREIRA, V. M. Fertilidade química de solo sob pastagens formadas com diferentes espécies nativas e com Brachiaria decumbens manejadas com
queimadas anuais. Semina: Ciências Agrárias,
Londrina, v. 32, n. 1, p. 1771-1782, 2011.
TELLES, T. S.; GUIMARÃES, M. F.; DECHEN, S.
C. F. The Costs of Soil Erosion. Revista Brasileira
Rev. Caatinga
THOMAZ, E. L. The influence of traditional steep land agricultural practices on runoff and soil loss.
Agriculture, Ecosystems and Environment,
Amsterdam, v. 130, n. 2, p. 23-30, 2009.
WESTER, T.; WASKLEWICZ, T.; STALEY, D. Functional and structural connectivity within a
recently burned drainage basin. Geomorphology,
Amsterdam, v. 206, n. 2, p. 362–373, 2014.
WISCHMEIER, W. H; SMITH, D. D. Predicting
rainfall erosion losses: A guide to conservation
planning. Washington: USDA, 1978. 58 p. (Agricultural Handbook, 537).
ZHOU, J. et al. Effects of precipitation and
restoration vegetation on soil erosion in a semi-arid
environment in the Loess Plateau, China. Catena,