www.hydrol-earth-syst-sci.net/16/231/2012/ doi:10.5194/hess-16-231-2012
© Author(s) 2012. CC Attribution 3.0 License.
Earth System
Sciences
Assessing water resources in China using PRECIS projections and a
VIC model
G. Q. Wang1,2, J. Y. Zhang1,2, J. L. Jin1,2, T. C. Pagano3, R. Calow4, Z. X. Bao1,2, C. S. Liu1,2, Y. L. Liu1,2, and X. L. Yan1,2
1State Key Laboratory of Hydrology-Water Resources and Hydraulic Engineering, Nanjing Hydraulic Research Institute, Nanjing 210029, China
2Research Center for Climate Change, Ministry of Water Resources, Nanjing 210029, China 3CSIRO Land and Water, Melbourne, Victoria, Australia
4Overseas Development Institute, London, SE1 7JD, UK
Correspondence to:G. Q. Wang (gqwang@nhri.cn)
Received: 17 June 2011 – Published in Hydrol. Earth Syst. Sci. Discuss.: 25 July 2011 Revised: 24 November 2011 – Accepted: 2 January 2012 – Published: 25 January 2012
Abstract.Climate change is now a major environmental and developmental issue, and one that will increase the challenge of sustainable water resources management. In order to as-sess the implications of climate change for water resources in China, we calibrated a Variable Infiltration Capacity (VIC) model with a resolution of 50×50 km2using data from 125 well-gauged catchments. Based on similarities in climate conditions, soil texture and other variables, model parame-ters were transferred to other areas not covered by the cal-ibrated catchments. Taking runoff in the period 1961–1990 as a baseline, we studied the impact of climate change on runoff under three emissions scenarios, A2, B2 and A1B. Model findings indicate that annual runoff over China as a whole will probably increase by approximately 3–10 % by 2050, but with quite uneven spatial and temporal distribu-tion. The prevailing pattern of “north dry and south wet” in China is likely to be exacerbated under global warming.
1 Introduction
Global warming caused by increasing atmospheric concen-trations of carbon dioxide and other trace gases has become evident. There is broad consensus that the Earth’s surface air temperature increased by about 0.74◦during the last century, with the greatest increases occurring in the 1990s. Moreover, global temperature increases are likely to continue in the 21st century and will probably be accompanied by changes in pre-cipitation (IPCC, 2007).
In China, changes in surface air temperature are simi-lar to those experienced globally, with increases of about 0.5–0.8◦during the 20th century, slightly exceeding global temperature change in this period. During the last 50 yr from 1950 to 2000, air temperature has increased by 1.1◦, with the warmest decade occurring in the 1990s. Northeast China, north China and northwest China experienced signif-icant warming in terms of annual average temperatures, with most warming occurring in winter and spring, as expected. In contrast, there has been no significant long-term change in country-averaged annual precipitation. However, an obvi-ous drying trend in the Yellow River basin and significant in-crease in rainfall for the Yangtze River basin were detectable over the last 50 years of the 20th century (Ding et al., 2006). Global warming is likely to change precipitation patterns and will probably raise the frequency of extreme events.
Climate change and greater climate variability are ex-pected to alter the timing and magnitude of runoff, with sig-nificant implications for water resources, water infrastructure and water resources management. Competition for water at different scales, and between different uses and users, is in-creasing rapidly; floods and drought remain major economic as well as social issues; and environmental issues around wa-ter quality and quantity rank high amongst public (and polit-ical) concerns. Developing a better understanding of the im-pact of climate change on water systems in China is therefore a high priority.
models to this problem; some have claimed that, due to large uncertainties, climate models are not suitable for as-sessing water resources, and that it is not realistic to expect the level of accuracy required for adaptation-type analysis (Kiem et al., 2011; Kundzewicz et al., 2010), while oth-ers argue that model projections of future climate change are still useful despite their large uncertainties. Many stud-ies have assessed water resources using projections from cli-mate models to drive rainfall-runoff models, thus estimating runoff and stream flow. Conceptual watershed models are often believed to be useful in assessing the impacts of cli-mate change on regional hydrology (Arnell, 1999; Zhang et al., 2007). Gleick et al. (1987) developed a monthly water-balance model specifically for climate change impact assess-ment and addressed the advantage of using conceptual water-shed models in practice. Loukas et al. (1996) applied a UBC watershed model to study the effects of climate change on the hydrological regime of two climatically different British Columbia watersheds, the Upper Campbell and Illecilewaet watersheds. Huntington et al. (2006) investigated the rela-tionships between mean annual temperature, annual precip-itation and evapotranspiration (ET) for 38 forested water-sheds in New England, USA, and concluded climate warm-ing could reduce runoff significantly. Roger et al. (2005) estimated the sensitivity to climate change of mean annual runoff in 22 Australian catchments using selected hydrologi-cal models, showing how results varied between models. Us-ing ArcGIS Geostatistical Analyst, Fu et al. (2007) devel-oped a method to study the impacts of climate change on re-gional hydrological regimes in the Spokane River watershed. This study indicated that a 30 % increase in precipitation could result in a 50 % increase in stream flow; conversely, a 20 % decrease in precipitation could results in a 25–30 % reduction in stream flow. Using a NAM model, Hans et al. (2006) investigated the influence of climate change on river discharge in five major Danish rivers for the future pe-riod of 2071–2100, finding a 12 % increase in runoff. In China, Li et al. (2008) projected an approximately 5 % de-crease in runoff for the headwater region of the Yellow River with an improved XAJ model and ensemble projections of Global Climate Models (GCMs) used in IPCC AR4. Zhang et al. (2009) assessed hydrological responses of the Yellow River to hypothetical climate scenarios using a snowmelt-based water balance model, demonstrating the role soil and water conservation measures could play in reducing the sen-sitivity of runoff to climate change.
The Intergovernmental Panel on Climate Change (IPCC) has reviewed and referenced the latest studies on climate change and water resources, ranging from local to conti-nental scales and representing a wide variety of physio-graphic conditions (IPCC, 2008). Previous studies indicate that stream flow is highly sensitive to changes in precipita-tion, as well as to changes in temperature. A 10 % change in precipitation, all other things being equal, can result in a 12–25 % change in runoff; a 2◦rise in temperature can lead
to a 5–12 % decrease in runoff; and runoff in semi-arid or arid areas is more sensitive to climate change than runoff in humid areas (Zhang et al., 2007, 2009; IPCC, 2008). The majority of studies focus on catchments. Nationwide studies, including those in China, have been rare because of variable climate conditions, land cover, morphology and topography. Nationwide modelling in China has also been limited by the lack of calibrated catchments, which often results in some-what higher uncertainty for ungauged areas.
The objectives of this study are (1) to assess climate change impacts in China by applying a VIC model at the national level with up to 125 calibrated catchments, (2) to in-vestigate climate change across China by using projections of climate model, and (3) to explore the likely impacts of climate change on water resources.
2 Data and methods
2.1 Description of VIC model
To assess likely changes in water resources, we needed to better understand changes in the hydrological cycle, espe-cially in evapotranspiration. Energy flux plays a vital role in the hydrological cycle. The Variable Infiltration Capac-ity (VIC) model is a physically-based hydrological model that can simulate the physical exchange of water and en-ergy among the soil, vegetation and atmosphere in a surface vegetation-atmospheric transfer scheme. The VIC model was developed by Liang et al. (1994) and later improved by Lohmann et al. (1998), and Liang and Xie (2001). No-tably, it includes (1) both water-balance and energy-balance parameterization; (2) two types of runoff-yielding mecha-nisms, based on saturation and infiltration excess; (3) con-sideration of sub-grid-scale soil heterogeneity; and (4) pro-cesses of snow accumulation and melt, as well as soil freez-ing and thawfreez-ing. Therefore, we used the VIC model in this study.
The VIC model divides study catchments into grid cells and the soil column of each grid into three layers. The upper two layers, designed to represent the dynamic response of soil to rainfall events, were usually combined into one layer in our modelling. The lower soil layer is used to character-ize the behavior of seasonal soil moisture. Three types of evaporation are considered (http://www.hydro.washington. edu/Lettenmaier/Models/VIC/): (1) evaporation from wet canopy; (2) evapotranspiration from dry canopy; and (3) evaporation from bare soil. Stoma resistance is used to re-flect the effects of radiation, soil moisture, vapor pressure deficiency, air temperature and other factors in calculations of transpiration from the canopy (Lu et al., 2010; Xie et al., 2007).
In order to consider the heterogeneity of soil properties, we employed a soil storage capacity distribution curve and an infiltration capacity curve. The double curves are individu-ally described as power functions with a parameterBas the exponent. Base flow occurs in the lowest layer only and is described using the ARNO method (Habets, 1999). A one-dimensional Richards equation is used to describe the verti-cal soil moisture movement (Lu et al., 2010; Xie et al., 2007). Estimates of surface flow and base flow are mathematically described as follows:
Qd=
P+W0−W0max
P+W0−W0max
1−
1−I0+P
Im 1+B
I0+P≥Im
I0+P≥Im (1)
Qb=
Ds·Dm
Ws·Wc
2
·W2−
Ds·Dm
Ws·W2c
·W2−+Dm−DsW·Dsm
·
W−
2−Ws·Wc
2 W2c−Ws·W2c
2
0≤W2−≤Ws·W2c
W2−> Ws·W2c
(2)
WhereQd is surface flow,Qbis base flow,P is precipita-tion,W0is initial soil moisture of the upper soil layer,W0max is maximum soil moisture of the upper soil layer,I0is initial infiltration rate, Im is maximum infiltration rate, B is vari-able infiltration curve parameter,Dmis maximum daily base flow,Dsis the fraction ofDmin which non-linear base flow
occurs,W2cis maximum soil moisture in the lower soil layer,
W2−is initial soil moisture in the lower soil layer, andWs is
the fraction ofW2cin which non-linear base flow occurs. The maximum soil moisture in each soil layer (d1,d2andd3) is estimated based on soil texture and soil layer thickness.
There are many measures available to evaluate model per-formance, including coefficient of correlation (R), Nash– Sutcliffe efficiency coefficient (NSE), root-mean-squared er-ror (RMSE) and mean absolute percentage erer-ror (MAPE), among which the Nash and Sutcliffe efficiency criterion is a normalized statistic reflecting the relative magnitude of the residual variance compared to the measured data variance (Nash and Sutcliffe, 1970; Wang et al., 2009). It is easy to compare the performance of hydrological models for differ-ent catchmdiffer-ents with NSE. For the purpose of hydrological simulation, we needed not only a good fit between observed and simulated runoff series, but also a good balance of total water mass. Therefore, the NSE criterion and the relative er-ror of volumetric fit (RE) were both employed as objective functions to calibrate the model. A good simulation result will have NSE close to 1 and RE approaching 0.
2.2 Data set
The VIC model requires data on soils, vegetation and hydro-meteorology. Vegetation data sets are derived from Ad-vanced Very High Resolution Radiometer (AVHRR), which provides information on global land classification at 1 km resolution. Vegetation parameters, including architectural resistance, minimum stomata resistance, leaf-area index,
albedo, roughness length and zero-plane displacement, are derived mainly from the Land Data Assimilation System (LDAS) (Hansen, et al., 2000; Xie et al., 2010). The clas-sification of soil texture is based on global 5-min data pro-vided by the National Oceanic and Atmospheric Administra-tion (NOAA) hydrology office. The values for soil-related parameters, including porosity, saturated soil potential and saturated hydraulic conductivity, are derived from the work of Cosby et al. (1984) and Raw et al. (1976).
The forcing data used for the VIC model include daily precipitation, air temperature, solar radiation, vapor pressure and wind velocity. Due to the limited coverage of meteo-rological data, only daily precipitation and daily maximum and minimum air temperatures are used, while other forc-ing terms are given default values. There are 2650 meteoro-logical stations in China with available data (among which 673 stations are from the Chinese Meteorology Administra-tion (CMA) and 1977 staAdministra-tions are from the Ministry of Water Resources (MWR)). Daily precipitation and daily maximum and minimum air temperatures from 1955 to 2008 were col-lected to drive the VIC model.
As the VIC model is run through grid cells, the whole of China is divided into 4160 cells with a resolution of 0.5◦×0.5◦. There are many gridding methods available in the literature, including the Method of Inverse Distance to a Power, the Kriging method, the Minimum Curvature method, the Nearest Neighbor method, the linear distance weighted interpolation method, etc. Zhang et al. (2007) evaluated the performance of different gridding methods by comparing areal average precipitations and temperatures derived from gridding data and recorded data from meteorological stations respectively, at different scales, and found the linear distance weighted interpolation method performs well, with relative errors of annual precipitation ranging from−2.4 % to 3.8 % and absolute errors of annual mean temperature ranging from
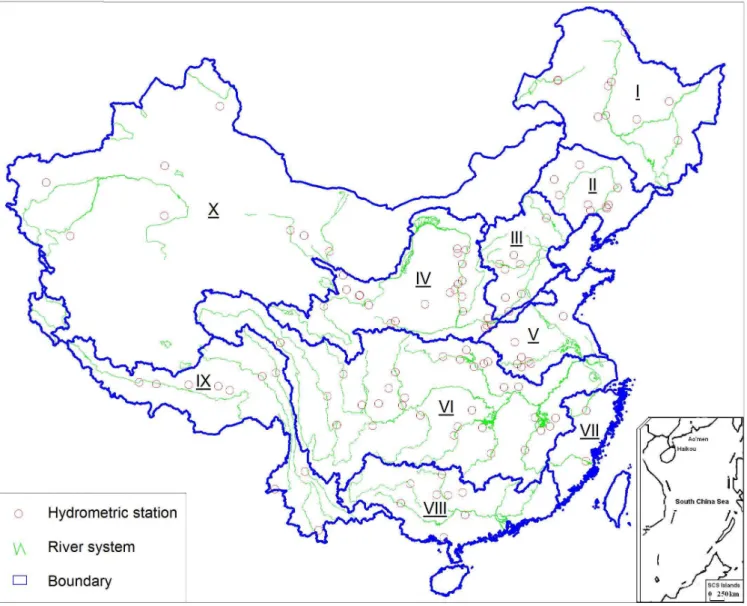
−0.31◦ to 0.26◦. Using this method, we interpolated me-teorological data at 2650 stations for each grid cell. Daily discharges at the outlet stations of 125 sub-basins in ten ma-jor water regions were used to calibrate and validate the VIC model, and daily discharges at 15 key hydrometric stations on major rivers with large drainage areas were employed to test model performance in large-scale hydrological simula-tions. The major river systems in China and the locations of 125 hydrometric stations on sub-catchments are shown in Fig. 1. Table 1 provides information on the characteristics of the 15 key hydrometric stations on the major rivers.
Table 1.River basins used to test model performance.
No. River Gauging site Longitude Latitude Area (km2) Data series
1 Songhuajiang River Yilan 129.55◦ 46.33◦ 491 706 1956–2008
2 Songhuajiang River Ha’erbin 126.58◦ 45.77◦ 389 769 1956–2008
3 Liaohe River Tieling 123.83◦ 42.33◦ 120 764 1956–2008
4 Haihe river Luanxian 118.75◦ 39.73◦ 44 100 1956–2008
5 Haihe River Shixiali 114.62◦ 40.22◦ 23 627 1956–2008
6 Yellow River Lanzhou 103.82◦ 36.07◦ 229 224 1956–2008
7 Yellow River Huaxian 109.77◦ 34.58◦ 106 498 1956–2008
8 Huaihe River Wangjiaba 115.60◦ 32.43◦ 30 630 1956–2008
9 Huaihe River Wujiadu 117.38◦ 32.93◦ 121 330 1956–2008
10 Yangtze River Shigu 99.93◦ 26.90◦ 244 489 1956–2008
11 Yangtze River Beipei 106.42◦ 29.85◦ 156 142 1956–2008
12 Yangtze River Huangzhuang 112.58◦ 31.20◦ 142 056 1956–2008
13 Pearl River Tian’e 107.17◦ 25.00◦ 105 535 1956–2008
14 Pearl River Gaoyao 112.47◦ 23.05◦ 351 535 1956–2008
15 Minjiang River Zhuqi 119.10◦ 26.15◦ 54 500 1956–2008
Table 2.Statistical features of the VIC model parameters for 125 calibrated catchments.
Parameter Physical interpretation Maximum Minimum Mean
B Exponent of variable infiltration curve 0.37 0.02 0.26
Dm Maximum daily base flow (mm) 1.2 31 17.2
Ds Fraction ofDmin which non-linear base flow occurs 0.2 0.01 0.11
Ws Fraction of maximum soil moisture in the lower soil 0.9 0.6 0.82
layer for which nonlinear base flow occurs
d1 Thickness of the first soil layer (m) 0.05 0.1 0.07
d2 Thickness of the second soil layer (m) 1.5 0.2 0.7
d3 Thickness of the third soil layer (m) 1.5 0.4 0.8
3 Results and discussion
3.1 Discharge simulation and regional parameterization
There are seven hydrological parameters in the VIC model that need to be calibrated with recorded daily stream flow. Previous studies have documented how flows in some of the major rivers in north China have been strongly influenced by intensive human activities since the late 1970s (Xu, 2009; Wang, 2001). In order to eliminate the effects of human ac-tivity on runoff, data from 1961–1980 were therefore used to calibrate the model. Thus, the calibrated model param-eters should reflect the situation prior to major abstractions and other human influences throughout the basin. Data se-ries were divided into two periods: a period from 1961 to 1975 for model calibration, and a period from 1976 to 1980 for model validation. The simulation results for each sub-catchment, described using the Nash and Sutcliffe efficiency criterion (NSE) and relative error (RE), are illustrated in Figs. 2 and 3, respectively.
Figures 2 and 3 show that the VIC model performs well, in general, for each catchment. NSEs range from 68.2 % to 93.3 % for the calibration period and 61.6 % to 92.4 % for the verification period. REs for both periods fall in a small range of−7.1 % to +8.2 %, with more than 80 % of REs falling in the range±5 %.
Hydrological model parameters reflect the hydrological features of a catchment, which are determined to some ex-tent by climate conditions and soil texture. Statistics for cal-ibrated parameters of the VIC model in 125 selected catch-ments are given in Table 2.
As shown in Table 2, there are four dimensional parame-ters and three non-dimensional parameparame-ters in the VIC model. In general, the spatial distributions of the thicknesses of the three soil layers are in accordance with the distribution of soil type and texture, with higher values occurring in the Jianghuai plain, the Tibetan plateau and north China, and lower values in the Sichuan basin, the Yungui plateau and south China.Dmvaries greatly across space with higher
val-ues in humid areas and cold areas, and lower valval-ues in dry areas. Ws andB range from 0.6–0.9 and 0.02–0.37,
Fig. 1.Major river systems in China and locations of sub-catchments for model calibration.
ofDm. Ds is not as sensitive as other parameters, with the highest value occurring in northwest China and lower values in other regions.
As the calibrated catchments comprise all types of soil tex-ture, to model any objective grid cell outside the calibrated catchments, we selected the most similar calibrated catch-ment, defined as the nearest catchment with the same domi-nant soil type. The calibrated hydrological parameters of the most similar catchment were then transferred to the objective grid cell not covered by the calibrated catchments. In order to test the performance of the VIC model in large-scale hy-drological simulations with transferred parameter values, we statistically compared the simulated and recorded runoffs at 15 key hydrometric stations on major rivers (Table 3). The simulated and recorded runoffs for 1961-1980 at the Beipei hydrometric station in southern China and at the Tangnaihai
hydrometric station in northwest China are graphed in Figs. 4 and 5, respectively.
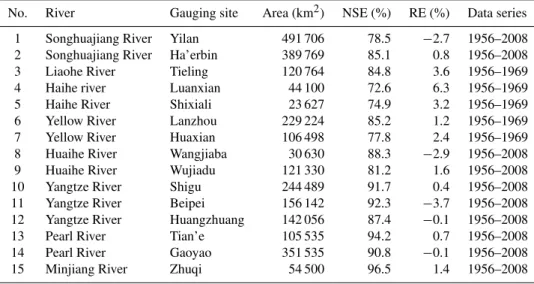
Table 3.Results of simulation of monthly discharges at 15 key hydrometric stations on major rivers in China.
No. River Gauging site Area (km2) NSE (%) RE (%) Data series
1 Songhuajiang River Yilan 491 706 78.5 −2.7 1956–2008
2 Songhuajiang River Ha’erbin 389 769 85.1 0.8 1956–2008
3 Liaohe River Tieling 120 764 84.8 3.6 1956–1969
4 Haihe river Luanxian 44 100 72.6 6.3 1956–1969
5 Haihe River Shixiali 23 627 74.9 3.2 1956–1969
6 Yellow River Lanzhou 229 224 85.2 1.2 1956–1969
7 Yellow River Huaxian 106 498 77.8 2.4 1956–1969
8 Huaihe River Wangjiaba 30 630 88.3 −2.9 1956–2008
9 Huaihe River Wujiadu 121 330 81.2 1.6 1956–2008
10 Yangtze River Shigu 244 489 91.7 0.4 1956–2008
11 Yangtze River Beipei 156 142 92.3 −3.7 1956–2008
12 Yangtze River Huangzhuang 142 056 87.4 −0.1 1956–2008
13 Pearl River Tian’e 105 535 94.2 0.7 1956–2008
14 Pearl River Gaoyao 351 535 90.8 −0.1 1956–2008
15 Minjiang River Zhuqi 54 500 96.5 1.4 1956–2008
50 60 70 80 90 100
0 20 40 60 80 100 120
catchment number
N
a
s
h
an
d S
u
tc
lif
fe
e
ff
ic
ien
c
y
(%
)
NSE-C NSE-V
Fig. 2. Nash and Sutcliffe efficiency criterion for each sub-catchment in the calibration period and validation period (NSE-C: Nash and Sutcliffe efficiency criterion in calibration period, NSE-V: Nash and Sutcliffe efficiency criterion in validation period).
-10 -5 0 5 10
0 20 40 60 80 100 120
catchment number
Re
la
ti
v
e
e
rro
r
(%
)
Fig. 3.Relative error of volumetric fit for each site.
0 2000 4000 6000 8000 10000 12000
1961 1964 1967 1970 1973 1977 1980
Time(Year)
D
is
c
h
ar
ge
(m
3/
s
)
recorded simulated
Fig. 4. Recorded and simulated monthly discharges at the Tang-naihai station in the Yellow River basin, with a drainage area of 121 972 km2(NSE = 90.1 %, RE =−4.2 %).
0 2000 4000 6000 8000 10000 12000
1961 1965 1969 1973 1977
Time(Year)
Di
s
c
h
a
rg
e
(m
3/s
)
recorded simulated
6.0 7.0 8.0 9.0 10.0
2001 2011 2021 2031 2041 2051
A n nu al m e an t em pe rat u re/ ℃ A1B A2 B2
Fig. 6. Projected annual mean air temperature over China under emissions scenarios A1B, A2 and B2.
500 550 600 650 700 750 800
2001 2011 2021 2031 2041 2051
an nu al prec ip it a ti o n / m
m A1B A2 B2
Fig. 7. Projected annual precipitation over China under emission scenarios A1B, A2 and B2.
3.2 Climate change scenarios for the next 50 yr
Xu et al. (2005) and Zhang et al. (2006) used the Hadley Centre RCM system-PRECIS (Providing Regional Climates for Impacts Studies, PRECIS) model to analyze changes in temperature and precipitation over the whole of China under SRES (Special Report on Emission Scenarios) scenarios A2, B2 and A1B in the 21st century. Financially supported by the ACCC project (Adapting Climate Change in China), Xu et al. improved the RCM-PRECIS model to project climate change with a resolution of 0.5◦×0.5◦, consistent with the resolution of the VIC model. The projected country-averaged annual air temperature and the projected annual precipitation over China under these emissions scenarios are shown in Figs. 6 and 7, respectively.
Figures 6 indicates that projected annual mean air tem-peratures under the three emission scenarios rise steadily at an annual average rate of approximately 0.045◦, with the highest rate being 0.055◦annum−1under scenario A1B, much higher than previous rates cited by the IPCC (IPCC, 2007). Figure 7 indicates that annual precipitation is ex-pected to rise slightly, with high variability (from 530 mm to 790 mm annum−1). On average, projected annual precip-itation for the period 2021–2050 increases by 2.1 %–8.7 % compared with the 19610–1990 baseline.
China’s climate varies significantly over time and space because of the influence of topography and monsoon
con-ditions. Projections indicate a significant warming trend across China for the period 2021–2050, with the largest tem-perature increases being 1.58◦–2.25◦ for the Songhuajiang
River basin and 1.63◦–2.25◦ for the northwestern part of China. The trend of increasing rainfall over this period is particularly pronounced in southeast China, the Liaohe River basin and northwest China, with increases of 5 %–11.2 %, 3.6 %–15.4 % and 4.8 %–13.7 %, respectively, compared to the 1961–1990 baseline. Drying will probably occur in the Yellow River basin and central China.
3.3 Water resource scenarios for the next 50 yr
China is divided into ten major water regions, including the Songhuajiang River basin, the Liaohe River basin, the Haihe River basin, the Yellow River basin, the Huaihe River basin, the Yangtze River basin and the Pearl River region (Fig. 1). Based on estimations of synchronous runoff data for a 50-yr period from 1956–2005, mean annual runoff for China as a whole is 2712×109m3, equivalent to a mean runoff depth of 284 mm. More than 70 % of total runoff occurs in the flood season from June to October in most areas. South China to the Yangtze River accounts for 36.5 % of the geographical area, but has as much as 81 % of total water resources.
The calibrated VIC model was run on 4160 grid cells continuously from 1961–2050 to estimate runoff at each cell given the climate projections of RCM-PRECIS under SRES emission scenarios A2, B2, and A1B. Taking simu-lated runoff in the period 1961–1990 as a baseline, we statis-tically analyzed changes in runoff for the period 2021-2050 in the ten drainage basins listed above (Table 4).
Table 4 shows that different scenarios are associated with different changes in annual runoff over China. Scenario A1B leads to the greatest increases in runoff, with increases in all areas of China except the Yellow River basin, an average in-crease of 11.3 % for China as a whole, a 2.1 % dein-crease in the Yellow River basin and a maximum increase of 20.8 %, oc-curring in the Liaohe River basin. Scenario A2 gives qualita-tively similar results except in the Songhuajiang River basin, where a 4 % decrease in annual runoff is projected. Under scenario B2, annual runoff is projected to decline in most ar-eas of northern China, with a maximum decrar-ease of 10.8 % in the Songhuajiang basin.
Table 4.Changes in runoff for 2021-2050 under scenarios A1B, A2 and B2.
No. River basin Changes in annual runoff (%) Runoff change in Jun–Sep (%)
A2 B2 A1B A2 B2 A1B
I Songhuajiang River basin −4.0 −10.8 1.1 −5.5 −11.7 1.4
II Liaohe River basin 2.6 −6.4 20.8 1.5 −7.4 21.4
III Haihe River basin 5.2 −3.3 11.3 3.3 −7.7 10.3
IV Yellow River basin −4.1 −6.4 −2.1 −7.7 −10.8 −4.2
V Huaihe River basin 6.0 −1.2 12.9 6.1 −3.1 10.5
VI Yangtze River basin 6.6 0.7 8.2 8.2 3.1 4.2
VII Region of southeast China 9.1 8.3 13.2 11.4 12.0 12.3
VIII Pearl River basin 0.9 −3.0 11.8 0.5 1.1 10.1
IX Region of southwest China 0.8 0.3 3.6 0.7 −0.4 4.6
X Region of northwest China 0.2 2.4 2.6 −0.9 2.4 0.6
China as a whole 2.9 −0.7 11.3 3.4 0.9 9.1
Over China as a whole, with the exception of a 0.7 % decrease in annual runoff under scenario B2, annual runoff is projected to increase by between 2.9 % and 11.3 %, with flood-season runoff increasing by between 0.9 % and 9.1 %.
Shown in Fig. 8 are the spatial distributions of changes be-tween the baseline and 2021–2050 in average runoff annually and during flood season (June to September), under the A1B, A2 and B2 scenarios. The figure shows that the projected changes in annual and flood-season patterns are generally similar for a same scenario, but that changes are greater un-der scenario A1B compared to scenarios A2 and B2. Unun-der all three scenarios, runoff will increase in southeast China, and decrease in most of the northeast and central areas, par-ticularly in the Yellow River basin. Although increases in runoff are projected for most of the northwest under A1B, the opposite occurs under A2 and B2. The existing pattern of “north dry and south wet” will likely be exacerbated under global warming.
Although we present likely trends for changes in runoff, these projections of future water resources carry high uncer-tainty due to uncertainties in emission scenarios, in the out-puts from GCMs, in downscaling approaches and in the as-sessment model itself. The issue of uncertainty should there-fore be addressed in further studies.
4 Summary and conclusions
Our VIC model, with a resolution of 50×50 km2, was cali-brated with 125 well-gauged catchments. Based on similar-ities in climate conditions, soil texture and other properties, model parameters were transferred to ungauged areas. The VIC model simulates monthly discharge well in catchments of various sizes, indicating that parameter transfer based on hydrological similarity is a feasible way of implementing re-gional parameterization of the VIC model across China.
Model results for runoff across China differ depending on the SRES scenario used. In general, southeast China may
experience greater rainfall and runoff in the coming decades, while central China is likely to face greater water scarcity. The pattern of “north dry and south wet” will probably be exacerbated.
Although changes in projected runoff are uncertain, re-gional water shortages and rere-gional flooding remain key is-sues that are likely to grow in importance. Climate change will add to the challenges of water resource management by introducing greater variability in water systems and chang-ing flow conditions in surface water systems, amplifychang-ing ex-isting patterns of shortage and excess. Effective adaptation strategies will be needed to respond to these trends and safe-guard economic growth and poverty reduction efforts under the 12th five-year plan.
Acknowledgements. This study has been financially supported by the National Basic Research Program of China (grant 2010CB951103), the International Science & Technology Coop-eration Program of China (grant 2010DFA24330) and the ACCC (Adapting Climate Change in China) project funded by DFID, SDC and DECC. Thanks also to the anonymous reviewers and editors.
Edited by: E. Toth
References
Arnell, N. W.: A simple water balance model for the simulation of stream flow over a large geographic domain, J. Hydrol, 217, 314–355, 1999.
Loukas, A. and Quick, C. M.: Effect of climate change on hydrolog-ical regime of two climathydrolog-ically different watersheds, J. Hydrol. Eng., 2, 77–87, 1996.
Cosby, B. J.: A statistical exploration of the relationships of soil moisture characteristics to the physical properties of soils, Water Resour. Res., 20, 682–697, 1984.
Fu, G. B., Michael, E. B., and Chen, S. L.: Impacts of climate change on regional hydrological regimes in the Spokane River Watershed, J. Hydrol. Eng., 12, 452–461, 2007.
Gleick, P. H.: The development and testing of a water balance model for climate impact assessment: modeling the Sacramento basin, Water Resour. 23, 267–282, 1987.
Habets, F.: The ISBA surface scheme in a macroscale hydrological model applied to the Hapex-Mobilhy area – Part I: Model and database, J. Hydrol., 217, 75–89, 1999.
Hans, T.: The influence of climate change on stream flow in Danish rivers, J. Hydrol., 333, 226–238, 2007
Huntington, T. G.: Climate warming could reduce runoff signifi-cantly in New England, USA, Agr. Forest Meteorol., 117, 193– 201, 2003
IPCC.: Climate Change 2007: The Physical Science Basis, Cam-bridge University Press, CamCam-bridge, UK, 156–178, 2007. IPCC.: Climate Change and Water, Cambridge University Press,
Cambridge, UK and New York, USA, 65–87, 2008.
Kiem, A. S. and Verdon, D. C.: Steps toward “useful” hy-droclimatic scenarios for water resource management in the Murray Darling Basin, Water Resour. Res., 47, W00G06, doi:10.1029/2010WR009803, 2011.
Kundzewicz, Z. W. and Stakhiv, E. Z.: Are climate models “ready for prime time” in water resources management applications, or is more research needed?, Hydrol. Sci. J., 55, 1085–1089, 2010. Li, L., Hao, Z. C., Wang, J. H., Wang, Z. H., and Yu, Z. B.: Im-pact of future climate change on runoff in the head region of the Yellow River, J. Hydrol Eng., 13, 347–354, 2008.
Liang, X. and Xie, Z.: A new surface runoff parameterization with subgrid-scale soil heterogeneity for land surface model, Adv. Water Res., 24, 173–193, 2001.
Liang, X., Lettenmaier, D. P., and Wood, E. F.: A simple hydro-logical model of land surface water and energy fluxes for general circulation models, J. Geophys., 99, 14415–14428, 1994. Lohmann, D., Raschke, E., and Nijssen, B.: Regional scale
hydrol-ogy – I: Formulation of the VIC-2L model coupled to a routing model, Hydrol. Sci. J., 43, 131–141, 1998.
Lu, G. H., Wu, Z. Y., and He, H.: Processes of Hydrological Cycle and Quantitative Forecasting, (In Chinese), Science Press, Bei-jing, China, 2010.
Nash, J. E. and Sutcliffe, J.: River flow forecasting through concep-tual models: Part 1 – A discussion of principles, J. Hydrol., 10, 282–290, 1970.
Rawls, W. and Yates, P.: Calibration of Selected Infiltration Equa-tions for the Georgia Coastal Plain, US Department of Agricul-ture, Agricultural Research Service, Washington DC, USA, 113, 121–134, 1976.
Roger, N., Francis, H. S., Walter, C., and Zhang, L.: Estimating the sensitivity of mean annual runoff to climate change using se-lected hydrological models, Adv. Water Resour., 29, 1419–1429, 2005.
Wang, G. Q., Jia, X. A., Chen, J. N., Zhang, Y., Li, H. B., and Wang, Y. Z.: Analysis on the transition point of hydrological series impacted by human activities – a case study of Wudinghe basin in the middle reaches of the Yellow River, J. Water Res. Water Eng., 12, 13–15, 2001.
Wang, W. C., Chau, K. W., Cheng, C. T. and Qiu, L.: A comparison of performance of several artificial intelligence methods for fore-casting monthly discharge time series, J. Hydrol, 374, 294–306, 2009.
Xie, Z. H., Yuan, F., Duan, Q. Y., Zheng, J., Liang, M. L., and Chen, F.: Regional Parameter Estimation of the VIC Land Sur-face Model: Methodology and Application to River Basins in China, J. Hydrometeorol, 8, 447–468, 2007.
Xu, J. H., Li, X. Y., Chen, J. J., Gao, Y. J., and Li, M.: Impact of Water Conservancy Projects on Storm Flood and Sediment Yield in the Middle Reaches of the Yellow River, Yellow River Press, Zhengzhou, China, 2009.
Xu, Y. L., Huang, X. Y., and Zhang, Y.: Statistical analyses of cli-mate change scenarios over China in the 21st century, Adv. Clim. Change Res., 1, 80–83, 2005
Zhang, J. Y. and Wang, G. Q.: Impacts of Climate Change on Hy-drology and Water Resources. Science Press, (In Chinese), Bei-jing, China, 7–112, 2007.
Zhang, J. Y., Wang, G. Q., He, R. M., and Liu, C. S.: Variation trends of runoffs in the Middle Yellow River basin and its re-sponse to climate change, (In Chinese with an English abstract), Adv. Water Sci., 20, 153–158, 2009.