www.ccarevista.ufc.br ISSN 1806-6690
Effect of defoliation on production components at different growth
stages of cowpea
1Efeito da desfolha em diferentes estádios fenológicos do feijão-caupi sobre
componentes de produção
Oscar José Smiderle2*, Hyanameyka Evangelista de Lima-Primo2, Haroldo Duarte Barbosa3 and Aline das
Graças Souza4
ABSTRACT -Cowpea (Vigna unguiculata (L.) Walp.) is an important crop for food and the main source of plant protein for tropical and subtropical regions of the world. The objective of this study was to verify the influence of defoliation levels in three stages of development of cowpea plants cv. ‘BRS Bragança’ on production components. The experiment was carried out at Embrapa Roraima in a greenhouse adopting the completely randomized design with five replications arranged in a factorial scheme 3 x 3. Three phenological stages (trifoliate leaves, flowering, and pod production) and three levels of defoliation (0%; 33% and 67%) were considered. The number of pods per plant (nPPl), number of seeds per pod (nSP), number of seeds per plant (nSPl), mass of seeds per plant (mSPl, g), yield estimate (ePROD, kg ha-1) and mass of
one thousand seeds (m1000S, g) were evaluated. The production components of cowpea cv. BRS Bragança varied with the growth stages of the plant and defoliation levels. Defoliation levels do not influence the number of seeds per pod at the three growth stages, although the mass of one thousand seeds is reduced with defoliations of 33 and 67%. Defoliation above 33% at the flowering stage reduces the number of seeds per plant, mass of seeds, and pods per plant, as well as yield estimate. On the other hand, defoliations of 67% reduced the number of pods per plant and seeds per pod at the flowering and pod production stages, respectively.
Key words:Vigna unguiculata. Number of pods per plant. Number of seeds per pod. Mass of seeds per plant.
RESUMO - O feijão-caupi (Vigna unguiculata(L.) Walp.) é uma cultura importante para a alimentação, sendo a principal fonte de proteína vegetal da população de regiões tropicais e subtropicais do mundo. Objetivou-se verificar a influência de níveis de desfolha em três estádios de desenvolvimento de plantas de feijão-caupi cv. BRS Bragança sobre componentes de produção. O trabalho foi realizado em casa-de-vegetação da Embrapa Roraima, adotando-se o delineamento inteiramente casualizado, com cinco repetições, dispostos em esquema fatorial, 3 x 3, considerando três estádios fenológicos (trifólios; florescimento e produção de vagem) e três níveis de desfolha (0;33 e 67%). Avaliou-se o número de vagens por planta (nVP), o número de sementes por vagem (nSV), número de sementes por planta (nSPl), massa de sementes por planta (mSPl, g), estimativa da produtividade (ePROD, kg ha-1) e a massa de mil sementes (M1000S, g). Os componentes de produção da BRS Bragança
variam com os estádios fenológicos da planta e níveis de desfolha. O número de sementes por vagem não é influenciado pelos níveis de desfolha nos três estádios fenológicos, mas a massa de 1000 sementes é reduzida com desfolhas de 33 e 67%; desfolhas acima de 33%, no estádio de florescimento, causam redução no número de sementes por planta, na massa de sementes e de vagens por planta e na estimativa de produtividade, enquanto que desfolhas de 67% reduzem o número de vagens por planta, no estádio de florescimento e no estádio de vagem o número de sementes por vagem.
Palavras-chave:Vigna unguiculata. Número de vagens por planta. Número de sementes por vagem. Massa sementes por planta.
DOI: 10.5935/1806-6690.20170099 * Autor para correspondência
Recebido para publicação em 13/08/2016; aprovado em 10/01/2017
1Pesquisa financiada pela Empresa Brasileira de Pesquisa Agropecuária (Embrapa-RR)
2Empresa Brasileira de Pesquisa Agropecuária, Centro de Pesquisa Agroflorestal de Roraima, Caixa Postal 133, Boa Vista, RR, Brasil, 69.301-970,
INTRODUCTION
Cowpea, which is also known as macassar bean or string bean (Vigna unguiculata (L.) Walp.), is a legume
grown in South and Central America, Asia, Oceania, Southwestern Europe and the United States (ASFAW; BLAIR, 2012). Data from 2012 indicated that 2.94 million tons were harvested in Brazil, with a yield of 1037.24 kg ha-1 (FAO, 2016), and production was concentrated in the
northeastern region of the country. Brazil is the fifth largest producer of cowpea, whereas the largest are Nigeria and Niger (GUILHENet al., 2016).
This bean is the staple food of the low-income populations in the northern and northeastern states of Brazil (LIMA et al., 2011). In the northeast, the main producing states are Ceará, Piauí, and Bahia (MELVILLE
et al., 2016), in which family farmers (SILVAet al., 2010) grow this bean on uplands.
Due to climate adversities, the second crop of 2013/14 in the northern and northeastern regions of the country suffered a drop of 142.8 thousand tons (EMBRAPA, 2016). Furthermore, although the national average yield is low (309 kg ha-1), cultivar potential
can be up to 2.000 kg ha-1 (MOURAet al., 2014). The
main causes of these yields are related to the irregularity of rains, inadequate water supply in irrigated cultivation, use of low technological level systems, and phytosanitary problems (MATOS FILHOet al., 2009).
Phytosanitary problems such as web blight, which is caused by the fungusRhizoctonia solani Kühn
[Thanatephorus cucumeris (Frank) Donk], can limit crops under favorable conditions to its occurrence (NECHET; HALFELD-VIEIRA, 2006). Bacterial blight caused by Xanthomonas axonopodis pv. vignicola
(MORETTI et al., 2007) is considered a disease that
damages crops. In Brazil, it occurs more specifically in the states of Ceará, Piauí, and Roraima (LIMA-PRIMO
et al., 2015; MOURAet al., 2014; HALFELD-VIEIRA; NECHET; SOUZA, 2011). Defoliator insects, such as
Diabrotica speciosaandCerotoma arcuata(Coleoptera: Chrysomelidae), as well as fall armywormSpodoptera frugiperda, striped grass looper Mocis latipes, and black armyworm Spodoptera cosmioides(Lepidoptera: Noctuidae) (FREIRE FILHOet al., 2005) also occur in cowpea crops.
In order to control agricultural pests, there must be an economic interest. Thus, the minimum number of leaves that a plant should have to enable a maximum of fruits or roots should be discussed (NAKANO, 2011). Studies of artificial defoliation are useful for simulating damage to plants, such as those by defoliator insects.
Studies have shown that the common bean
Phaseolus vulgaris L. can stand considerable levels of
defoliation, varying with the season and intensity of defoliation (SCHMILDTet al., 2010). Mouraet al. (2014), in a study with BR 17- Gurguéia, found that defoliation of 60% in the vegetative phase reduces grain yield, while in the reproductive phase 47% of defoliation affects yield.
However, no studies on leaf area reduction of BRS-Bragança are found in the literature compared to defoliation provoked by pest insects, which cause significant losses in grain yields in Roraima. Thus, the present study aimed to verify the influence of levels of artificial defoliation at three phenological stages of cowpea plants BRS-Bragança cultivated in a greenhouse on production components.
MATERIAL AND METHODS
The experiment was carried out in the seed laboratory and greenhouse of the Brazilian Agricultural Research Corporation Seed Department (EMBRAPA) of the state of Roraima. It is localized in the municipality of Boa Vista, RR, and situated in the geographic coordinates 02º45’28” N and 60º43’54” W. According to the Köppen classification, the climate of the region is type Aw (humid tropical) with annual average temperature of 26.7 ºC and annual average rainfall of 1.750 mm (SMIDERLE; SOUZA, 2016).
In order to obtain plants at different phonological stages, the seeds of cowpea of cv. BRS Bragança were sown at three intervals of 15 days. Sowing was performed in plastic pots of 5.0 L containing a substrate composed of mixtures of soil and sand (v/v 2:1). Thinning was performed 10 days after sowing (DAS) and only one plant per pot was maintained. Irrigation of the plants was carried out daily by utilizing deionized water according to the necessity of the plant in each pot for 70 DAS.
The experiment was completely randomized and arranged in a factorial scheme with three phenological stages of cowpea plants, namely, i) stage with to two to three trefoils (TS), ii) flowering stage (FS), and iii) pod stage (PS). In addition, three levels of defoliation were carried out with 0; 33 and 67% of the removal of leaflets of the trefoil. Five replications were performed and each plot had one plant each. Defoliations of all levels were conducted with the aid of a pair of pruning scissors obeying the following standard: 0% = plant without defoliation (control); 33% = plant with removal of the central leaflet of each trefoil 67% = plant with removal of the side leaflets of each trefoil.
paper bags and taken to the laboratory for analysis. The number of pods produced per plant and nSP were obtained by counting. The number of seeds per plant was obtained by multiplying the previous variables. The mass of seeds per plant (g) was obtained by the mass of the seeds produced per plant. Yield estimate (ePROD, in kg ha-1)
was established by the mass per plant, while considering the population of 120.000 plants per hectare and mass of 1.000 seeds (m1000S, in g) obtained from 100 seed samples.
After hand threshing and seed count, one thousand seed mass (m1000S) was determined by separating four samples of 100 seeds from each treatment. Seed samples were maintained in an oven at 105oC for 24 h for moisture determination (BRASIL,
2009) and correction of the weights of the seeds to 13% (BRASIL, 2009).
For data analysis, the values of the variables surveyed were submitted to the Shapiro-Wilk normality test and Bartlett homogeneity test. Next, the values were submitted to the variance analysis (ANOVA) and comparison of means by the Tukey test (α ≤ 5%) utilizing the software SISVAR (FERREIRA, 2011).
RESULTS AND DISCUSSION
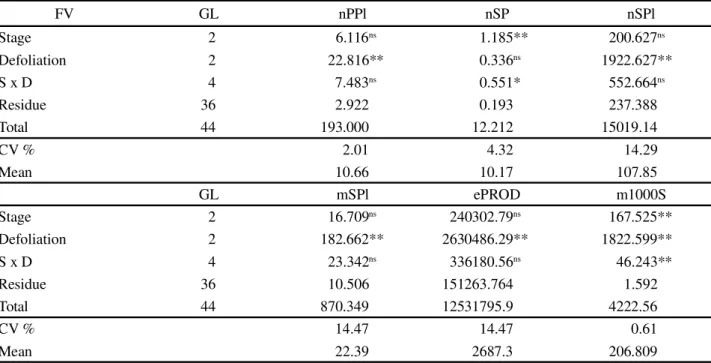
The mean squares and levels of significance by the F test are observed for the production characteristics evaluated (Table 1). In the data analysis, a significant difference (P≤0.05) was found for phenological TS, FS, PS, and defoliation levels (D1 = 0%, D2 = 33% and D3 = 67%). For the interaction phenological stage x defoliation, a significant difference for the nSP and m1000S was observed. Although the factor phonological stage was significant for the variables nSP and m1000S, the variables nPPl, nSPl, mSPl, m1000S, and ePROD presented significance in the defoliation factor (Table 1).
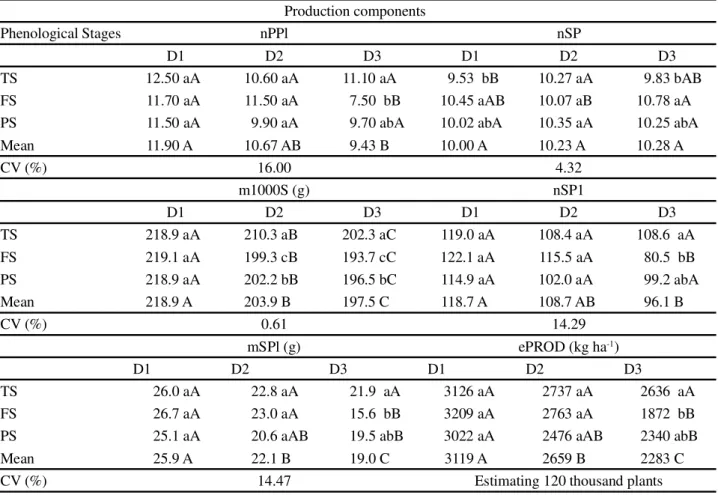
When different phenological stages (Table 2) were analyzed within the factors D1 and D2 (0 and 33% of defoliation) relative to the variable nPPl, there was no significant difference (P>0.05). However, plants that presented 67% of defoliation (D3) differed significantly (P≤0.05) by the Tukey test in the nPPl between the different phenological stages. Plants at the phenological FS presented lower nPPl, thus differing significantly from TS, although not differing from PS. The highest average values of nPPl were obtained at the TS and phenological PS (Table 1). This demonstrates that between the different
FV GL nPPl nSP nSPl
Stage 2 6.116ns 1.185** 200.627ns
Defoliation 2 22.816** 0.336ns 1922.627**
S x D 4 7.483ns 0.551* 552.664ns
Residue 36 2.922 0.193 237.388
Total 44 193.000 12.212 15019.14
CV % 2.01 4.32 14.29
Mean 10.66 10.17 107.85
GL mSPl ePROD m1000S
Stage 2 16.709ns 240302.79ns 167.525**
Defoliation 2 182.662** 2630486.29** 1822.599**
S x D 4 23.342ns 336180.56ns 46.243**
Residue 36 10.506 151263.764 1.592
Total 44 870.349 12531795.9 4222.56
CV % 14.47 14.47 0.61
Mean 22.39 2687.3 206.809
Table 1 - Summary of the variance analysis (Mean Squares and significance by the F test), coefficients of variation, and general means obtained for number of pods per plant (nPPl), number of seeds per pod (nSP), number of seeds per plant (nSPl), mass of seeds per plant (mSPl, g), yield estimate (ePROD, kg ha-1) and one thousand seed mass (m1000S, g), obtained in cowpea plants cv. BRS
Bragança at the phenological stages of 2 to 3 trefoils (TS), flowering (FS) and pod formation (PS), with defoliation of 0%, 33% and 67%, cultivated in a greenhouse
Production components
Phenological Stages nPPl nSP
D1 D2 D3 D1 D2 D3
TS 12.50 aA 10.60 aA 11.10 aA 9.53 bB 10.27 aA 9.83 bAB
FS 11.70 aA 11.50 aA 7.50 bB 10.45 aAB 10.07 aB 10.78 aA
PS 11.50 aA 9.90 aA 9.70 abA 10.02 abA 10.35 aA 10.25 abA
Mean 11.90 A 10.67 AB 9.43 B 10.00 A 10.23 A 10.28 A
CV (%) 16.00 4.32
m1000S (g) nSP1
D1 D2 D3 D1 D2 D3
TS 218.9 aA 210.3 aB 202.3 aC 119.0 aA 108.4 aA 108.6 aA
FS 219.1 aA 199.3 cB 193.7 cC 122.1 aA 115.5 aA 80.5 bB
PS 218.9 aA 202.2 bB 196.5 bC 114.9 aA 102.0 aA 99.2 abA
Mean 218.9 A 203.9 B 197.5 C 118.7 A 108.7 AB 96.1 B
CV (%) 0.61 14.29
mSPl (g) ePROD (kg ha-1)
D1 D2 D3 D1 D2 D3
TS 26.0 aA 22.8 aA 21.9 aA 3126 aA 2737 aA 2636 aA
FS 26.7 aA 23.0 aA 15.6 bB 3209 aA 2763 aA 1872 bB
PS 25.1 aA 20.6 aAB 19.5 abB 3022 aA 2476 aAB 2340 abB
Mean 25.9 A 22.1 B 19.0 C 3119 A 2659 B 2283 C
CV (%) 14.47 Estimating 120 thousand plants
phenological stages of the plant, FS was the most affected when the plant had 67% of its leaf area removed, which may have contributed to nPPl reduction.
These results corroborate studies conducted by Moura et al. (2014) with BR 17- Gurguéia genotype of
cowpea. The authors reported that during the vegetative phase for defoliation levels at 25, 50, and 75%, no differences were observed from the control in any of the production components evaluated.
Ezedinma (1973) suggests that a reduction in the number and area of leaves when accompanied by better distribution can make cowpeas more productive. Epstein and Bloom (2006) stated that plants accumulate biomass until the reproduction phase and from that phase on plant senescence with consequent gradual decrease of biomass is started. This would justify yield overcompensation when the loss of leaf area occurs at the vegetative phase.
Moura (1999), in a study carried out with the common bean (P. vulgaris), reported that the loss of leaf area affects the yield components. Additionally, nPPl is the most influenced, while the grain weight is the least affected. In the present study, these parameters were influenced by defoliations at 67% at the FS.
According to Bahry et al. (2013) and Fontoura,
Costa and Daros (2006), defoliation levels and the time of leaf removal influenced negatively the number of seeds and seeds per plant. Nevertheless, it is worth noting that this reduction occurred mainly at the FS submitted to 67% defoliation, corroborated by Mouraet al. (2014).
Quintela (2009) stated that there is no significant alteration to the number of pods, nSP, and 100-seed mass for removal of the leaf area at different levels in the main leaves of the common bean. This is in accordance only with the parameter nSP when compared with the current study. *P For each production component, means followed by the same lowercase letter in the column and uppercase in the row are not significantly different (P≤0.05) by the Tukey test
Table 2 -Average values of the number of pods per plant (nPPl), number of seeds per pod (nSP), one thousand seed mass (m1000S), number of seeds per plant (nSPl), mass of seeds per plant (mSPl), and yield estimate (ePROD, kg ha-1) obtained in
According to Schmildtet al. (2010), photosynthesis activity peaks in the flowering time due to the increase in the size of sinks at this time. Thus, a greater need of photosynthesis products for the plant to perform its function of producing and filling pods is required. With the defoliations that occurred in that phase, greater losses were observed in the pod number, since not enough photosynthesis occurred for the plant to perform this function. It is likely that this occurred in a similar way with the cultivar BRS Bragança due to the limitations in photoassimilate availability as a result of the decreases in the source/sink ratios.
When the phenological stages were analyzed within factors D1 and D3 in relation to the variable nSP, there was a significant difference (P>0.05) by the Tukey test between PS, FS, and TS. However, within factor D3, there was a significant difference in the nSP between the different phenological stages since plants at the TS presented lower nSP, differing significantly from the FS, but not differing from the PS. Plants at the FS, which did not differ from the PS (Table 2), presented the highest nSP. The removal of 67% of the leaflets reduced to m1000S regardless of the phenological stage of the plant, being that, the higher the defoliation, the lower the m1000S. Although plants at the FS presented higher nSP, the removal of 67% of the leaflets reduced the nPPl, which is likely due to the detriment of energy consumed in their vegetative recovery.
Mouraet al. (2014) obtained significant effect of the
defoliation time on the nPPl while working with artificial defoliation in cowpea plants at five levels at 25 and 40 days after planting. According to the study, defoliation of 100% at 25 DAS decreased the nPPl compared with the same defoliation level at 40 DAS.
Furthermore, Moura (1999) evaluated four levels of defoliation at four distinct time points in two bean cultivars and found that the nPPl decreased as the defoliation level increased. The greatest losses occurred in plants submitted to defoliations of 100%, and such losses reached 42.0 and 45.1% in the cultivars Rosinha and Carioca, respectively.
These results are similar to those obtained by Ezedinma (1973), who achieved similar yields in cowpea production with defoliations of up to 50% in the period that preceded flowering. Reductions in yield when defoliations were applied before grain maturation were also found in FS and PS. These findings corroborate with the study by Schmildtet al. (2010), who studied the yield of the bean Phaseolus relative to the defoliation levels, showing that
the yield decrease is higher at PS.
Other authors have concluded that there is not a more prejudicial stage, but rather a period that goes from flowering to grain filling (ZILIOet al., 2011). The results
obtained in this study show coherence and reliability and can be utilized as a basis in management programs of defoliating pests of that cultivar. In turn, there was no significant difference (P>0.05) by the Tukey test between the phenological stages when they were investigated within the D1 factor in relation to the variable m1000S. Nevertheless, while analyzing within the defoliation levels D2 and D3, a significant difference (P≤0.05) was observed in the variable m1000S between the different phenological stages. Thus, within the factors D2 and D3, the seeds concerning the plants at the TS were the ones that presented the highest m1000S, thus differing from the other phonological stages. The lowest m1000S was found in the seeds obtained in leafless plants at the FS, both at the D2 and D3, which differed significantly (P≤0.05) from both the PS and TS. In addition to the significant difference (P>0.05) at the m1000S of seeds coming from plants concerning the FS and TS, the removal of leaflets up to 67% was reduced significantly at m1000S regardless of the phonological stage of the plant, being that, the lower the m1000S, the higher the defoliation.
Moura et al. (2014) carried out a study on defoliation in cowpeas and concluded that there was a significant difference in the two factors evaluated for the 100-seed mass. At 25 DAS, plants with 25% presented heavier seeds and defoliations of 100% provided lighter seeds. When defoliations occurred at 40 DAS, plants with 25% of defoliation produced smaller seeds and defoliations of 75 and 100% produced seeds of smaller mass. Schmildtet al. (2010) evaluated the effect of four defoliation levels in five different time points in the common bean plant and found that there was a significant difference just for the level of defoliation. Additionally, the decrease in the 100 grain mass was more expressive in plants with 100% of defoliations.
According to studies with bean plants, the removal of leaves and the consequent reduction of the photosynthetically active area provokes reduction in the yield components due to the decrease in the amount of photoassimilates produced (GLIER et al., 2015;
PRATISSOLIet al., 2012; RIFFELet al., 2012).
In order to determine the percentage of loss, the value of the m1000S concerning treatment D1 (0% of defoliation) at the three phenological stages as 100% was considered. Thus, the loss (%) at the m1000S for TS was of 3.9 and 7.6% for the defoliation levels concerning D2 and D3, respectively.
respectively. This probably occurred because at PS the plant was already completely formed.
The number and mass of seeds per plant showed significant reduction when the plants were defoliated at FS by 67% (D3). No significant reduction of this parameter was found at D1 and D2 within the phenological stages of the plants, although lower mSPl was observed in the D2 average. These two parameters, along with m1000S, influenced seed yield estimative. In this estimate (ePROD), defoliations D2 and D3 reduced regardless of the phenological stages at 14.7 and 26.8%, respectively.
Mouraet al. (2014) found a significant difference
in relation to the levels of defoliations applied in cowpeas. At 25 DAS, there was only a decrease of yield with the application of 100% of defoliation. However, at 40 DAS, plants that had undergone defoliations of 25% presented higher yields, and plants with 100% of loss of leaf area presented lower yields per plant.
Schmildtet al. (2010) evaluated the effect of four levels of defoliations in five different seasons in common bean plants and found that yield was influenced by the defoliation levels at the development stages, with the exception of R9 (dry pods). Additionally, the defoliations were more harmful at the R7 stage (pod formation) with a yield reduction of about 80%.
Souzaet al. (2014) evaluated the effect of artificial defoliation in the vegetative stages on the number of reproductive structures in soybean and grain yield and observed that defoliations from 0 to 66.7% did not promote a significant difference in yield. Moura et al. (2014) evaluated the interference of defoliation levels from 0 to 100% in the vegetative and reproductive phases in cowpea yields and concluded that there was a decrease in yield in the vegetative state only with 100% of defoliation, and greater losses in yield occurred when defoliation was in the vegetative phase. In this manner, different responses occur depending on the species used.
Moura et al. (2014) evaluated the interference of defoliation levels of 0 to 100% in the vegetative and reproductive phases in the cowpea yields and concluded that in the vegetative and reproductive phases, there was a decrease in yield only with 100% of defoliation, and greater damage in yields occurred when there was defoliation in the vegetative phase. This demonstrates that different responses occur depending on the species utilized.
Moura (1999) assessed the effect of four levels of defoliation in the common bean plant (0, 33, 67, and 100%) at four different time points (V3, V4, R6, R7, and R8). The author observed that losses increased due to rising defoliation levels, reaching average losses of 58.5 and 59.4% in the cultivars Rosinha and Carioca, respectively,
when submitted to 100% of defoliation. The author also found that there was a difference between the cultivars depending on the time in which they were submitted to defoliation. The cultivar Rosinha was the most affected with defoliations in the R8 phase (pod formation). On the other hand, the cultivar Carioca was the most affected with defoliations in the vegetative phase V4 (third trifoliate leaf).
According to some authors, defoliation in the vegetative phase does not cause much damage to legume yield, but rather it occurs in the reproductive phase of the crop, especially in the formation of legumes and during grain filling (ANDRADE et al., 2010; FONTOURA;
COSTA; DAROS, 2006). In addition, while working with levels of defoliation at different vegetative stages, Bahry et al. (2013) found that defoliation above 66.7% significantly reduced yield ofGlycine max.
Nevertheless, regarding the effect in different stages of plant development, while aiming to verify the effect of artificial defoliation of the bean plant cultivar Xamego, Schmildtet al. (2010) observed that defoliations
were more damaging at the R7 stage (pod formation) with approximately 80% of reduction in yield. According to Zilioet al. (2011), the reduction in production and yield
per plant is due to the decrease in the nPPl and even the average weight of the grains.
In turn, regarding the effect in different stages of plant development, while aiming to verify the effect of artificial defoliations of the bean plant cultivar Xamego, Schmildtet al. (2010) observed that the defoliations were
more damaging at the R7 stage (pod formation) with about 80% reduction in yield. According to Zilio et al. (2011),
the reduction in production per plant and yield is due to the decrease in the nPPl and the average weight of the grains.
Halfeld-Vieira, Nechet and Souza (2011) reported that the cultivar BRS Bragança used in the present study was characterized as susceptible to bacterial blight. Thus, the results herein may give epidemiological support to future studies as well as the selection of promising material for cowpea breeding programs.
CONCLUSIONS
1. The yield components of BRS Bragança ranged according to the phenological stages of plant and defoliation levels;
3. Defoliations above 33% at the FS determine reduction in nSPl, nPPl, mSPl, and yield estimate. Defoliations of 67% at the FS can reduce nPPl, and at the PS it can reduce nSP.
REFERENCES
ANDRADE, F. N.et al. Estimativa de parâmetros genéticos em genótipos de feijão-caupi avaliados para feijão fresco.Revista Ciência Agronômica, v. 41, n. 2, p. 253-258, 2010.
ASFAW, A.; BLAIR, M. W. Quantitative trait loci for rooting pattern traits of common beans grown under drought stress versus non-stress conditions.Mol Breed, v. 30, n. 5, p. 681-695, 2012.
BAHRY, C. A.et al. Desempenho agronômico da soja em função da desfolha em diferentes estádios vegetativos.Tecnologia & Ciência Agropecuária, v. 7, n. 4, p. 19-24, 2013.
BRASIL. Ministério da Agricultura, Pecuária e Abastecimento. Secretaria Nacional de Defesa Agropecuária. Regras para análise de sementes. Brasília, DF, 2009. 399 p.
EMBRAPA ARROZ E FEIJÃO. Home Page. 2016. Disponível em: <http://www.cnpaf.embrapa.br/socioeconomia/index. htm>. Acesso em: 27 jul. 2016.
EPSTEIN, E.; BLOOM, A. J. Nutrição e crescimento. In:
EPSTEIN, E.; BLOOM, A. J. (Ed). Nutrição mineral de plantas: princípios e perspectivas. Tradução de Maria Edna Tenório Nunes. Londrina: Planta, 2006. p. 251-286.
EZEDINMA, F. O. C. Effects of defoliation and topping on semi-upright cowpeas Vigna unguiculata(L) Walp. in a
humid tropical environment.Experimental Agriculture, v. 9, n. 3, p. 203-207, 1973.
FERREIRA, D. F. Sisvar: a computer statistical analysis system.Ciência e Agrotecnologia, v. 6, n. 35, p. 1039-1042, 2011.
FONTOURA, T. B.; COSTA, J. A.; DAROS, E. Efeitos de níveis e épocas de desfolhamento sobre o rendimento e os componentes do rendimento de grãos da soja. Scientia Agraria, v. 7, n. 1/2, p. 49-54, 2006.
FOOD AND AGRICULTURE ORGANIZATION. 2013. Disponível em: <http://faostat3.fao.org/faostat-gateway/go/to/ download/Q/QC/E>. Acesso em: 04 ago. 2016.
FREIRE FILHO, F. R.et al. Melhoramento genético.In: FREIRE FILHO, F. R.; LIMA, J. A. de A.; RIBEIRO, V. Q. (Ed.). Feijão-caupi: avanços tecnológicos. Brasília, DF: Embrapa Informação Tecnológica; Teresina: Embrapa Meio-Norte, 2005. p. 29-92. GLIER, C. A. S. et al. Defoliation percentage in two soybean cultivars at different growth stages. Revista Brasileira de Engenharia Agrícola Ambiental, v. 19, n. 6, p. 567–573, 2015.
GUILHEN, J. H. S.et al. Physiological characteristics in seeds of the common bean under multicollinearity and conditions of
salinity.Revista Ciência Agronômica, v. 47, n. 1, p. 127-134, 2016.
HALFELD-VIEIRA, B. A.; NECHET, K. L.; SOUZA, G. R. Ocorrência da mancha-bacteriana do feijão-caupi em Roraima e reação de cultivares.Summa Phytopathologica, v. 37, n. 3, p. 127-130, 2011.
LIMA, J. R. S.et al. Balanço de energia e evapotranspiração de feijão caupi sob condições de sequeiro. Revista Ciência Agronômica, v. 42, n. 1, p. 65-74, 2011.
LIMA-PRIMO, H. E. et al. Epidemiological aspects of cowpea bacterial blight.Tropical Plant Pathology, v. 40, n. 1, p. 46-55, 2015.
MATOS FILHO, C. H. A. et al. Potencial produtivo de progênies de feijão-caupi com arquitetura ereta de planta.
Ciência Rural, v. 39, n. 2, p. 348-354, 2009.
MELVILLE, C. C. M. et al. Preferência do pulgão-preto,
Aphis craccivora Koch (Hemiptera: Aphididae), a genótipos
de feijão-caupi.Revista Agro@mbiente On-line, v. 10, n. 2, p. 153-160, 2016.
MORETTI, C.et al. Occurrence of leaf spot on cowpea (Vigna unguiculata) caused byXanthomonas axonopodispv.vignicola
in Mozambique.Plant Pathology, v. 56, n. 2, p. 347, 2007. MOURA, G. de M. Efeito do desfolhamento no rendimento do feijoeiro.Pesquisa Agropecuária Brasileira, v. 34, n. 1, p. 57-62, 1999.
MOURA, J. Z. et al. Nível de dano econômico para insetos desfolhadores em feijão-caupi. Revista Caatinga, v. 27, n. 3, p. 239-246, 2014.
NAKANO, O. Entomologia econômica. 2. ed. Piracicaba: ESALQ: USP, 2011. 464 p.
NECHET, K. L; HALFELD-VIEIRA, B. A. Caracterização de isolados deRhizoctonia spp., associados à mela do feijão-caupi (Vigna unguiculata), coletados em Roraima. Fitopatologia Brasileira, v. 3, n. 31, p. 505-508, 2006.
PRATISSOLI, D.et al. Níveis de desfolha artificial para similar
perdas na produtividade do feijoeiro comum.Scientia Agraria Paranensis, v. 11, n. 7, p. 68 76, 2012.
QUINTELA, E. D. (Ed).Fundamentos para uma agricultura sustentável, com ênfase na cultura do feijoeiro. Santo Antônio de Goiás: Embrapa Arroz e Feijão, 2009. p. 289-308.
RIFFEL, C. T. et al. Densidade amostral aplicada ao
monitoramento georreferenciado de lagartas desfolhadoras na cultura da soja.Ciência Rural, v. 42, p. 2112-2119, 2012. SCHMILDT, E. R. et al. Influência de desfolhas artificiais para simular perdas na produção do feijoeiro (Phaseolus vulgaris L. cv. Xamego).Arquivos do Instituto Biológico, v. 77, n. 3, p. 457-463, 2010.
SMIDERLE, O. J; SOUZA A. G. Production and quality of
SMIDERLE, O. J. et al. Qualidade fisiológica de sementes de feijão-caupi obtidas em residual alternativo de adubações.
Revista Congrega, v. 1, n. 1, p. 1-9, 2016.
SILVA, A. J. daet al. Resposta do feijão-caupi à doses e formas de aplicação de fósforo em Latossolo Amarelo do Estado de Roraima.Acta Amazônica, v. 40. n. 1, p. 31-36, 2010.
SOUZA, V. Q de et al. Caracteres morfofisiológicos e produtividade da soja em razão da desfolha no estádio vegetativo.
Científica, v. 42, n. 3, p. 216-223, 2014.
ZILIO, M.et al. Contribuição dos componentes de rendimento na produtividade de genótipos crioulos de feijão (Phaseolus vulgaris
![COMPETITIVITY OF THE COMMON-BEAN PLANT RELATIVE TO THE WEED ALEXANDERGRASS [Brachiaria plantaginea (Link) Hitch.]](data:image/gif;base64,R0lGODlhAQABAIAAAP///wAAACH5BAEAAAAALAAAAAABAAEAAAICRAEAOw==)