EXHIBIT DEVELOPMENT IN A SCIENCE CENTRE:
Internship at Glasgow Science Centre
Ana Isabel Fernandes Sousa
Internship Report
MSc in Science Communication
(Relatório de Estágio | Mestrado de Comunicação de Ciência
)
Acknowledgments
I want to thank my mother because without her support I would never be able to complete my studies, my internship and this report.
I also thank my closest family for all the love and support.
I would like to thank the Glasgow Science Centre for giving me the amazing opportunity to be an intern, allowing me to learn so much about the world of interactive exhibits, prototyping and evaluation in science centres.
I want to thank my main supervisor, Dr Robin Hoyle, for receiving me in his team and following my work plan at the office, despite his busy schedule. I also want to thank my Portuguese supervisor, Professor Joana Lobo Antunes for her interest in my internship and her analysis of my report.
To Jennifer Casebow, the amazing colleague that turn out to be almost a third supervisor, I thank for all the patience and precious guidance daily in the office and her advice for my report.
To Florence Edmond, the Evaluation Coordinator of the team, who help me understanding and getting comfortable with the Observations and Interviews, when I had no experience in such field.
I thank all the Projects Team, for receiving me in such a lovely and nice environment. Despite being a foreigner adapting to a new situation, I felt completely relaxed in the office and I loved the tea/coffee moments.
EXHIBIT DEVELOPMENT IN A SCIENCE CENTRE:
Internship at the Glasgow Science Centre
Ana Isabel Fernandes Sousa
Abstract
This report describes an internship at Glasgow Science Centre, in the city of Glasgow, Scotland. The internship was integrated into the Floor 1 Refresh Project and in the field of exhibit analysis and improvement. In this work, we consider that exhibits are the interactive objects that explain a certain scientific phenomenon through their use, in science centres and museums.
exhibits during this short prototyping process. The interviews help to understand improvements to make in these exhibits for the future.
Table of Contents
General Introduction ... 1
1. Theoretical contextualization - science centres and the development of exhibits ... 1
1.1. Science centres ... 1
1.2. Design of exhibitions – conceptualization ... 3
1.3. Interpretation ... 6
1.4. The visitors ... 8
1.5. Evaluation ... 9
1.6. Accessing engagement to identify learning ... 10
2. Practical contextualization - The Glasgow Science Centre and the internship ... 12
2.1. Glasgow Science Centre ... 12
2.2. Excitement Gallery Design – Refresh of Floor 1 ... 15
2.3. Internship relevance... 17
3. Methods ... 18
3.1. Analysis and Creative Process ... 18
3.1.1. General Ideas over the Floor 1 ... 18
3.1.2. Interpretation analysis ... 21
3.1.3. Idealisation of Clusters ... 22
3.2. The Exhibits ... 23
3.2.1. Sound Cluster Prototype ... 23
3.2.2. The information on the labels presented initially ... 26
3.3. Evaluation during the process ... 36
3.3.1. Observations ... 36
3.3.2. Board of information and feedback ... 39
3.4. Testing with the prototype labels ... 48
3.5. Interviews ... 50
4. Results and Discussion ... 51
4.1. Sticky Notes Feedback ... 51
4.2. Front-End evaluation results ... 52
4.2.1. 1st Observation ... 52
4.3. Formative evaluation ... 55
4.3.1. 2nd observation ... 55
4.3.3. 3rd observation ... 58
4.4. VEP graphics and comparisons for each exhibit ... 60
4.5. Comparison of the mean times measures ... 64
4.6. Interview results ... 65
5. Conclusions ... 69
5.1. Future outcomes and suggestions ... 70
6. References ... 74
Appendix A –List of the Projects Team’s ideas for F1 Refresh Project ... 78
Appendix B – Hand sketch brainstorming of ways to relate science fields for F1 ... 79
Appendix C – Conception of F1 organization: Hand sketch brainstorming of ways to relate science fields for F1 ... 80
Appendix D – Concept outline – hand sketched brainstorming about ideas inspired in the ideas of the Appendix A ... 81
Appendix E – Concept outline – hand sketched brainstorming to choose a sub-theme for the Prototype Cluster ... 82
Appendix F – Hand sketched floor 1 plans – ideas about moving exhibits ... 83
Acronyms and abbreviations
APE – Active Prolonged Engagement
CERN - European Organization for Nuclear Research
EDGE –Exhibit Design for Girl’s Engagement
F1 – Floor 1
GSC – Glasgow Science Centre
SMSTCs - Science Museums and Science and Technology Centres
STEM - Science, Technology, Engineering and Mathematics
VEEAM – Visitor Engagement And Exhibit Assessment Model
VEF - Visitor Engagement Framework
1
General Introduction
As a student in the MSc Science Communication (Mestrado de Comunicação de Ciência) in the University New of Lisbon (NOVA), I had the opportunity to do an internship as part of my Master’s degree. The internship was held at GSC (Glasgow Science Centre) integrated into the Projects Team under the supervision of Dr Robin Hoyle, tutor in the internship institution and Dr Joana Lobo Antunes, tutor from University New of Lisbon.
To do an internship was a good challenge and gave me some of practical experience. Knowing that the UK is widely recognised as developed in Science Communication, and being able to speak the language, I decided to go to Scotland and do the internship on abroad. The internship lasts two and a half months from 19th September and extending
to 2nd December. This period in GSC not only provided lots of lessons about exhibit
analysis and improvement but also gave me some insight about the Scottish work in science centres.
1.
Theoretical contextualization - science centres and the
development of exhibits
1.1.
Science centres
“Learning outside of formal institutions is certain to be of growing importance in relation to the formal school curriculum”(Wellington, 1990)
2 strand presents thematic exhibits portraying the big concepts of science like evolution and energy for example. The second strand presents a collection of interactive exhibits, where each exhibit represents a specific idea or concept. We can extend the term science centre to different types of museums and spaces that promote science in different ways, but this report is focused on the interactive hands-on exhibits type of centre which is close to the second strand. Nevertheless, it’s important to take note that the terms “interactive” and “hands-on” are different. Rennie & McClafferty (1996) explain that hands-on exhibits require a physical move from the visitor, like pushing a button or touching an object, which doesn’t mean that the exhibit will be responsive. Interactive exhibits respond to the action of the visitor and invite an additional response. The difference is that interactive exhibits offer feedback and invite a further interaction.
Though the major emerge of science centres started around 40 years ago (Danilov, 1982), the science centre movement began with the grand museums of science and industry in the begging of the XX century, with examples such as the London Science Museum (opened to public in 1928), the Deutsches Museum, Munich (1925) and the Museum of Science and Industry, Chicago (1933). Nevertheless, the “hands-on” philosophy in North America was also very important for the science-education reform (Beetlestone, Johnson, Quin, & White, 1998). It was with the opening of the Exploratorium, in San Francisco, USA, in 1969, with a “library of experiments” that the science museum traditional mould broke. As stated by the Exploratorium (2017), this science centre started the idea of allowing visitors to learn and explore by themselves. The founder, Frank Oppenheimer, among people in other institutions, suggested that designing interactive displays could captivate non-scientific people (Grinell, 1992).
3 (2010, p.13) described the importance of recognising, supporting and expanding new educative places and exploring different ways of relating to knowledge, to deal with different people.
1.2.
Design of exhibitions
–
conceptualization
Several studies have been made about the design of exhibitions for science centres. Part of the process of designing a science exhibition is like the art and history museums exhibitions. Science centres have people that act like curators and they start the creative process through investigation of a certain theme. Steps include reading books and catalogues of exhibits, conducting internet research, travelling to see relevant exhibitions and/or collections and writing down thoughts to clarify the idea of the project. Science Education Officers ask themselves other questions such as:
“What are the gallery’s priorities in terms of exhibitions? What is the institutional context? How is the location of the space for exhibits? How is the configuration and size? Which staffing and equipment resources are needed?” (Love, 2010).
4 design process must be supported by a strong program of research and evaluation and it’s crucial to study the layout and orientation of the surrounding environment of the exhibit. There are still many questions to be answered regarding the aspects of learning such as:
“Should we make explanations of scientific phenomena easy to locate and understand, or do we want visitors to rise to the challenge of investigating phenomena intheir own terms? Should we create more sequenced exhibits and linear paths to reducethe effort of navigation and connection-making among exhibits, or should we keep thefloor-plan open because connection-making is exactly where we believe visitors should bespending their effort?”.
The same author says that when designing exhibits to extend engagement and self-direct inquiry by visitors and avoiding the “one-line” explanation of a phenomenon there is the risk of misunderstanding the scientific message.
Another approach in creating exhibits is idealising them to have “attraction power”, “holder power” (Boisvert & Slez, 1994; Sandifer, 2003) and “engagement power”. Attraction power happens when the visitor starts to interact with the exhibit. Holder Power happens when the visitor stays a certain time interacting. Engagement power is the feature of exhibits that can hold the attention of the visitor for some minutes and the subject shows clear signs of engagement. Exhibits can have attraction power, because of their shape or size, and not necessarily have holder power, as they don’t stimulate the visitor for the interaction.
5 Anderson and Lucas (1997) also studied how to design an effective exhibit and identified some design properties that influence the potential of the exhibit as educational material. On their study, the size of the exhibit, for example, draw the attention of 13-14-year-old students. Other particularity enhanced and very well studied, is that exhibits are effective if they have some sort of link to the everyday life. Moreover, Gilbert and Priest (1997), found that 8-9-year-old students recognising the familiar object in the exhibit was critical.
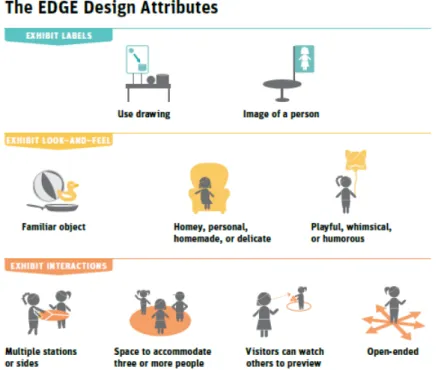
Aiming to reach the engagement of a specific public another project that studies the design of exhibits is the Exhibit Design for Girl’s Engagement (EDGE) by Exploratorium (Dancstep & Sindorf, 2016). This is focused on identifying the most important design attributes for engaging girls at STEM (stands for science, technology, engineering and mathematics) exhibits. By creating a list of potential girl-engaging attributes, and testing around 300 exhibits, researchers select the most significant design features for scientific exhibits (fig. 1).
6 Gammon and April (2008) present a paper with some practical steps on how to make interactive exhibits. This is a list of characteristics to select the best interactive exhibits according to the authors:
“• Provides the visitor with choice and control over the experience;
• Provides a challenge, with clear goals and immediate feedback on
performance, that is (just) within the capability of the visitor;
• Inspires playfulness among visitors;
• Provides an experience that can be shared with other people;
• Provides a reward that is beautiful, delightful, wonderful, unique, intrigue – i.e. is not just a lot of text;
• Provides an opportunity to make something or achieve something visitors
feel is worthwhile;
• Are focused on a particular theme, message or experience. Try and avoid
the temptation to shoehorn several ideas into one exhibit – this usually creates a confusing mess”
Studies have shown the importance of children’s free playful exploration, and the link to scientific work. DeWitt and Osborne (2010) had shown that importance, revealing exhibit design factors for engaging 9-11-year-old students such as hands-on interaction, multiple opportunities for exploration, phenomena contrasted with previous experiences or that was perceived as cognitively challenging.
1.3.
Interpretation
7 In this report, “interpretative label” is considered to be all the titles, orientation/introductory labels, section or group labels (Serrel, 1996) accompanying the exhibits. The most part of the study during the internship focused on understanding ways to improve the delivering of the interpretative message in certain exhibits, whether through changes in the labels or in the exhibits themselves.
An “interpretative” exhibit holds information that visitors can comprehend, learn and relate to. Lots of exhibits are wrongly “called” interpretative, as mostly just present information. Veverka explains that in the exhibit development several details count to make the most interpretative exhibit.
In the same guide, Veverka warns that an exhibit, even if it’s very hands-on, it is limited if it’s not also “minds-on”. He gives the example of exposing objects to be held without stimulating further questions:
“So a person picks up and looks at a deer antler – then what? They put it
down and pick up a turtle shell – then what? What is the point in the hands-on activity? To have these exhibit really work you need to have some “minds
on” planning or outcomes for the exhibit activity. This exhibit could be enhanced by asking “Pick up the deer antler and see how many different
tools you think you could make from it –what would those tools be?”. Now
the mind has a focus or objective that goes with the activity.”
8
1.4.
The visitors
Science centres are public spaces where science is communicated and explored. Like museums, zoos, aquaria and botanical gardens, science centres are often mentioned as “informal learning settings” where “free-choice learning occurs” (Falk, 2001). However, it’s not that simple to grab the attention of the visitor and allow them to engage effectively with the exhibit. The science centres are full of interactive exhibits, so usually visitors only interact with each exhibit for a few seconds. Allen (2004) argue that the experience (every intermediate step with it) must be sufficiently motivating for the visitor to engage in a successful way.
Yet, it is very difficult to “control” the steps that the visitors make. Even if the exhibits are designed and organised in a sequence, doesn’t mean the visitor will interact in the intended “proper” order. Science centres did studies about possible changes, including the well-known Exploratorium, in San Francisco. Allen (2004) also found out that changes in the public space including more lighting, seating, acoustic baffling to reduce ambient noise and orientationally devices make a difference.
Nonetheless, the public can be very different: different ages, gender, interests etc. How diverse can be the public and how that can affect the way they perceive the exhibits? The clear majority of the public in GSC are children from school visits, but sometimes families also visit and occasionally some couples or groups of friends. In the same group, for example, a family, it can happen that different members want to explore the exhibits differently. The adults may want to explore deeply the scientific phenomena but they are conditioned by their children who are distracted more easily (Hsi, 2004).
9 A study by Falk & Storksdieck (2005) demonstrated that visitor learning can be affected by variables like prior knowledge, interest, motivation, choice and control, the different organisation and interaction within a social group, as well as the orientation, architecture and exhibition design. Which means that when studying a certain subject interacting with exhibits, lots of uncontrolled variables may take place.
1.5.
Evaluation
A big part of the exhibit development work is based on studies of evaluation. The Exploratorium does evaluation quite often, one of the methods being the observation and analysis of the audience. As they are one of the most successful science centres in the world, GSC is very inspired by their studies and good practices. Barriault and Pearson (2010) emphasise a lot the conductive evaluation, not only at the end of the development of the exhibits but also the front-end evaluation, at the beginning of the prototyping.
It is also possible to find ways to know what needs improvement in a more direct way, by doing interviews with the visitors. Different kinds of questions are possible and in different ways. It has been noted (Brace, 2004) that an open question is made to get the own words from the visitors which can be followed by a short or long answer. The purpose is to seek for spontaneous responses. Closed questions have more predictable answers like the common “yes” or “no”. Though it’s easy to organise these answers it’s not likely to extract as much insight as in the open questions, but both approaches can be effective.
10 make “driving questions” when approaching the exhibit. The traditional exhibits had more similar and fewer questions, like “what’s going on here”. Additionally, visitors physically interact in a more diverse manner in terms of pattern and sequence on APE exhibits (Allen, 2004).
The analyses of the studies from Exploratorium gave insight about characteristics in the exhibits in terms of interactivity:
(1) multiple options with equal salience can overwhelm visitors;
(2) interactivity by multiple simultaneous users can lead to disruption;
(3) interactivity, even by a single visitor, can disrupt the phenomenon being displayed;
(4) interactive features can make a critical phenomenon difficult to find, and
(5) secondary features can displace visitors’ attention from the primary one
(Allen & Gutwill, 2004).
1.6.
Accessing engagement to identify learning
Barriault and Pearson (2010) methods were particularly interesting to use in this internship. Those methods of evaluation are based on learning theories and attempt to understand how to improve exhibits based on the visitor signs of engagement.
11 model that can generate real insights into the impact of exhibits on the visitor learning experience.
“The visitor engagement and exhibit assessment model consists of 1. a visitor engagement framework (VEF) of observable behaviours; 2. the arrangement of those behaviours into learning related categories; 3. a visual representation of the level of engagement elicited by an exhibit; and
4. a model that indicates where intervention might increase visitor engagement with an exhibit.”
(5) secondary features can displace visitors’ attention from the primary one
(Allen and Gutwill, 2004).
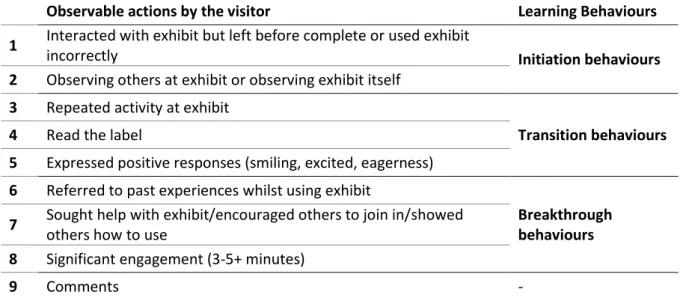
The Table 1 is often used in the studies of Evaluation at GSC. Times spent at the exhibits and observable actions are tracked while watching the visitor’s interaction with the exhibits. The learning behaviours are grouped in three categories, inspired in Barriault and Pearson paper (2010) (initiation behaviours, transition behaviours and breakthrough behaviours).
Table 1 - Table used in the observations of the visitors with the actions grouped in three categories of Learning Behaviours;
Observable actions by the visitor Learning Behaviours 1 Interacted with exhibit but left before complete or used exhibit
incorrectly Initiation behaviours
2 Observing others at exhibit or observing exhibit itself
3 Repeated activity at exhibit
Transition behaviours 4 Read the label
5 Expressed positive responses (smiling, excited, eagerness)
6 Referred to past experiences whilst using exhibit
Breakthrough behaviours 7 Sought help with exhibit/encouraged others to join in/showed
others how to use
8 Significant engagement (3-5+ minutes)
12
2.
Practical contextualization - The Glasgow Science Centre and
the internship
2.1. Glasgow Science Centre
The Glasgow Science Centre is an independent Scottish Charity and works as a public space on the south bank of River Clyde in the city of Glasgow, Scotland. Highlighted as one of Britain’s must-see visitor attractions, the centre aims to be a place where people can learn science while having fun exploring interactive exhibits to feel like scientists for a day. The centre was opened in June 2001 by Queen Elizabeth II.
The design and construction of Glasgow Science Centre resulted from a victory of the National Competition – the largest Millennium Commission-funded project in Scotland as reported by the winners, BDP, a major international practice of architects, designers, engineers and urbanists. The Centre is composed of three main buildings: The Science Mall, The Glasgow Tower and the IMAX cinema (see fig. 2).
Figure 2- A photograph of the Glasgow Science Centre. Building on the left: Imax Cinema. Building in the middle: Science Hall. Tower on the right: Glasgow Tower. Source:
13 The Science Mall has 3 floors of interactive exhibits, a planetarium, two theatres, a lab, a café, a shop and spaces to do workshops and science shows. The current exhibitions are “Bodyworks” on the Floor 3, “Powering the Future” on the Floor 2 and “Explore and Discover” on the Floor 1.
GSC mission is more than providing a fun experience to the visitors. Having this in consideration, when working in prototype exhibits it is necessary to balance the number of science facts while making sure the experience is fun for the visitor. It’s good that visitors learn something new, but at the same time, the exhibits cannot be too “boring” nor too “intellectual”.
On the other hand, having fun with science is as important as learning facts because it makes people trust in science, building a good science image in a long term.
Glasgow Science Centre tries to follow precisely that, the notion that science is much more than already known ideas.
Danilov made a description (1982) about science centres, that the GSC uses as motivation source.
“There is nothing as effective as a contemporary science centre in stimulating interest, communicating information, and entertaining the public in the fields of science, technology, industry and health.
They have achieved this position by focusing on the present and future rather than the past; by emphasising enjoyable participatory techniques; and by being imaginative, flexible, and persistent in the furtherance of public science education.
They will continue to evolve, improve, and develop new approaches as they respond to society’s changing needs.”
Inthe creation and design of hands-on, interactive experiences, GSC seeks
14 GSC philosophy in terms of designing exhibits goes along the APE project, to encourage visitors to bring more of themselves – their fascinations, desires, questions, goals and expectations – to the exhibit experience.
• Activevisitors are in the driver’s seat, deciding for themselves what to try next
rather than following a set of instructions.
• Prolonged means that visitors spend more time with the exhibits, getting more involved with the phenomena than they might at other exhibits.
• Engaged visitors try a variety of things at the exhibit, with each action they take somehow building on their previous actions.
A place to learn
A place to have fun
A place to do science
A visitor attraction
A place to celebrate human endeavour
A place of curiosity and wonder
15
2.2.
Excitement Gallery Design
–
Refresh of Floor 1
The Floor 1 (F1) Refresh Project of the Science Hall is about creating an exciting introduction to the wonders of science and the science centre. The philosophy is to inspire visitors in becoming scientists, focusing on hand-picked amazing scientific phenomena and opportunities to Explore & Discover. The Project covers the increase in the number of interactive, functioning phenomena based exhibits, the re-interpretation to increase connection for visitors to the interactive exhibits and the refreshing of the look & feel of the gallery.
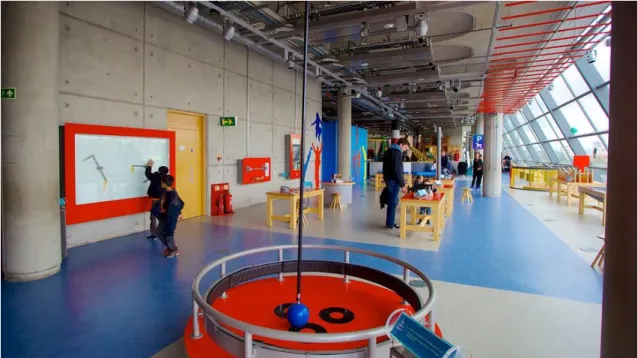
F1 (fig. 3) intended to serve as an introduction to the “wonders of science”. The exhibits
F1 is about the fundamentals of science: magnetism, electricity, physics, maths, forces etc. At the moment, the exhibits of the floor present labels usually in two formats, either is a printed panel or a prism. Each label has a title, instructions and an explanation of the idea presented by the exhibit. The walls of the floor are free from interpretation and very empty except for a quote on the value of play “We don’t stop playing because we grow old; we grow old because we stop playing.” – George Bernard Shaw
16 The space has some organisation in terms of exhibits being related with science branches, but there is still some mixing and little sense of that context for the different zones (fig.4). There isn’t a chronological organisation in the floor, all the exhibits are displayed without a beginning or an end. The visitors do not take a linear journey when exploring the floor. Each exhibit seems to be isolated, not contributing to a broader narrative or a sequence.
The F1 Refresh Project is necessary to find a better explanation for the visitor of what space “explore and discover” is about.
Some ideas the team intends to cover within this gallery are:
To be a space where visitors explore and discover the foundations of science;
As it’s the first floor, it is the initial experience in the centre. This should be a
'high energy' floor that encourages visitors to engage in an open exploration of the free-standing interactive exhibits.
The hands-on exhibits will be in loose clusters that illustrate the principle
phenomena and experiments associated with the broad subject areas. They will be designed to promote and facilitate exploration and self-discovery.
Visitors will learn that exploration and discovery are the driving forces behind
scientific research;
17
2.3. Internship relevance
By integrating the internship in this project, it was created a specific plan that involved experimenting new ways of interpretative content and trying to understand generally how to improve what was already in the exhibition of the F1. Starting by looking in the F1, it was considerate to create more organisation between the exhibits (for example chronologically) to consolidate better the knowledge.
Some of the exhibits in the F1 were there since the opening of the centre. The field of sound was later chosen to be tested on the Floor 2. It couldn’t be tested in the Floor 1 because of an unforeseen event explained further in the Methods section of this report.
The personal goals in terms of knowledge, skills and competencies to be acquired by the end of the internship (Expected Learning Outcomes) were:
To build knowledge of exhibition design processes
To develop skills in research and interpretive writing
To develop project management skills
I do feel that I got all those goals achieved.
Speaking of a wide range of impacts, this internship report used interesting methods that other science centres may want to reproduce. It’s interesting particularly to me, coming from a Portuguese background, working in a Scottish science centre and following several guidelines from the USA science centres. Some of the evaluation tests done, such as the observation of single exhibits each time and tracing the data in terms of the engagement of the visitors, are not usual in Portugal, although being common in the USA and the UK science centres. It would be exciting if this work could inspire Portuguese science centres to test similar methods of evaluation.
18 Finally, the more specific “results” of the Sound Cluster Prototyping can assist the GSC Projects Team, by suggesting new types of labels and interpretation and small details to be improved in the four exhibits tested.
3.
Methods
3.1. Analysis and Creative Process
The process of building new parts of an exhibition takes a lot of time (months, even years) and requires a multifaceted team. The Projects Team is composed of graphic designers, exhibition designers, IT specialists, science education officers, project managers and exhibition developers.
The first days of the internship were about getting familiar with what GSC do, how they do it and understanding what they were trying to achieve with Floor 1. As I arrived at the GSC, I was instructed to start visiting all the floors, attend some science shows, go to the planetarium and visit the Glasgow tower.
3.1.1. General Ideas over the Floor 1
The interactive exhibits were explored, to get close to the experience of the visitor and general notes about the F1 were taken. I had meetings with different members of the staff and read over existing materials about the overall thoughts and plans of refreshing in floor 1. Part of this familiarisation with the centre was the task of collecting thoughts on the exhibits of F1, thus a list of the existent exhibits was made and catalogued in terms of science phenomena and science branches.
19 have an impact (Pickton & Wright, 1998), commonly used in different companies and organisations to get a critical review of current situations. Literature shows some cases of success, such as the SWOT analysis of Dell Computer Corporation to implement mass customization, just-in-time manufacturing and direct interest sales (Collett, 1999).
Table 2- SWOT analysis of the Floor 1
STRENGTHS
The view from the windows in the F1 is very nice
The floor is very spacious Lots of exhibits to explore
Exhibits cover several fields (lots of possibilities)
Easy to relate to them and put in “groups”
There are some interpretation that fit well the exhibits (illustrations are very helpful)
Very cool and fun exhibits (e.g. points of view; rolling uphill; Bernoulli blower)
Simple information in the interpretation
WEAKNESS
General organisation and decoration of the floor needs improvement, including the understanding of what the floor is about
Lack of some elements when talking about fundamental science (e.g. chemistry and composition of the matter, time and more about energy)
On the other hand, plenty exhibits about magnetism
The exhibits need to be put in “order” and in groups
Tables of exhibits could be more modern
Some exhibits lack information regarding natural phenomena, daily-related curiosities, general info Some exhibit design may be
confusing (e.g. the Big Spark is a red box in a wall – people might think that is some kind of electrical or fire material instead of an actual exhibit)
OPPORTUNITIES
To understand the F1 general potential
To put more information in the exhibits (e.g. Sight Test Eyechart, Bernoulli blower, rolling race) To refresh the floor in order to tell a
“story”, starting at the end of the escalator with engaging wall. That
THREATS
The type of interpretation of the “ropes/get knotted” may not be suitable for every single exhibit – challenge is how to find
interpretation suitable for all? Need to be careful about giving the
right amount of information to the public
20 might be a way to start a logical
pathway.
Challenge to put the space more “human” – need to build connection To find new interpretation strategy
(making new interpretative models) To have a general decoration and
organisation that indicates the main theme of the floor and also per group/field of the exhibits
To improve the first impression of the floor
To improve the exhibits technically and aesthetically speaking
Opportunity to have new exhibits or new fields (e.g. chemistry)
The refresh of the floor cannot exceed the budget
To put the space more human or to do storytelling without neglect the scientific rigour
It is necessary to focus also in the science fields that are there To put information in the exhibits
without make it boring (and should some exhibits keep open-ended?) Difficulty in moving exhibits Attention with the introduction of
chemistry (must be safe)
The improvement was needed on the floor 1: the ceiling, some grey walls (e.g. in the whispering dishes zone) and the floor (see whispering dishes zone in fig.4). Thoughts were formulated about having specific decoration to help in the organisation of the galleries and “guide” the visitor. A list of subjects was created (table 3) to understand if/how these different sub-themes could be related to the existing/new exhibits.
At this point, the exhibits concerning magnetism, sound, forces and other subjects were a little mixed in F1 and not completely separated by clear zones as in fig.4.
21 Table 2 - A list of possible sub-themes related to the exhibits on the floor 1;
3.1.2. Interpretation analysis
One of the main objectives of the Project was rethinking the interpretation. As referred in the introduction section, the labels on F1 were mostly in a prism shape. Although this makes the interpretative label to look very original, sometimes doesn’t work well in interactive hands-on exhibits. For example, in the “points of view” exhibit, a person is in a moving circle and must kick a ball and hit the centre of the circle. While the visitor is exactly inside the exhibit, the subject cannot check the interpretation prism that is located on the wall, while playing with the exhibit at the same time. In this specific case, static interpretation like simple boards/panels could be more effective.
Some labels were quite simple, not giving much information about interesting facts concerning the scientific principle behind the exhibit in the everyday life. One example is the jet with the big beach ball (that shows the Bernoulli effect). It could be interesting to show that this effect is the same that happens in the wings of the planes because planes are familiar objects inherent to the everyday life of the public. This can work as an attractive feature in the label, as defended by some authors because it goes
Possible sub-themes to create in F1
Senses Mechanics
Maths/Geometry Electricity
Illusions Electromagnetism
Physics Magnetism
Motion Space
River Clyde Fluids
Forces Waves
Air Light
22 along with characteristics of a good interpretative label. For instance, the fact that the visitor is driven by curiosity (Allen, 2004), the fact that when the label tells a story it becomes more interpretative (Serrel, 1996) and because planes are a topic that visitors can relate to (Veverka, 2003). To sum it, having this information could be a nice curiosity in the exhibit.
Suggestions
Some exhibit labels could have more text regarding natural phenomena,
daily-related curiosities (e.g. Sight Test Eyechart, Bernoulli blower, rolling race).
3.1.3. Idealisation of Clusters
Around 23 exhibits were chosen as examples (using 3 or 4 exhibits per sub-theme) and circles of clusters were draw in sketches (sketches in Appendix B and C), to think how they could relate to each other and have a logical order.
The team had already collected some ideas on how to divide the clusters (Appendix A). A general appreciation of these ideas was made and it was suggested to create around 7 sub-themes (Appendix D).
Suggestions
Create organised spaces with the exhibits more related among them (e.g.
clusters of around 7 fields in F1); They could be for example Motion,
23 Using sketches of possible clusters to create, (Appendix D and E) the F1 exhibits were carefully observed, with the goal to choose a group of them to study in detail. Any field could be selected, but some characteristics like the exhibits being movable were important to decide (Appendix F).
Finally, the sub-theme named “Sound” was chosen and idealised, to create the prototype exhibit cluster. A list of the Sound exhibits in GSC (table 4) was consulted in order to choose four exhibits to focus on.
Table 4 - List of exhibits about Sound in GSC
Exhibits in GSC about sound
Echo Tube Guitar Oscilloscope
Singing Bowl Xylophone and Soundbox
Theremin Whispering Dishes
Rippling Rods Infrared Harp
Bucket Radio How does sound move through air?
3.2.
The Exhibits
3.2.1. Sound Cluster Prototype
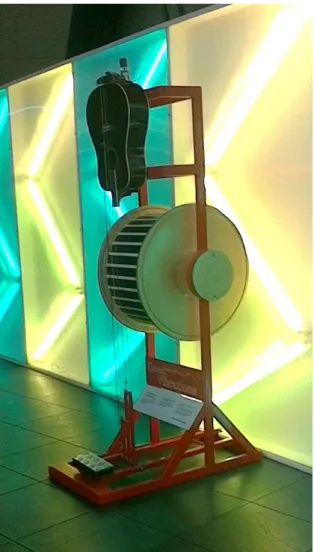
The work was mainly about finding a new interpretation strategy for four exhibits and test them with the audience. The Exhibits chosen were the Rippling Rods, the How does sound move through air, the Soundbox and Xylophone and Guitar Oscilloscope (fig. 5).
Changes in the planned Cluster
24 from the Floor 2, as it was extremely attached to the floor. It was an unforeseen event, and the engineers couldn’t easily move the exhibit. The other exhibits were instead moved to the Floor 2 next to the Guitar Oscilloscope and the exhibit Rippling Rods was left off. Singing Bowl exhibit was chosen to replace it.
1)
2)
3)
4)
25
Telling a “story” between the exhibits:
These exhibits were very easily related. People could visit this as a “Small -Sound-exhibition”, and learn the simplest concepts by playing with each exhibit one after the other.
Rippling Rodsit’s a simple model of a transversal wave created when the visitor pull a
rope.
How does the sound move through air? It’s a box with a spring, that show how sound
waves propagate by hitting a plunge. It’s about learning that sound is a vibration, how it is produced and propagated through air.
Guitar Oscilloscope with the shape of a upside-down guitar, it shows very clearly the
vibration in the strings and how that vibration is affected with different types of strings. Visitors may learn that they can intensify the vibration when they play the strings after spinning the barrel.
Xylophone and Soundboxit’s like the musical instrument, but make different sounds
depending on what’s inside. It could be used to explore different sounds caused by vibrations.
Singing Bowl - When the visitor wet his hands and rub them on the handles, the bowl
produce vibrations visible in the water and those vibrations can be felt in the bowl and table.
26 3.2.2. The information on the labels presented initially
Exhibit: How does the sound move through air?
The exhibit is placed on a table with the interpretation in the shape of a prism on the right side.
Before – media: prism
Figure 6–“How does Sound move through air” exhibit with its interpretation, in the first stage (when it was in F1)
Text in the first side of the prism:
How does sound move through air?
Hit the plunger at
27 Text on the second side of the prism:
Text on the third side of the prism:
Figure 7 – Photos of the three sides of the prism, the initial interpretation in the Exhibit "how does sound move through air”
Text on the 3rd side of the prism:
Sound travels through air as a wave of vibrations.
Just like the spring, sound energy makes air particles move back and forth, pushing the energy onto neighbouring air particles. This is an example of a longitudinal wave.
28
Exhibit:Xylophone and Soundbox
This exhibit was placed on a table, behind the Exhibit How does sound move through air. The interpretative label is the same media, a prism, and it in on the right side.
29
Before – media: prism
Text on the first side of the prism:
How does the sound travel?
Compare the sounds of the wooden drums
Compare the sounds of the glockenspiels
30 Text on the third side of the prism:
31
Exhibit: Guitar Oscilloscope
This exhibit is placed in the Floor 2, and the interpretative label is a flat panel placed below the cylinder barrel.
32
Before – media: panel
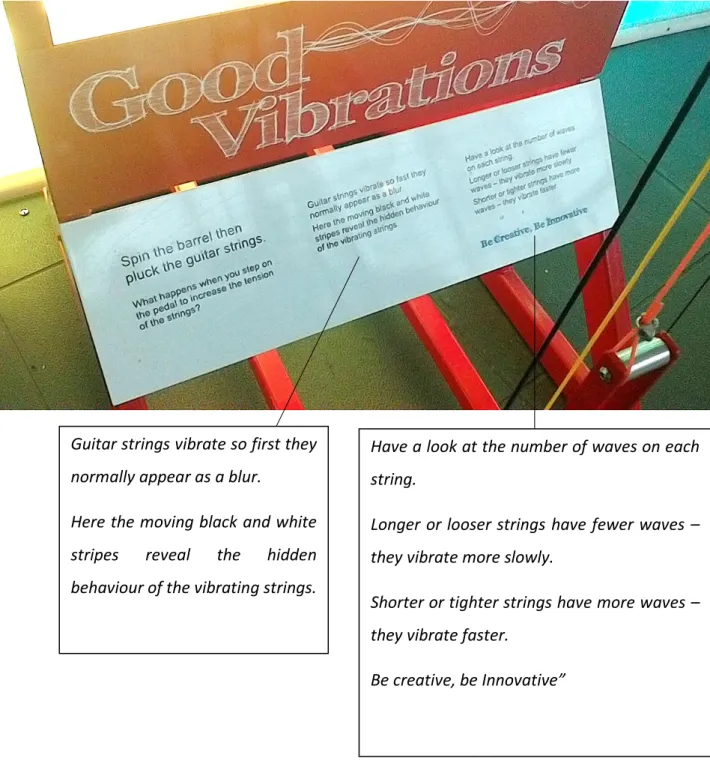
Guitar strings vibrate so first they normally appear as a blur.
Here the moving black and white stripes reveal the hidden behaviour of the vibrating strings.
Have a look at the number of waves on each string.
Longer or looser strings have fewer waves – they vibrate more slowly.
Shorter or tighter strings have more waves – they vibrate faster.
Be creative, be Innovative”
33
Exhibit: Singing Bowl
This exhibit that replaced Rippling Rods was placed in the Floor 2, with a flat panel interpretation in the table.
Figure 13 - Interpretation in the Exhibit "Singing Bowl” Figure 12- Singing Bowl exhibit and the
34 Looking for curiosities and the link to human connection
A sound map in a sketch form was made as part of the creative process, to think of ideas and subjects related to Sound (fig.14). Bearing in mind that oneof the goals of F1 was to find the human connection between exhibits and the visitors, we wonder about possible extra interesting stories, like presenting scientific curiosities.
Example of a scientific curiosity: 52Hz whale story
The 52-hertz whale is an individual whale that has a call of the frequency in 52 Hz.). Although the calls were detected the animal had never been seen. It seems that this is not usual in nature, so nobody knows which species the animal is and appears to be the only individual emitting a whale call at this frequency. The press described it as “the world’s loneliest whale”.
When planning this cluster, it was taken into consideration some “Knowledge and understanding” outcomes to provide:
1. What is a wave?
2. How to produce a vibration? 3. What is sound?
4. How to produce sound from vibration? 5. How are vibrations carried by waves? 6. How can we use waves?
7. What is sound pollution?
And in terms of “Enjoyment, inspiration and creativity”:
35 Fig. 14. A hand sketched
brainstorming of a Sound map. How many different things we can relate with
36
3.3.
Evaluation during the process
The evaluation of the Prototype Sound Cluster was made with different methods:
Front-end evaluation – with one front-end evaluation (the 1st observation)
Formative evaluation
- With Open feedback – using sticky notes to let people write on a board; - Two Observations during the Prototype Sound Cluster - 2nd and 3rd
observations;
- Interviews using a simple questionnaire and open questions;
This section summarises the front-end (testing the interaction of the visitors before the organisation of the cluster) and formative stages (during the prototyping and organisation of the cluster) of evaluation. These tests were intended to identify potential barriers and search for suggestions, recommendations and features necessary to improve successfully the interactive exhibits.
3.3.1. Observations
The 1st Observation was with the first original exhibits (Rippling Rods, How does Sound move through air, Guitar Oscilloscope and Xylophone and the Soundbox) separated, in the original places with the original interpretation. The Guitar Oscilloscope was the only exhibit that was on the Floor 2.
Sample
37 labels, there were attempts to understand if people were reading the labels during the observations. It was somewhat difficult to understand this with only distant observation. Measurements with qualitative scales like “social interaction” were recorded but it’s not discussed in this report since it’s not very relevant for these specific exhibits.
The Observations were based mostly in children from school trips (because the observations were made during the week).
Table 5 – A table inspired in the Visitors Learning Behaviour Observational Plan provided by the Evaluation department. Numbers 1-7 correspond to the observable actions at table 1.
Investigation during Prototyping
Using the table 5, while being guided by the system to measure specific learning behaviours (table 1), both tools sustained by the Evaluation Department at GSC, each line to be completed on the table would correspond to one single visitor tracked from the sample. The gross results are in Appendix G and the treated results in the Results and Discussion Section. The interaction between each visitor with the exhibit was observed, and measurements of the time spent, the size of the group, how many children and adults and other comments were recorded.
The “attraction power” was not considered in this case study since the data is concerning about any subject who started some sort of interaction with the exhibits. This way the Initiation learning behaviour is always considered for 100% of the people studied.
Initiation Transition Breakthrough Comments Exhibit Time
spent (min)
Group size
No. children
No. adults
38 The Sound Prototype Cluster was finally composed by the following exhibits: How does sound move through air?, the Guitar Oscilloscope, the Xylophone and Soundbox and the Singing Bowl (fig.15).
For the second observation, to test new text prototype labels the old labels were covered with paper, to get the attention of the visitors for the new ones.
Results Treatment
As it was introduced in this report, the evaluation was very inspired by Barriault and Pearson studies. Their studies use the Visitor Engagement and Exhibit Assessment Model (VEEAM) (fig. 16), a model that can generate real insights into the impact of exhibits on the visitor learning
39 experience. Through the Observation data collected, a Visitor Engagement Framework is designed. Then it’s made a quantification to access graphics of Visitor Engagement Profiles for each exhibit.
3.3.2. Board of information and feedback
Once the four exhibits were together, a board with information regarding the prototype exhibit cluster (fig.17) was placed beside the Guitar Oscilloscope. This board (fig.17) was constituted by a title (Prototype Exhibit Cluster) follow by a description of what the prototype was about. Then it was fixed a big image about the hearing range of different animals and two curiosities in the shape of squares about sound. The rest of the board was used to collect visitor’s feedback through sticky notes.
40 The board had some changes over time, as it was a constantly being tested as a prototype. For instance, the initial title was just text but then was replaced with a title with a visual sound symbol (fig.18 A) hoping that this could take the theme more intuitive.
Other changes included switching the texts of the description and the instructions asking for feedback, with others with more pleasant infographics (fig.18 A) and B)). We test changing the placement of the feedback sticky notes. In the last model, different ways to access to feedback using some papers with pre-asked questions were created (fig. 18 B)).
Figure 17 – First Board with information about the Prototype Exhibit Cluster.
Title: “Prototype Exhibit Cluster”
Animal frequency hearing range entitled “Do you have hearing like a
bat?” Description of the
Cluster entitled “A journey around sound”
Curiosities about the 52Hz whale and the hearing of the dogs
Sticky notes for visitors write feedback
Feedback instruction entitled: “We want to HEAR
41 3.3.3. Interpretation conceptualization
There were some questions to be considered:
Who is our audience? – Based on the first observation, the audience was mostly children, schools and families. In general, children don’t read labels, so information was cut comparing with the original texts. There was an effort in putting the language in the panels accessible for children with eight years old at least.
How long do they stay?– Seconds. Checking from the first Observation (Results section), the interactions quick and usually, the subjects just want to play.
A) B)
42 The Media
Panels were the media chosen to make the labels. They were the easiest to do for fast prototyping, the easiest to use, accessible, intuitive and less distractive than prisms. Stickers were also made, with the idea of drawing attention, and because it seemed that most visitors don’t read the labels.
The Message
The information was divided into three layers: the sticker was the first layer, and draw the attention for the principal instruction. Then two texts were made: one to complete the instruction and explanation of the exhibit in very short sentences and the third layer (for those subjects that could want to know more), with a fun curiosity related to the subject.
LOOK
up!
43
Dimensions of the label and features of the font to make (like the Singing Bowl label)
16.99 cm x 18.99 cm
44
“H
ow does sound move through air
?”
Instruction:
Make a sound wave
Hit the red button at the end of the tube.
You just made a sound wave.
Sound travels as a wave of vibrations in air, solids and liquids.
Curiosity:
Waves are everywhere
You can find other type of waves in nature such as theocean waves and light waves.
Interpretation media visual Interpretation content
Interpretation placed in the exhibit
Sticker
45
Guitar Oscilloscope
Music really makes you feel good
Do you have goose bumps when you hear a song that you love?
It is caused by your brain releasing pleasure hormones while anticipating the peak moment of the song.
Good Vibrations
Can you notice the different vibrations each string produce? Look at the number of waves.
Longer or looser strings have fewer waves – they vibrate slower
Shorter or tighter strings have more waves – they vibrate faster
Interpretation media visual Interpretation content
Interpretation placed in the exhibit Sticker
46
Xylophone and Soundbox
Instruction:
Explore different sounds
Sound needs something to travel through.
The shape and material of the instruments influences the sound you hear when you hit them.
One of the metal xylophones is fastened and one of the wooden drums has padding inside which causes them to make lower sounds.
Curiosity:
There are no explosion sounds in space
There is no sound in the vacuum of space because there is nothing to travel through.
Next time you watch a science fiction movie, notice if they make the mistake of adding sound in space.
Interpretation media visual Interpretation content
Interpretation placed in the exhibit
Sticker
47
Singing Bowl
Singing Bowl
Interpretation labels
Instruction – we use the original
because it was already good enough Curiosity
Interpretation placed in the exhibit
48
3.4.
Testing with the prototype labels
2nd Observation
After the new interpretation labels were fixed on the exhibits the formative evaluation was
made. A second observation took place during two days with a similar sample as the first observation, methodology and the data was recorded. The results are expressed in the Results section.
3rd Observation
Since prototyping is based on testing different things, another change was made to make the labels more attractive. The text was the same but a colourful frame was added to the interpretation labels to provide a more understandable distinction between the instructions (blue frames) and the curiosities (green frames) (fig. 24 and fig.25). We also added the same sound symbol, presented in the title of the Board.
49 A third observation was conducted with the new interpretative media following the same process as the other observations.
50
3.5.
Interviews
After the observations, to obtain more results concerning a broader public instead of mainly schools, face-to-face interviews were conducted during the two weekends. During the weekends there were more families in the Centre. The questions were made to random 39 visitors, within two categories: visitors or staff. The Visitors would be teenagers (age 14-18 years) or adults. The goal was to get more spontaneous and direct suggestions. The subjects were asked to play with the exhibits in the Cluster and to answer a few questions at the end:
Question 1) How would you rate the overall experience?
Question 2) What would you make this cluster of exhibits more interesting?
Question 3) What did you think the science message of the exhibits is?
Question 4) How easy to operate are the exhibits?
Question 5) Anything else you want to say about the exhibit? Any improvements?
Question 6) Would you like to know more about sound. If yes, what would you like to
find out?
Table 6 –Distribution of the interviewed people’s answers, distinguishing visitors/staff and the age group.
Number of questioned people
Group Age Group
39 Visitors Staff
member
Adults Teens (14-18 years old)
51
4.
Results and Discussion
In this section, results obtained from the evaluation are presented (feedback through sticky notes, observations and the interviews). While doing the three observations It was noticed a difference between observing schools and families. Children who came with schools walk and play much faster. This is one of the reasons why the present results show short times of engagement.
4.1. Sticky Notes Feedback
I found out that this method was not very useful. People don’t write much feedback if not asked directly and the sticky notes were mainly written by young children, making drawings and unrelated subjects. When the feedback “instructions” were changed to highlight the need for feedback about the Sound exhibits specifically, visitors still didn’t offer much useful feedback. We understood that evaluation through observation and interviews is much more efficient.
Nonetheless, a few notes were collected that could relate somehow to the sound theme:
- “More about superheroes”
It’s possible to relate sound with superheroes. E.g. we could have a fun curiosity about the DC superhero Flash and the relation of its speed with the sound speed.
- “More about owls”
- “Animals noises would make it more interesting” - “How loud is a mouse?”
Suggestions
To be in the interest of the younger visitors, it should be added curiosities in the
52
4.2. Front-End evaluation results
4.2.1. 1st Observation
The complete data can be found in tables in Appendix G. Those results were treated to create simpler tables who show results clearly. In table 7, we present the times tracked showing the minimum time a visitor interacted with the exhibit, the maximum time, the mean and the medium.
Table 7 – Tracking-and-timing Data (in seconds) for a visitor. N= number of visitors tracked. The values were treated from Appendix G annexe G.1.1 – annexe G.1.4.
Exhibit N
Time min (sec)
Time max
(sec) Mean Medium
Rippling Rods 20 1 67 18 14
Guitar Oscilloscope 20 3 80 35 33
How does the sound move
through air? 20 1 79 19 14
Xylophone and Soundbox 20 5 108 42 42
53 In table 8, the results are presented for all exhibits in terms of quantities of people reaching the Learning Behaviours.
Table 8 – Tracking how many visitors reach the Learning Behaviours during the 1st observation. The values were
treated from Appendix G annexe G.1.1 – annexe G.1.4.
1 -Rippling Rods, 2 - Guitar Oscilloscope, 3 - How does the sound move through air?, 4 - Xylophone and Soundbox
As expected we can see a great decrease from the Initiation to the next learning behaviours in all three exhibits. Although people spend in general a few seconds interacting with How does sound move through air? It was the exhibit with more people reaching the Breakthrough. The exhibit seems to be of two extremes: either the subject just hit the button and goes off, without checking the result or stays a bit longer, try to understand the phenomena and engage with the exhibit.
Further Concerns:
Rippling Rods:
People stayed in this exhibit for a very short period.
Most visitors didn’t read the label. It might have to do with the fact that the label was
not placed strategically.
The exhibit was accessible: physically and intellectually.
Learning
Behaviour Exhibit
1 2 3 4
Initiation 20 20 20 20
Transition 11 8 6 9
54
This is one exhibit where putting a sticker with a drawing attention sign such as “Look Up!” (fig. 19, Methods section) could be beneficial.
Guitar Oscilloscope:
The initial interpretation was too low. A support is needed to place the interpretation
besides the guitar in the line with the eyes of the visitor.
It was realised that a sticker could be added, for the Prototyping Observations. The
sticker could say “play the strings and spin the barrel” and be attached to the guitar body. This way the instruction would be along the vision of the subjects.
Although people spent a short time engaging with the exhibit, in general, there was
some engagement with this exhibit.
Seemed to be very popular. The familiar shape must be one of the reasons.
How does sound move through air?
This exhibit went quite unnoticeable.
It seems to need a new interpretation or a new place. Some children just played with
the prims (the original media of interpretation in the exhibit), but they didn’t read them, which means this interpretation was being distractive. It was also rare that visitors turn prism and look to other sides of the interpretative media.
It seemed that subjects didn’t find this exhibit particularly exciting.
However, if compared with the other exhibits, people read more the interpretation
(probably because it’s not so intuitive like the instruments for example).
Some people gave up very soon. It was observed visitors hitting the button and not
55 Xylophone and Soundbox
People recognised the shape of the xylophone and understand automatically what
to do, so maybe for that reason, they read less the labels.
Essentially people liked this exhibit and used it to play music.
This exhibit got lots of variation in terms of time of engagement. It seems that
whether people love it or don’t find interesting at all. They might play for a long time, engaging in a more spirited way, especially if they are young children, or they might think is just a common instrument with no big science behind it and so, the exhibit might not be enough challenging to sustain engagement.
4.3. Formative evaluation
4.3.1. 2nd observation
The results of the second observation are presented here. The exhibits were already placed in the cluster on the second floor (exhibit 1- singing bowl; 2- Guitar oscilloscope; 3- How does sound travel through air?; 4 – xylophone and soundbox). For the first time, the exhibits were together with the old labels covered and the new prototype labels fixed.
Table 9 – Tracking-and-timing data (in seconds) for a visitor. N= number of visitors tracked. The values were treated from Appendix G annexe G.2.1 – annexe G.2.4.
Exhibit N
Time min (sec)
Time max
(sec) Mean Medium
Singing Bowl 23 4 162 49 37
Guitar Oscilloscope 24 8 84 27 22
How does the sound travel
through air? 21 1 30 11 10
56 Like the first observation, a sample of around 20 visitors was used (table 9). Singing Bowl was the exhibit where people spent more time and How does sound move through air was the exhibit where they spent less.
Table 10 – Tracking how many visitors reach the Learning Behaviours during the 2nd observation. The values
were treated from Appendix G annexe G.2.1 – annexe G.2.4.
1 -Singing Bowl, 2 - Guitar Oscilloscope, 3 - How does the sound move through air?, 4 - Xylophone and Soundbox
Once again there aren’t many people reaching the Transition and Breakthrough from the total sample. No visitors reached the Breakthrough at the How does sound travel through air? from the 21 people tracked. However, Singing Bowl success was very well evidenced. From the 21 people tracked 9 got to the breakthrough, which is about 42% of the visitors who interact with the exhibit.
During this observation, it was noticed some interaction with the new prototype stickers over the guitar, which mean that they probably were functioning well.
This floor had lots of things that may affect the attention of the visitor like science shows, the Theremin exhibit (which is a very noisy exhibit) and a dance floor very close.
Learning
Behaviour Exhibit
1 2 3 4
Initiation 23 24 21 22
Transition 9 7 1 4
57 Suggestions
The ideal would be getting a new more isolated area in the centre with better
acoustic specifically for the sound exhibits. Otherwise, it’s necessary at the least to move the exhibit Theremin to not disturb the use of other Sound exhibits.
Some specific considerations
Singing bowl:
Positive expressions like “Oh my god!”were spoken by the visitors engaging with the
singing bowl.
This exhibit itself is a bowl, so is not very intuitive, which lead people to read the
interpretation to understand what to do. But the illustration and the instruction are very well done, and people use well the exhibit and enjoy. Singing Bowl was the most popular exhibit of the Cluster. People felt the vibrations in the hands and even on the floor and found that amazing.
Suggestions
Getting a towel to put beside this exhibit since visitors need to wet their hands.
Guitar Oscilloscope
Guitar Oscilloscope seems to attract the visitors, but do not have much engaging
power.
How does sound travel through air?
It was noticed people reading the sticker, which is natural since it was quite. It’s a very
58 phenomenon behind. However, some visitors were still struggling to understand the exhibit.
4.3.3. 3rd observation
The third observation was made with the new prototype interpretation with colourful borders. Table 11 presents the tracking-and-timing data of the observed visitors.
Table 11 – Tracking-and-timing Data (in seconds) for a visitor. N= number of visitors tracked. The values were treated from the tables in the Appendix G annexe G.3.1 – annexe G.3.4.
How does the sound move through air exhibit continues to have a short time spent and the Xylophone has a very big max time of time spent (327 sec). This high value happened because one the visitors, a child, played with the exhibit for a long time (more than 3 minutes, which was an incredible moment of engagement, part of the ultimate Breakthrough behaviour according to Barriault & Pearson (2010).
Exhibit N
Time min (sec)
Time max
(sec) Mean Medium
Singing Bowl 23 7 95 41 33
Guitar Oscilloscope 21 2 81 26 21
How does the sound move
through air? 19 1 27 11 9