Original
Received 26/07/2010 Accepted 23/02/2012 (004935)
1 Universidade Federal dos Vales do Jequitinhonha e Mucuri – UFVJM, Rua da Glória, 187, Centro, CEP 39100-000, Diamantina, MG, Brasil, e-mail: [email protected] *Corresponding author
Influence of color on acceptance and identification of flavor of foods by adults
Influência da cor na aceitação e identificação do sabor dos alimentos por adultos
Nayane Aparecida Araújo DIAS1, Suzana Borges LARA1, Lucilene Soares Miranda1*, Ivy Scorzi Cazelli PIRES1, Christiano Vieira PIRES1, Nadia Veronica HALBOTH1
1 Introduction
The study of alimentary behavior can lead to a better understanding of the biological and cultural factors, which influence food consumption and can stimulate the promotion of healthy eating habits (ALVES;BOOG, 2007).
Choosing healthy foods does not depend only on access to adequate nutritional information. The selection of food depends on many existing preferences related to the pleasure associated with sensory characteristics of foods, habits learned in childhood, and psychological and social factors. Sensations related to the palate reveal information about consistency and chemical composition of foods, and they can influence the acceptance or rejection of foods, decisions based on factors such as innate preference, appetite, and education (PHILLIPS; FUCHS, 1989; VIANA, 2002). Sensory qualities such as color, flavor, aroma, and texture are strong determinants of
alimentary behavior. These food properties not only play a role in determining consumption, but also in choosing foods during a meal, ingestion, and degree of satisfaction (MATTES; KARE, 1994).
In the food industry, color is has become more and more important in terms of how food is displayed and sold, and thus it is an indicative parameter used in quality control. It is also added to foods to stimulate the appetite.
Although these sensory characteristics are subjective, they are very important for our overall understanding of food consumption, along with other characteristics such as aroma, flavor, and texture. The appearance of food can stimulate or inhibit appetite (COLLINS; PLUMBLY, 1995; FREUND et al., 1988). Only rarely will food be eaten, or even tasted, if its color is unattractive, even if its appearance and aroma are. Thus, it
Resumo
As características sensoriais cor e sabor dos alimentos desempenham papel importante não somente na seleção, como também na determinação do consumo, ingestão e saciedade. Objetivando determinar e avaliar a influência da cor na aceitação e identificação do sabor dos alimentos por adultos, foram realizados testes de análise sensorial com gelatinas por provadores não treinados, de ambos os gêneros, com idade entre 18 e 60 anos (1750 provas). No teste de aceitação (escala hedônica), utilizaram-se combinações de cinco cores (vermelho, amarelo, verde, azul e roxo) e três sabores (morango, abacaxi e limão) perfazendo 15 amostras. No teste de diferença (Duo-Trio), foram oferecidas juntamente com a amostra-referência (R), uma idêntica e outra de mesma cor e sabor diferente, sendo solicitada a identificação da amostra diferente de R. As cores utilizadas não influenciaram a aceitação das amostras (p > 0,05), não houve interação significativa entre cor e sabor, porém o sabor limão influenciou negativamente na aceitação. Quanto à diferenciação do sabor, a cor não influenciou a identificação (p > 0,05), entretanto identificou-se comportamento diferenciado entre os gêneros, sendo o gênero masculino mais susceptível ao erro. Nas condições experimentais, a cor não influenciou a aceitação e identificação do sabor por indivíduos adultos.
Palavras-chave: dietetic; análise sensorial; comportamento alimentar.
Abstract
The sensory characteristics color and flavor of food play an important role not only in the selection, but also in the determination of consumption, satiation, and ingestion. With the objective to determine and evaluate the influence of color on the acceptance and identification of flavor of foods for adults, sensory analysis was performed on jellies by non-trained tasters of both sexes aged between 18 and 60 years (1750 tests). A hedonic scale and combinations of five colors (red, yellow, green, blue and purple) and three flavors (strawberry, pineapple, and limes) were used in the acceptance test totaling 15 samples. In the duo-trio discrimination test, together with the reference sample (R), one sample identical to the reference and another of identical color and different flavor were offered, and the judges were requested to identify the sample that was different from the reference sample. The colors used did not influence the acceptance of the samples (P > 0.05), and as there was not significant interaction between color and flavor. However, the limes flavor negatively influenced acceptance when compared to the other flavors. With regard to flavor differentiation, the colors used did not influence flavor identification (P > 0.05); However, differentiated behavior was identified between females and males, and the latter were more error-prone. Therefore, under the experimental conditions tested, color did not influence the acceptance and identification of the flavor of the samples by adults.
Keywords: dietary; sensory analysis; alimentary behavior.
and observing the combinations of colors and flavors shown in Table 1.
The colors were selected due to their high frequency in foods (green, yellow, and red), or because they are often used to increase the attractiveness of products (blue and purple). Strawberry, Lime, and pineapple flavors were chosen because they are the artificial colors that most resemble natural flavors and/or due to their frequent use in industrial food. Grape and tutti-frutti flavors were used only in the test for the influence of color on the perception of flavor in order to utilize the usual combination between color and flavor; they were not used in the acceptance tests.
2.2 Tasters selection
The tasters were randomly chosen for the acceptance and discriminatory tests. The tasters, men and women, were untrained and were between the ages of 18 and 60. Diabetics, smokers or former smokers, people with uncorrected visual problems, and subjects with certain allergies were not included in the research. All tasters signed consent forms.
2.3 Sensory analysis
The sensory analyses included the acceptance and discriminatory tests. Gelatin samples, each of approximately thirty grams (30 g) codified with random three- digit numbers were presented to 50 tasters in individual cubicles (CHAVES, 2001).
Acceptance test
The tasters received different samples, one by one, of the same color and flavor and were offered water and a cracker between each gelatin sample. A 9-point structured hedonic scale was used to evaluate each sample (CHAVES, 2001).
can be inferred that colors play a significant role in the choice of food by influencing the gustative threshold, perception of sweetness, preference, and acceptance (CLYDESDALE, 1994) in addition to awakening sensations, defining actions and behaviors, and causing physical and psychological reactions (CREPALDI, 2006).
Fruits and vegetables, primarily, have an enormous array of pigments that arouse a greater or lesser interest in food. According to Jaime and Monteiro (2005), some specific colors, such as green vegetables, are less accepted by the general population. Color also contributes to the identification of food flavors. In a study using sweet fudge, samples with an intermediate color were more readily accepted (KONKEL et al., 2004). In an experiment conducted at the Faculty of Oenology at the University of Bordeaux, white wines were dyed with red pigments extracted from red wines. When the participants tasted the samples, they identified differences in flavors between the dyed wine and the white wine showing that taste depends not only on the palate but also on the appearance of food (THIS, 2007).
Schlosser (2001) demonstrated that color had a great effect on food acceptance. The participants of the study were directed to a special room with colored lights, where they were offered a plate of French fries and steak. The food presented seemed to have the characteristic flavors, but when the tasters noticed that the steak was blue and the fries green, some felt sick (SCHLOSSER, 2001). This reaction can be attributed to people’s instinctive aversion to certain food colors, such as blue. Since blue is rare in natural foods and is in fact sometimes associated with spoiled foods, food with this color would be expected to have an unpleasant taste or be unhealthy (although certain desserts and sweets are exceptions). These results show the importance of further studies aimed at extending knowledge about the influence of sensory factors in food consumption. The objective of the current study is to determine and evaluate the influence of color on the acceptance and perception of food flavors by adults.
2 Materials and methods
This research was carried out after receiving approval from the local Human Research Ethics Committee.
2.1 Sample preparation
The samples(for the tests of color influence on food acceptance and flavor perception) were standardized: Colorless and odorless flavors, sugar, salt, acidulant, and colors were added to gelatin to make it similar to commercial gelatins. Food aroma and artificial colors were added in accordance with Brazilian legislation on the use of additives in food (BRASIL, 1999). For all of the tests, the gelatin was prepared with the following concentrations: an unflavored, colorless gelatin powder (1.7%), sugar (12%), and salt (0.1%). The preparations were formulated in the dietary technique laboratory of the Federal University of the Valleys of the Jequitinhonha and Mucuri (UFVJM), Diamantina - MG - Brazil, under ideal hygienic conditions
Table 1. Combinations of colors and flavors in the elaboration of preparations used for the evaluation of the influence of color on the acceptance of foods and perception of flavor.
Color Flavor
Red Strawberry
Red Lime
Red Pineapple
Green Lime
Green Strawberry
Green Pineapple
Yellow Pineapple
Yellow Lime
Yellow Strawberry
Purple Lime
Purple Pineapple
Purple Strawberry
Blue Lime
Blue Pineapple
Moreover, because of the different degrees of sensitivity and identification of each color by different individuals, it is difficult to foresee the human reaction to chromatic stimuli since such reactions are not uniform. Although acceptance seems to be somewhat relative, psychological aspects influence the choice of one color or another and, therefore, each person perceives exterior stimuli according to his or her sense structure (CREPALDI, 2006). However, when the flavor was analyzed by the ANOVA and Tukey tests (p > 0.05), a statistical difference was observed between them (Table 3). The strawberry and pineapple flavors had good acceptance levels, possibly because of their sweetness and frequent consumption from early life (STEINER, 2001). Cunha et al. (2009) analyzed the acceptance of oat creams with pineapple, strawberry, grape, tutti-frutti, and lime flavors among different age groups and did not observe a significant difference among adults, contrary to the experiment with gelatins.
The lime flavor presented the smallest acceptance index, failing to reach the approval value of 70% and being statistically lower than that of the strawberry and pineapple flavors.
Although color did not influence the acceptance of the products, it did invoke feelings of disappointment and surprise demonstrating the tasters’ expectations about flavor in relation to color. The most frequent comments were:
• “The color does not interfere with the acceptance of the foods. On the contrary, to me, the acceptance would improve”;
• “Interesting. Color arouses curiosity about the flavor”;
• “I found the contrast between the flavor and the color of the food interesting. To me, it tasted like lime but with a blue color”;
• “The flavor resembles strawberry, but I wish it were red”;
Discriminatory test
The influence of color on flavor identification was evaluated using the duo-trio discrimination test. The reference sample, identified with the letter R, was presented to the tasters with two other samples, one identical to the reference and another with the same color but a different flavor (for example: two red samples - one strawberry- flavored and one lemon-flavored). All the samples were codified with random three-digit numbers. The tasters were asked to identify differences from the reference sample (CHAVES, 2001).
2.4 Data analysis
The data were tabulated on an Excel software spreadsheet. The acceptance test followed a nine-point hedonic scale (from “disliked extremely” to “liked extremely”) and for the discriminatory test, the options were zero and one (0 is reference and 1 is the difference from the reference). A 5 × 3 factorial experiment was used to analyze the data evaluated. The statistical analyses were developed using the SAS 7.1 version software. The data regarding the influence of color on flavor identification from the duo-trio test were statistically analyzed through a unilateral normal distribution table, at 5% of probability, according to Chaves (2001).
3 Results and discussion
3.1 Acceptance test
This test aimed to determine the acceptance of red, yellow, green, purple, and blue gelatins when combined with strawberry, pineapple, and lime flavors. Seven hundred and fifty individuals took part in the test, of whom, 42.53% were males and 57.47% females with an average age of 22. According to Farina (2006), age is one of the factors that influence color preference. Generally, people prefer red when they are 1 to 10 years of age, orange between the ages of 10 and 20, yellow from 20 to 30, green from 30 to 40, blue from 40 to 50, and purple from 50 to the 60. A study carried out by Schumann, Polônio e Gonçalves (2008) demonstrated that the majority of children consume food artificially colored and that the gelatin was the most frequently mentioned food.
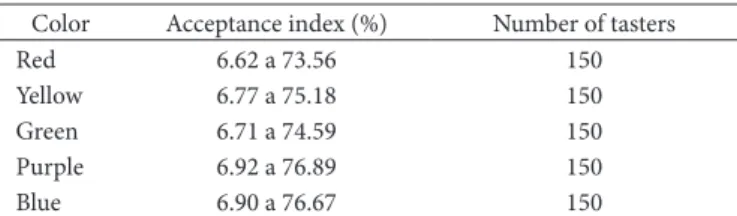
Numerical differences in the averages of the score given by the tasters for each color showed no significant statistical difference. No significant interaction between the color and flavor variables was observed when the ANOVA and Tukey tests (p > 0.05) were carried out either. All colors presented a good acceptance index with the approval of over 70% (Table 2).
The fact that no significant differences were observed may be explained since the product used in the tests with gelatin has strong differentiated colors. The blue gelatin, for example, was well-accepted presumably because of its new and different color which, in this case, was attractive to the consumers. However, it would probably not be as readily accepted in other foods due to the fact that it is rare and sometimes associated with spoiled food (SCHLOSSER, 2001).
Table 2. Average of hedonic scores, acceptance index, and number of tasters for each different gelatin color.
Color Acceptance index (%) Number of tasters
Red 6.62 a 73.56 150
Yellow 6.77 a 75.18 150
Green 6.71 a 74.59 150
Purple 6.92 a 76.89 150
Blue 6.90 a 76.67 150
Averages followed by the same letter do not differ from each other in the Tukey’s test with significance of 5%.
Table 3. Average of hedonic scores, index of acceptance, and number of tasters for each gelatin flavor.
Flavor Average of given notes
Acceptance index (%)
Number of tasters
Strawberry 6.96a 77.33 250
Pineapple 7.14a 79.38 250
Lime 6.24b 69.42 250
influence the perception of the intensity of the flavor. Shankar, Levitan e Spence (2010) highlighted the existence of cultural differences between the flavor-color associations for certain colors. However, women and men showed different behaviors when the flavors were presented with unusual colors (Table 4).
Zampini et al. (2007) showed that the accuracy of participants’ flavor discrimination performance was significantly lower when the solutions were colored inappropriately they were colored appropriately (or else were presented as colorless solutions). It also showed that the modulatory effect of visual cues on flavor perception can override participants’ awareness that the solutions would frequently be colored inappropriately.
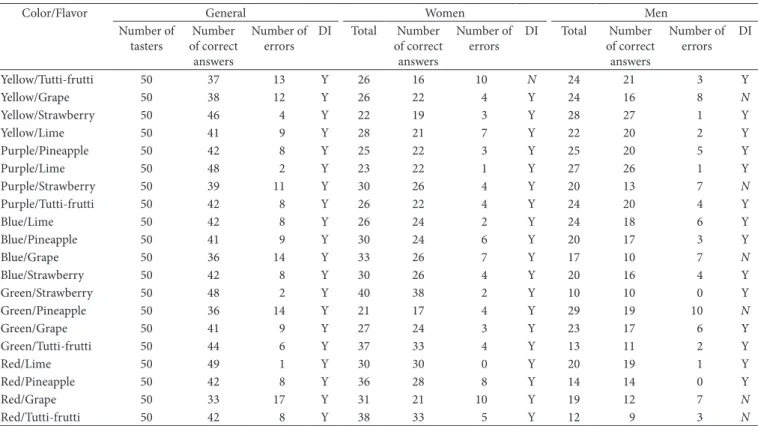
Table 4 shows the difference (DI) when comparing the standard color/flavor samples to the other samples in the Duo-Trio test, according to the classification by all tasters (general) and by gender, evaluating the number of participants who did or did not identify the different flavored unilateral sample with a level of significance of 5% of probability for the unilateral normal distribution table.
The colors red, purple and blue made male tasters unable to distinguish flavors. One hundred and thirty five women and 65 men took part in the test with the color red of whom, 82.9% and 83.1%, respectively, identified the different flavor. Although the percentage of men who identified the flavor was greater than that of women, the men made more errors with certain color/flavor combinations. When red was used, they did not distinguished grape and tutti-frutti flavors from strawberry
• “I could not identify the flavor, but it isn’t grape”;
• “I identified the flavor (lime), despite the different color”;
• “The color did not affect the flavor. The gelatin became even more interesting: lemon with a grape appearance”;
• “Although the color is not compatible with the taste, it did not influence me”;
• “It tasted like gelatin bought from the supermarket”;
• “The taste does not go with the color”; and
• “The green color, characteristic of lime gelatin, does not go with the tutti-frutti taste”.
3.2 Discriminatory test
One thousand individuals took part in the duo-trio test, 58.5% of whom were women and 41.5% men. This test was carried out to observe the influence of red, yellow, green, purple, and blue colors in the identification of the strawberry, pineapple, lemon, grape, and tutti-frutti flavors. Utilizing the unilateral table of normal distribution, color was found to have no statistically significant influence on the identification of the flavors by adults in general (p > 0.05); probably because color has a great impact before consumption in the expectation of a specific flavor (ORAM et al., 1995) and also because during consumption oral stimuli exert greater influence on the perception and identification of flavor among adults. According to Shankar et al. (2009), in a study with adults, color can
Table 4. Identification of the differences (DI) comparing standard color/flavor samples to the other Duo-Trio test samples.
Color/Flavor General Women Men
Number of tasters
Number of correct
answers
Number of errors
DI Total Number of correct
answers
Number of errors
DI Total Number of correct
answers
Number of errors
DI
Yellow/Tutti-frutti 50 37 13 Y 26 16 10 N 24 21 3 Y
Yellow/Grape 50 38 12 Y 26 22 4 Y 24 16 8 N
Yellow/Strawberry 50 46 4 Y 22 19 3 Y 28 27 1 Y
Yellow/Lime 50 41 9 Y 28 21 7 Y 22 20 2 Y
Purple/Pineapple 50 42 8 Y 25 22 3 Y 25 20 5 Y
Purple/Lime 50 48 2 Y 23 22 1 Y 27 26 1 Y
Purple/Strawberry 50 39 11 Y 30 26 4 Y 20 13 7 N
Purple/Tutti-frutti 50 42 8 Y 26 22 4 Y 24 20 4 Y
Blue/Lime 50 42 8 Y 26 24 2 Y 24 18 6 Y
Blue/Pineapple 50 41 9 Y 30 24 6 Y 20 17 3 Y
Blue/Grape 50 36 14 Y 33 26 7 Y 17 10 7 N
Blue/Strawberry 50 42 8 Y 30 26 4 Y 20 16 4 Y
Green/Strawberry 50 48 2 Y 40 38 2 Y 10 10 0 Y
Green/Pineapple 50 36 14 Y 21 17 4 Y 29 19 10 N
Green/Grape 50 41 9 Y 27 24 3 Y 23 17 6 Y
Green/Tutti-frutti 50 44 6 Y 37 33 4 Y 13 11 2 Y
Red/Lime 50 49 1 Y 30 30 0 Y 20 19 1 Y
Red/Pineapple 50 42 8 Y 36 28 8 Y 14 14 0 Y
Red/Grape 50 33 17 Y 31 21 10 Y 19 12 7 N
Red/Tutti-frutti 50 42 8 Y 38 33 5 Y 12 9 3 N
República Federativa do Brasil, Brasília, DF, 17 mai. 1999. Seção 1, n. 92, p. 41-43.
CHAVES, P. B. J. Métodos de diferença em avaliação sensorial de alimentos e bebidas. Viçosa: UFV, 2001.
CLYDESDALE, F. M. Changes in color and flavor and their effect on sensory perception in the elderly. Nutrition Reviews, v. 52, n. 8, p. S19-S20, 1994. http://dx.doi.org/10.1111/j.1753-4887.1994. tb01441.x
COLLINS, P.; PLUMBLY, J. Natural colors: stable future? Food Tech Europe, v. 49, n. 2, p. 64-70, 1995.
CREPALDI, L. A influência das cores na decisão de compra: Um estudo do comportamento do consumidor no ABC paulista. In: CONGRESSO BRASILEIRO DE CIÊNCIAS DA COMUNICAÇÃO - INTERCOM, 29., 2006, Brasília. Anais... Brasília, 2006. p. 1-11.
CUNHA, C. S. et al. Influência da textura e do sabor na aceitação de cremes de aveia por indivíduos de diferentes faixas etárias.
Alimentos e Nutrição, v. 20, n. 4, p. 573-580, 2009.
FARINA, M. Psicodinâmica das cores em comunicação. 5. ed. São Paulo: Edgard Blucher, 2006.
FREUND, P. R.; WASHAN, C. J.; MAGGION, M. Natural color for use in foods. Cereal Foods World, v. 33, n. 7, p. 553-559, 1988. JAIME, P. C.; MONTEIRO, C. A. Consumo de frutas e hortaliças na
população adulta brasileira, 2003. Cadernos de Saúde Pública, v. 21, p. S19-S24, 2005. Suplemento.
KONKEL F. E. et al. Avaliação sensorial de doce de leite pastoso com diferentes concentrações de amido. Ciência e Tecnologia de Alimentos, v. 24, n. 2, p. 249-254, 2004. http://dx.doi.org/10.1590/ S0101-20612004000200015
MATTES, R. D.; KARE, M. R. Nutrition and the chemical senses. In: SHILS, M. Modern Nutrition in health and disease. 8. ed. Pensylvania: Lea e Febiger, 1994. v. 1, p. 524-536.
ORAM, N. et al. The influence of flavor and color on drink identification by 9children and adults. Developmental Psychobiology, v. 28, n. 4, p. 239-246, 1995. PMid:7621986. http://dx.doi.org/10.1002/ dev.420280405
PHILLIPS, J. O.; FUCHS, A. F. Gustation and ofaction. In: PATTON, H. et al. Textbook of physiology: excitable cells and neurophysiology. 21st. ed. Philadelphia: Saunders, 1989. v. 1, p. 475-503.
SCHLOSSER, E. What’s in the meat. In: SCHLOSSER, E. Fast food nation: The dark side of the all-american meal. New York: Houghton Mifflin, 2001. cap. 9, p. 193-224.
SCHUMANN, S. P. A.; POLÔNIO, M. L. T.; GONÇALVES, E. C. B. A. Avaliação do consumo de corantes artificiais por lactantes, pré-escolares e escolares. Ciência e Tecnologia de Alimentos, v. 28, n. 3, p. 534-539, 2008. http://dx.doi.org/10.1590/S0101-20612008000300005
SHANKAR, M. U.; LEVITAN, C. A.; SPENCE, C. Grape expectations: The role of cognitive influences in color–flavor interactions. Consciousness and Cognition, v. 19, p. 380-390, 2010. PMid:19828330. http://dx.doi.org/10.1016/j. concog.2009.08.008
SHANKAR, M. U. et al. The influence of color and label on the perceptions of flavor. Chemosensory Perception, v. 2, p. 53-58, 2009. http://dx.doi.org/10.1007/s12078-009-9046-4 flavor (reference). For the color purple, 104 women and 96
men participated, of whom only 12% and 17%, respectively, did not identify the different flavor. The greatest influence of color was in the identification of the strawberry flavor by men, who mistook it for grape flavor (reference). One hundred and nineteen men and 81 women took part in the test of the blue color, of whom 16% and 24.7%, respectively, did not identify the different flavor. Men hadgreater difficulty in identifying samples with grape flavor, mistaking it for tutti-frutti. Pineapple and lime flavors were more easily distinguished from strawberry flavors by both genders.
The green color influenced only males in the identification of the pineapple flavor, which was mistaken for lime (reference). Of the total number of participants in this test, 125 were women and 75 men, of whom only 10.4% and 24%, respectively, had difficulty in distinguishing the flavors.
One hundred and two women and 98 men took part in the test to evaluate the influence of the color yellow, of whom 76.5% and 85.7%, respectively, identified the difference between the flavors. The color yellow exerted a greater influence on the distinction of tutti-frutti flavor for women and grape for men thus being mistaken when compared with the pineapple flavor (reference).
A greater difficulty in identifying flavors which differed from the reference sample was observed when the flavors used were grape, strawberry, and tutti-frutti. This could be due to the characteristic bittersweet qualities of these flavors leading to mistakes when such flavors are presented in unusual color combinations. The exception occurred when using green, which led to mistakes only in the identification of the pineapple flavor, characteristically more acid flavor. Thus, the results showed that color did not significantly influence the identification of flavors although men were more susceptible to influence than women.
4 Conclusions
The present study showed that color did not influence the acceptance of gelatin samples by adults but that flavor did, and that the lime flavor was less accepted than strawberry and pineapple flavors. It was also demonstrated that, although color did not, in general, influence the identification of flavors, men were more influenced than women.
Acknowledgements
Fundação de Amparo à Pesquisa do Estado de Minas Gerais (FAPEMIG) for funding and to everyone who contributed for this research.
References
ALVES, H. J.; BOOG, M. C. F. Comportamento alimentar em moradia estudantil: um espaço para promoção da saúde. Revista de Saúde Pública, v. 41, n. 2, p. 197-204, 2007. http://dx.doi.org/10.1590/ S0034-89102007000200005
VIANA, V. Psicologia, saúde e nutrição: Contributo para o estudo do comportamento alimentar. Análise Psicológica, v. 4, p. 611-624, 2002.
ZAMPINI, M. et al. The multisensory perception of flavor: Assessing the influence of color cues on flavor discrimination responses. Food Quality and Preference, v. 18, n. 7, p. 975-984, 2007. http://dx.doi. org/10.1016/j.foodqual.2007.04.001
STEINER, J. E. et al. Comparative expression of hedonic impact: affective reactions to taste by human infants and other primates.
Neuroscience & Biobehavioral Reviews, v. 25, n. 1, p. 53-74, 2001. http://dx.doi.org/10.1016/S0149-7634(00)00051-8