Food Science and Technology ISSN 0101-2061
DI:
D http://dx.doi.org/10.1590/1678-457X.6463
1 Introduction
Colorants are extensively used by the food industry (Downham & Collins, 2000). There has been an increase in investment in research on new sources of natural pigments for food application due to the importance of the dyes for the acceptance of food and to the toxicology of synthetic dyes, which have been associated to adverse human health effects (Mansour et al., 2007; Williamson, 2008).
Cyanobacteria are photosynthetic prokaryotes phototrophs that produce pigments such as phycobiliproteins (Prasanna et al., 2010). They are water-soluble fluorescent proteins with protein chains covalently bound to chromophore tetrapyrroles groups known as bilins (MacColl, 1998). In algae and cyanobacteria, the phycobiliproteins are components of supramolecular complexes called phycobilisomes, which have physiological function of light harvesting for photosynthesis. In cyanobacteria, there are mainly three phycobiliproteins: phycocyanin and allophycocyanin, which are blue, and the red colored phycoerythrin (Gantt, 1981). Yang et al. (2011) also conducted a study to evaluate the toxicology in vitro and in vivo of Nostoc sp. and Arthrospira (Spirulina) sp. and found that cyanotoxins was not detected in both strains, and in order to demonstrate their safety to humans, the authors carried out a study on animal diet, in which rats were fed a diet
supplemented with 5% of each biomass. The results showed no evidence of toxic effects using these cyanobacteria as a food material source.
Several studies have reported that the cyanobacterium Arthrospira platensis produces phycocyanin as the main pigment, but it also produces allophycocyanin and small amounts of phycoerythrin (Walter et al., 2011; Silva, 2008; Ajayan et al., 2012). Dn the other hand, the presence of phycoerythrin in Arthrospira platensis was not detected according to other studies (Akimoto et al., 2012; Bolychevtseva et al., 2003).
Some cyanobacteria can change the structures responsible for light harvesting and cellular processes according to the wavelength and intensity of light. This phenomenon is described as complementary chromatic adaptation (Kehoe & Gutu, 2006; Walter, 2011). Dur research group has been studying the properties of phycobiliproteins in different microorganisms. Accordingly, we have interest in establishing the cultivation conditions that lead to higher accumulation of phycobiliproteins in the biomass of A. platensis.
The present study aimed to study the growth of A. platensis using different light intensities, irradiance, and wavelength evaluating
Production of phycobiliproteins by
Arthrospira platensis
under different
lightconditions for application in food products
Roberta Ferreira RIZZD1*, Beatriz do Nascimento Corrêia dos SANTDS2,
Gabriela Fernandes Pepe da Silva de CASTRD1, Thaís Souza PASSDS2, Manuela de Abreu NASCIMENTD1,
Hevelyn Dantas GUERRA1, Carla Guidone da SILVA1, Daiana da Silva DIAS1,
Josiane Roberto DDMINGUES1, Kátia Gomes de LIMA-ARAÚJD1
Received 31 July, 2014 Accepted 18 Dec., 2014
1Universidade Federal Fluminense – UFF, Niterói, RJ, Brasil
2Universidade Federal do Rio de Janeiro – UFRJ, Rio de Janeiro, RJ, Brasil
*Corresponding author: robertarizzo@id.uff.br
Abstract
There has been an increase in investment in research on new sources of natural pigments for food application. Some cyanobacteria can change the structures responsible for light harvesting and cellular processes according to the wavelength and light intensity. This phenomenon has been described as complementary chromatic adaptation. The present study aimed to investigate the growth of Arthrospira platensis using different light qualities, irradiance, and wavelength by evaluating the production of biomass, proteins, and phycobiliproteins. The occurrence of the chromatic adaptation phenomenon in this cyanobacterium was also investigated. The microorganism used in this study, A. platensis, was grown in a Zarrouk medium under three irradiance levels, 50, 100, and 150 μmol fotons.m–2.s–1 with illumination provided by white and green fluorescent
lamps. The condition of 150 µmol fotons.m–2.s–1 white light was the one that promoted the highest biomass production of
A. platensis cultures (2115.24 mg.L–1). There was no difference in the production of total protein and total phycobiliproteins
under the studied conditions. It is likely that the large supply of nitrogen in the Zarrouk medium was sufficient for cell growth and maintenance, and it supplied the production of accessory pigments composed of protein. Finally, there was no evidence of the complementary chromatic adaptation phenomenon in A. platensis cultivated under green light. Moreover, this condition did not increase phycocyanin production.
the production of biomass, proteins, and phycobiliproteins. The occurrence of the chromatic adaptation phenomenon in this cyanobacterium was also investigated.
2 Materials and methods
2.1 Microorganism and culture medium
The microorganism used in this study, Arthrospira platensis, was obtained from the Culture Collection of the Laboratory of Physiology and Cultivation of Algae at Universidade Federal Fluminense (UFF). It was inoculated in Zarrouk medium using the composition described by Belay (2008).
2.2 Cultivation conditions
Cultivation was carried out in a 1 L erlenmeyer containing 500 mL of culture (Zarrouk medium and inoculum). The culture medium was previously autoclaved. The initial biomass concentration was standardized as 50 mg.L–1. The cultures
were maintained under agitation induced by insufflation of filtered air, with flow aeration of 0.5 vvm (air volume/medium volume/minute). The temperature was kept at 31 ± 2°C.
To establish the best experimental conditions, a 23 full factorial
design was used totaling 8 runs (8 different culture conditions, performed in triplicate). The cyanobacteria was grown under three levels of irradiance, 50, 100, and 150 μmol fotons.m–2.s–1,
with illumination provided by white and green fluorescent lamps. The irradiance was measured on the surface of the flask using a LI-250A light meter (Nebraska, USA) and a Li-Cor quantum sensor. The pH was measured using a MSTecnopon mPA-210 pHmeter (São Paulo, Brazil).
2.3 Cyanobacteria growth
Under each growth condition the production of biomass was measured using an optical density (DD) at a wavelength of 750 nm, compared to a calibration curve. For the determination of biomass, cells in 10 mL of culture were centrifuged at 6797 × g for 30 minutes at 5°C using an Eppendorf 5403 centrifuge (Wesseling, Germany). The medium was removed and the biomass was washed with distilled water. The original volume was re-established for DD analysis. Biomass production was evaluated every 3 days after inoculation. Specific growth rate was determined based on a modeling approach considering the logarithm of cell concentration versus time of growth, as described by Baranyi & Roberts (1994), using the DMFit Excel add-in software, version 3.0 (Washington, USA) (http://www. ifr.ac software.uk/safety/dmfit/). Productivity was calculated using the following Equation 1:
( )
= Bi – B0
P
Ti (1)
where: P = productivity (mg.L–1.day–1), B
0 = initial biomass
density (mg.L–1), B
i = biomass density at time i (mg.L –1), and
Ti = time interval (day) between B0 and Bi (Colla et al., 2007).
2.4 Determination of total protein
The nitrogen concentration in the biomass obtained under the different culture conditions was determined by the Kjeldahl method (Instituto Adolfo Lutz, 2008); nitrogen was converted
into protein using the factor 6.5. The results were expressed in mg% protein in the biomass.
2.5 Estimative of phycobiliprotein concentration
Under each growth condition, biomass samples were collected for phycobiliprotein extraction. The biomass samples were subjected to two cycles of freezing and thawing. The samples were centrifuged at 6082 × g for 20 minutes at 25 °C using a Sigma 3K30 centrifuge (Göttingen, Germany). The extraction process was repeated twice. The extract was filtered through qualitative filter paper. The absorbances at the wavelength of maximum absorption of 565 nm (phycoerythrin), 620 nm (phycocyanin), and 650 nm (allophycocyanin) were measured using a spectrophotometer. The concentration values were estimated using the Bryant chromatic equations (Equations 2 to 4), as described by Chapman & Kremer (1988).
(
1)
{
A620(
0.72 x A650)
}
Phycocyanin CPC; mg.mL
6.29
−
− = (2)
(
1)
{
A650(
0.191 x A620)
}
Allophycocyanin CAPC; mg.mL
5.79
−
− = (3)
(
1)
{
A565(
(2.41 x CPC) ( 1.41 x CAPC))
}
Phycoerythrin mg.mL
13.02
− −
− = (4)
Additionally the UV-visible spectrum (200-750 nm) was obtained to characterize the phycobiliprotein extract profile. The readings were performed on an UV 2600 Shimadzu spectrophotometer (Kyoto, Japan). The concentration of phycobiliproteins in the biomass was expressed in mg%.
2.6 Statistical analysis
The significant difference between the production of biomass, protein, and phycobiliproteins under the different culture conditions were determined by one-way ANDVA and the Tukey’s test using the GraphPad Prism software version 5.0 (California, USA). Values were considered statistically significant when p < 0.05.
3 Results and discussion
3.1 Arthrospira platensis growth under different cultivation conditions
Figure 2 shows biomass production after 18 days for all studied conditions, and Table 1 shows the experimental design average results for specific growth rate and productivity.
Biomass production at irradiance of 150 μmol fotons.m–2.s–1 under
white light promoted the highest growth (2115.24 mg.L–1)
and productivity (103.99 mg.L–1.day–1) of A. platensis. The
smallest biomass production and productivity were obtained in the cultivation under green light irradiance of 50 μmol fotons.m–2.s–1 (772.87 mg.L–1 and 40,16 mg.L–1.day-1, respectively).
As for specific growth rate, the highest irradiance promoted de highest growth rates, regardless of light quality (150V: 0.33.day–1;
150B: 0.32.day–1). Ravelonandro et al. (2008) reported that green
light was better for accumulation of A. platensis biomass than the other light qualities studied (white, red, and blue). However, the results obtained in the present study are quite different; they indicate that white light promotes more biomass accumulation than green light. Ravelonandro et al. (2008) reported that the cell growth interruption could be attributed to inhibition due to high pH values (above 11). Productivity and cell concentration had the maximum values at the highest values of irradiance (1200 lux~17 μmol fotons.m–2.s–1). In the present study, the pH
was 10.7 ± 0.2; therefore, it is likely that possibly the cell growth was interrupted due to substrate exhaustion.
Some authors reported that the growth rate of cyanobacteria is directly proportional to light intensity until saturation levels (Wang et al., 2007; Rangel-Yagui et al., 2004; Danesi et al., 2004; Ravelonandro et al., 2008). Ravelonandro et al. (2008), demonstrated that the highest irradiance under different light qualities promoted greater biomass production of A. platensis, and that green light under higher irradiance (1.200 lux ~ 17 μmol fotons.m–2.s–1) was the best condition for biomass production.
The results obtained in the present study reveal that the condition of 50 μmol fotons.m–2.s–1, under white light, promoted biomass
production 13.5% higher than that obtained at the same irradiance under green light. At 100 μmol fotons.m–2.s–1 under white light,
the biomass production was 18.0% higher than that obtained under green light. At 150 μmol fotons.m–2.s–1 under white light,
biomass accumulation was 51.0% higher than that at 150 μmol fotons.m–2.s–1 under green light.
The highest specific growth rates of A. platensis were observed in the cultures grown under 150 μmol fotons.m–2.s–1, provided by
white light and green light, being, respectively, 0.32 log biomass mg.L–1.day–1 and 0.33 log biomass mg.L–1.day–1.
The initial pH of the Zarrouk medium was approximately 9.5 and kept 10.7 ± 0.2 during growth under all conditions studied. According to Richmond (1988), a pH of 11.0 is a limiting factor for growth of Spirulina. In the current study, a pH equal to or greater than 11.0 was not observed under the conditions studied. Ciferri (1983), reported that Spirulina cultures showed an extensive pH optimum range (8 to 11), but the growth was also observed at pH values near 7 and as high as 11.3.
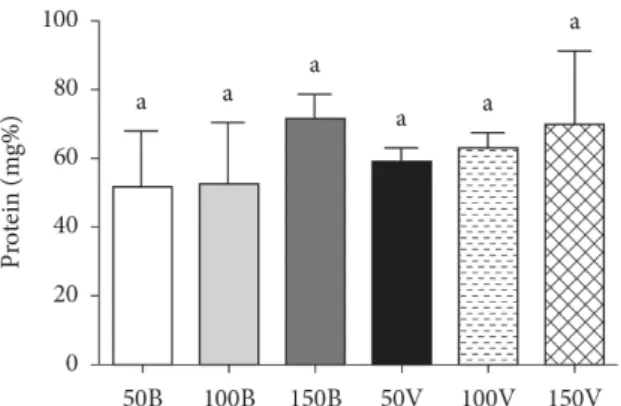
3.2 Total protein content
Total protein content after 18 days of growth under all conditions studied showed no statistical significant difference (Figure 3). According to Belay et al. (1993), Spirulina has a high protein content, equivalent to 60-70% of the total mass. The values found in the present study ranged from 53 to 79% under the conditions evaluated.
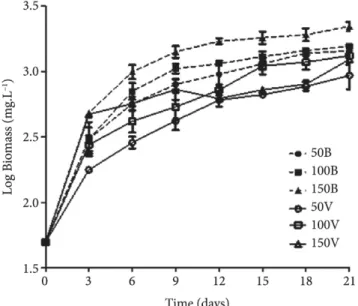
Figure 1. Growth curve of A. platensis under different culture conditions.
Growth under white light (dashed lines): 50 μmol fotons.m–2.s–1 (50B),
100 μmol fotons.m–2.s–1 (100B), and 150 μmol fotons.m–2.s–1 (150B);
growth under green light (solid lines): 50 μmol fotons.m–2.s–1 (50V),
100 μmol fotons.m–2.s–1 (100V), and 150 μmol fotons.m–2.s–1 (150V).
Figure 2. Biomass production at the growth time of 18 days under all
conditions studied. Same letters mean no significant difference (p < 0.05). The numbers represent the irradiance values in μmol fotons.m–2.s–1. B:
represents white light and V: represents green light.
Table 1. Experimental cultivation conditions, specific growth rate, and
productivity of A. platensis. Experimental
condition
Specific growth (μmax.day–1)
Productivity (mg.L–1.
day–1)
50B 0.18 74.10
100B 0.20 77.76
150B 0.32 103.99
50V 0.10 40.16
100V 0.12 63.24
Mary Leema et al. (2010) showed that the protein content of the A. platensis grown under white light in Zarrouk medium was higher than that in the other media studied. The protein content in the Zarrouk medium was 71.16%, while in diluted seawater it was 65.20% (2 part seawater:1 part freshwater, v/v) and 66.96% (2 part freshwater:1 part seawater, v/v), and in undiluted seawater it was 59.87% (Mary Leema et al., 2010).
Zarrouk medium without modifications was the medium used in the present study. This is the most widely used medium in the cultivate A. platensis since it promotes larger production of important metabolites; besides, it is a medium with high nitrogen content. The composition of cyanobacterial biomass is affected by nitrogen nutrition, and crude protein content and biomass appears to be related to the nitrogen available in the medium. Variation of the nitrogen content in the culture medium has showed that protein concentration in cyanobacterial biomass increases to a certain extent with increasing nitrogen content (Markou & Georgakakis, 2011).
Dliveira et al. (1999), observed the accumulation of protein in cultivations under different temperatures (31 ± 2 ºC), and the protein content in S. platensis was 64.35%, which is in the same range of the values found in the present study. Another study showed a higher content of protein in biomass cultivated under white and green light- emitting diode (LED) compared with that obtained under blue, yellow, red, and pink LED (Markou, 2014). Ravelonandro et al. (2008), found a protein content value of 58% in S. platensis after 10 days of growth under green light at irradiance 1200 lux (~17 μmol fotons.m–2.s–1). In
the present study, the protein content obtained was 59% after 18 days of growth under green light at irradiance of 50 μmol fotons.m–2.s–1 green light.
Although the conditions of cultivation under green light showed the lowest biomass production, the quality of light for all irradiance values did not change protein production by A. platensis significantly. This possibly occurred due to the large amount of nitrogen in the medium since some studies conducted by our research group (Castro et al., 2015) demonstrated that the concentration of sodium nitrate (nitrogen source) in the Zarrouk medium is very high. Colla et al. (2007), showed that at
a temperature close to that used in the present study (30°C), the absorption of nitrogen appears to be limited, once experiments with higher concentrations of sodium nitrate (1.875 and 2.500 g.L–1)
showed no increase in the level of protein. In the current study, the content of sodium nitrate was 2.5 g.L–1, which can probably
confirm the maintenance of the protein content under the conditions at which growth rate was lower. The low cell growth rate did not divert the nitrogen route to growth only since the protein content was not statistically different under the conditions that led to higher biomass production.
It is likely that the large supply of nitrogen promoted by the Zarrouk medium did not make the bacterium divert their sources to growth or production of other protein metabolites.
3.3 Phycobiliproteins production
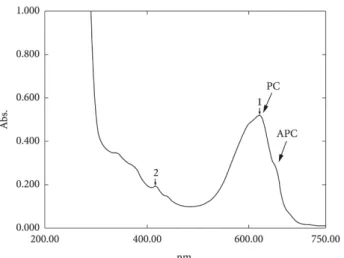
The spectra of the extracts did not reveal the characteristic phycoerythrin peak in the range of 565 nm (Figure 4). As the spectrum scan does not confirm the presence of phycoerythrin, its production by the A. platensis strain used in the present study can not be confirmed. Based on these results obtained, it was observed only the production of phycocyanin and alophycocyanin by A. platensis under different irradiance conditions and light quality. As can be seen in the spectrum shown in Figure 4, there are blue pigments in the aqueous extract.
Figure 5 shows the total phycobiliprotein concentrations, which are the sum of the phycocyanin and allophycocyanin contents determined in the biomass recovered after 18 days of growth. Figure 6 shows, separately, the phycocyanin contents accumulated in the biomass after 18 days of cultivation. The total phycobiliprotein and phycocyanin contents after 18 days of growth showed no significant difference under all conditions studied. Markou (2014), found about 11% of phycocyanin in cultures grown under green light, and quantities above 10% in cultures grown under white light; values greater than those found under yellow (10%), red (9%), and pink (8.2%) light. Chen et al. (2010), studied different qualities of light (red, green, yellow, white, and blue) and reported that the greatest accumulation of phycocyanin was observed under green light at irradiance of 1.500 μmol fotons.m–2.s–1. In the present study,
it was observed an inverse corrrelation to that reported in the study conducted by Chen et al. (2010), which showed higher production of phycocyanin under white light than under green light.
Although some conditions promoted low biomass production, it was observed that total protein and phycobiliproteins contents did not change in the biomass obtained under different conditions. Thus, the high levels of nitrogen in the Zarrouk medium provided not only the maintenance of protein accumulation under conditions of lower growth, but also the maintenance of the phycobiliprotein proportion. In a study with nitrogen starvation in an Anacystis nidulans cultivation, it was observed that the total content of phycocyanin decreased, suggesting that the loss of phycocyanin is a characteristic of nitrogen deficiency. Such behavior was reversed by the addition of nitrate, which resulted in the recovery of pigmentation over a period of 8 hours.
Figure 3. Total protein content after 18 days of growth under all
Cell division did not begin until normal levels of phycocyanin had been restored (Allen & Smith, 1969).
4 Conclusion
It was verified that white light promoted higher biomass production than green light. The condition of 150 µmol fotons.m–2.s–1 under white light was the one that promoted the
highest growth rate of A. platensis, leading to the highest biomass production. There was no statistically significant difference in the production of total protein, total phycobiliproteins, and phycocyanin in the studied conditions. It is likely that the large supply of nitrogen promoted by the Zarrouk medium did not make the bacterium divert their sources to growth or production of other protein metabolites. Finally, there was no evidence the occurrence of the of complementary chromatic adaptation phenomenon in the strain of A. platensis cultivated under green light. The results obtained showed that there was no evidence of the presence of phycoerythrin in this cyanobacteria biomass, and the green light did not promote an increase in the phycocyanin production. These results demonstrate the potential of production of natural pigments for food application.
Acknowledgements
The authors acknowledge the Masters scholarship granted by CAPES (Coordination for the Improvement of Higher Education Personnel).
References
Ajayan, K. V., Selvaraju, M., & Thirugnanamoorthy, K. (2012). Enrichment of chlorophyll and phycobiliproteins in Spirulina platensis by the use of reflector light and nitrogen sources: An in-vitro study.
Biomass and Bioenergy, 47, 436-441. http://dx.doi.org/10.1016/j. biombioe.2012.09.012.
Akimoto, S., Yokono, M., Hamada, F., Teshigahara, A., Aikawa, S., & Kondo, A. (2012). Adaptation of light-harvesting systems of Arthrospira platensis to light conditions, probed by time-resolved fluorescence spectroscopy. Biochimica et Biophysica Acta, 1817(8), 1483-1489. http://dx.doi.org/10.1016/j.bbabio.2012.01.006. PMid:22285745 Allen, M. M., & Smith, A. J. (1969). Nitrogen chlorosis in blue-green
algae. Archiv fur Mikrobiologie, 69(2), 114-120. http://dx.doi. org/10.1007/BF00409755. PMid:4986616
Baranyi, J., & Roberts, T. A. (1994). A dynamic approach to predicting bacterial growth in food. International Journal of Food Microbiology,
23(3-4), 277-294. http://dx.doi.org/10.1016/0168-1605(94)90157-0. PMid:7873331
Belay, A. (2008). Spirulina platensis (Arthrospira): production and quality assurance. In: M. E. Gershwin & A. Belay (Eds.), Spirulina in human nutrition and health (pp. 2-23). Portland: Taylor & Francis. Belay, A., Dta, Y., Miyakawa, K., & Shimamatsu, H. (1993). Current
knowledge on potential health benefits of Spirulina.Journal of Applied Phycology, 5(2), 235-241. http://dx.doi.org/10.1007/BF00004024. Bolychevtseva, IuV., Mazhorova, L. E., Terekhova, I. V., Egorova, E. A.,
Shugaev, A. G., Rakhimberdieva, M. G., & Karapetian, N. V. (2003). [A new type of adaptation of the cyanobacterium Spirulina platensis to illumination conditions]. Prikladnaia biokhimiia i mikrobiologiia,
39(5), 571-576. PMid:14593872.
Figure 4. UV-visible Spectrum of the phycobiliproteins extract of
Arthrospira platensis; the arrows indicate the characteristic phycocyanin peak (PC) and the allophycocyanin (APC) on the shoulder of the PC peak.
Figure 5. Total phycobiliprotein content after 18 days under all
cultivation conditions studied. Same letters mean no significant difference (p < 0.05). The numbers represent the irradiance values in μmol fotons.m–2.s–1. B: represents white light and V: represents green light.
Figure 6. Phycocyanin content after 18 days under all cultivation
Castro, G. F. P. S., Rizzo, R. F., Passos, T. S., Santos, B. N. C., Dias, D. S., Domingues, J. R., & Lima-Araújo, K. G. (2015). Biomass production by Arthrospira platensis in different culture conditions. Food Science and Technology. In press.
Chapman, D. J., & Kremer, B. P. (1988). Experimental phycology: a laboratory manual. Cambridge: Cambridge University Press. Chen, H., Wu, J., Wang, C., Fu, C., Shieh, C., Chen, C., Wang, C., & Liu,
Y. (2010). Modeling on chlorophyll a and phycocyanin production by
Spirulina platensis under various light-emitting diodes. Biochemical Engineering Journal, 53(1), 52-56. http://dx.doi.org/10.1016/j. bej.2010.09.004.
Ciferri, D. (1983). Spirulina, the edible microorganism. Microbiological Reviews, 47(4), 551-578. PMid:6420655.
Colla, L. M., Dliveira Reinehr, C., Reichert, C., & Costa, J. A. V. (2007). Production of biomass and nutraceutical compounds by Spirulina platensis under different temperature and nitrogen regimes.
Bioresource Technology, 98(7), 1489-1493. http://dx.doi.org/10.1016/j. biortech.2005.09.030. PMid:17070035
Danesi, E. D. G., Rangel-Yagui, C. D., Carvalho, J. C. M., & Sato, S. (2004). Effect of reducing the light intensity on the growth and production of chlorophyll by Spirulina platensis.Biomass and Bioenergy, 26(4), 329-335. http://dx.doi.org/10.1016/S0961-9534(03)00127-2. Downham, A., & Collins, P. (2000). Colouring our foods in the last and
next millennium. International Journal of Food Science & Technology,
35(1), 5-22. http://dx.doi.org/10.1046/j.1365-2621.2000.00373.x. Gantt, E. (1981). Phycobilisomes. Annual Review of Plant Physiology, 32(1),
327-347. http://dx.doi.org/10.1146/annurev.pp.32.060181.001551. Instituto Adolfo Lutz. (2008). Métodos físico-químicos para análise de
alimentos (1st ed.). São Paulo: Instituto Adolfo Lutz. Retrieved from http://www.crq4.org.br/sms/files/file/analisedealimentosial_2008.pdf. Kehoe, D. M., & Gutu, A. (2006). Responding to color: the regulation
of complementary chromatic adaptation. Annual Review of
Plant Biology, 57(1), 127-150. http://dx.doi.org/10.1146/annurev. arplant.57.032905.105215. PMid:16669758
MacColl, R. (1998). Cyanobacterial phycobilisomes. Journal of Structural Biology, 124(2-3), 311-334. http://dx.doi.org/10.1006/jsbi.1998.4062. PMid:10049814
Mansour, A. F., Ahmed, R. M., Bassyouni, A. H., & Nasr, G. M. (2007). Dptical spectroscopic studies of perylene dye doped in copolymer of ST/MMA as solar collector. International Journal of Polymeric Materials,
56(6), 651-662. http://dx.doi.org/10.1080/00914030601098652. Markou, G. (2014). Effect of various colors of light-emitting diodes
(LEDs) on the biomass composition of Arthrospira platensis cultivated in semi-continuous mode. Applied Biochemistry and Biotechnology,
172(5), 2758-2768. http://dx.doi.org/10.1007/s12010-014-0727-3. PMid:24435766
Markou, G., & Georgakakis, D. (2011). Cultivation of filamentous cyanobacteria (blue-green algae) in agro-industrial wastes and wastewaters: a review. Applied Energy, 88(10), 3389-3401. http:// dx.doi.org/10.1016/j.apenergy.2010.12.042.
Mary Leema, J. T., Kirubagaran, R., Vinithkumar, N. V., Dheenan, P. S., & Karthikayulu, S. (2010). High value pigment production from
Arthrospira (Spirulina) platensis cultured in seawater. Bioresource Technology, 101(23), 9221-9227. http://dx.doi.org/10.1016/j. biortech.2010.06.120. PMid:20655201
Dliveira, M. A. C. L., Monteiro, M. P. C., Robbs, P. G., & Leite, S. G. F. (1999). Growth and chemical composition of Spirulina maxima and
Spirulina platensis biomass at different temperatures. Aquaculture International, 7(4), 261-275. http://dx.doi.org/10.1023/A:1009233230706. Prasanna, R., Sood, A., Jaiswal, P., Nayak, S., Gupta, V., Chaudhary,
V., Joshi, M., & Natarajan, C. (2010). Rediscovering cyanobacteria as valuable sources of bioactive compounds [Review]. Applied Biochemistry and Microbiology, 46(2), 119-134. http://dx.doi. org/10.1134/S0003683810020018.
Rangel-Yagui, C. D., Danesi, E. D. G., de Carvalho, J. C., & Sato, S. (2004). Chlorophyll production from Spirulina platensis: cultivation with urea addition by fed-batch process. Bioresource Technology,
92(2), 133-141. http://dx.doi.org/10.1016/j.biortech.2003.09.002. PMid:14693445
Ravelonandro, H. P., Ratianarivo, D. H., Joannis-Cassan, C., Isambert, A., & Raherimandimby, M. (2008). Influence of light quality and intensity in the cultivation of Spirulina platensis from Toliara (Madagascar) in a closed system. Journal of Chemical Technology and Biotechnology, 83(6), 842-848. http://dx.doi.org/10.1002/jctb.1878. Richmond, A. (1988). Spirulina. In: M. A. Borowitzka & L. J. Borowitzka (Eds), Micro-algal Biotechnology (pp. 85-121). Cambridge: Cambridge University Press.
Silva, L. A. (2008), Estudo do processo biotecnológico de produção, extração e recuperação do pigmento ficocianina da Spirulina platensis
(Dissertação de mestrado). Departamento de Engenharia Química, Setor de Engenharia, Universidade Federal do Paraná. Curitiba. Walter, A. (2011). Estudo do processo biotecnológico para obtenção de
ficocianina a partir da microalga Spirulina Platensis sob diferentes condições de cultivo (Dissertação de mestrado). Departamento de Engenharia Química, Setor de Engenharia, Universidade Federal do Paraná, Curitiba.
Walter, A., Carvalho, J. C., Soccol, V. T., Faria, A. B. B., Ghiggi, V., & Soccol, C. R. (2011). Study of phycocyanin production from Spirulina platensis under different light spectra. Brazilian Archives of Biology and Technology, 54(4), 675-682. http://dx.doi.org/10.1590/S1516-89132011000400005.
Wang, C., Fu, C., & Liu, Y. (2007). Effects of using light-emitting diodes on the cultivation of Spirulina platensis.Biochemical Engineering Journal, 37(1), 21-25. http://dx.doi.org/10.1016/j.bej.2007.03.004. Williamson, C. S. (2008). Food additives and hyperactivity in children.
Nutrition Bulletin, 33(1), 4-7. http://dx.doi.org/10.1111/j.1467-3010.2007.00679.x.
Yang, Y., Park, Y., Cassada, D. A., Snow, D. D., Rogers, D. G., & Lee, J. (2011). In vitro and in vivo safety assessment of edible blue-green algae, Nostoc commune var. sphaeroides Kützing and Spirulina plantensis. Food and chemical toxicology : an international journal published for the British Industrial Biological Research Association,