Infrared thermography as a method for evaluating the heat tolerance in dairy
cows
Darlene dos Santos Daltro1*, Vivian Fischer2, Evelyn Priscila München Alfonzo1, Vanessa Calderaro Dalcin1, Marcelo Tempel Stumpf3, Giovani Jacob Kolling1, Marcos
Vinícius Gualberto Barbosa da Silva4, Concepta McManus5
1 Universidade Federal do Rio Grande do Sul, Programa de Pós-graduação em Zootecnia, Porto Alegre, RS, Brazil. 2 Universidade Federal do Rio Grande do Sul, Departamento de Zootecnia, Porto Alegre, RS, Brazil.
3 Universidade Federal do Rio Grande, São Lourenço do Sul, RS, Brazil. 4 Embrapa Gado de Leite, Juiz de Fora, MG, Brazil.
5 Universidade de Brasília, Brasília, DF, Brazil.
ABSTRACT - The objective of this study was to determine whether infrared thermography is a useful tool for the recognition of dairy cows in a state of thermal heat stress, as well as to identify the best region of the animal to be evaluated for this recognition. Physiological variables, including rectal temperature, respiratory frequency, cardiac frequency, and panting score were recorded in 38 lactating cows. For the assessment of environmental parameters, a digital black globe thermometer (TGD-200 model) was used. Thermographic photographs of different regions of the body of cows were taken using an infrared camera (FLIR® System T300) and indicated respective superficial temperature. Physiological variables and superficial body
temperature in different regions varied between genetic groups (Girolando: ½ Holstein × ½ Gir and ¾ Holstein × ¼ Gir; purebred Holstein). The environmental temperature ranged from 20.7 to 37.9 °C with a relative humidity reaching 95%. The mean rectal temperature (40.84 °C), respiratory frequency (111.36 breaths/min), and cardiac frequency (99.22 beats/min) were higher for pure Holstein than for Girolando cows. Positive correlations were found between the physiological parameters and thermographic measures. The highest positive correlation (0.74) was found between the temperature in the lateral region of the udder and rectal temperature. Thermography is a good indicator of thermal comfort. The best region to identify heat stress in cows using thermography is the lateral region of the udder.
Key Words: animal welfare, dairy cattle, thermal comfort, thermographic images © 2017 Sociedade Brasileira de Zootecnia
ISSN 1806-9290 www.sbz.org.br
R. Bras. Zootec., 46(5):374-383, 2017
Received: May 2, 2016
Accepted: January 26, 2017
*Corresponding author: [email protected] http://dx.doi.org/10.1590/S1806-92902017000500002
How to cite: Daltro, D. S.; Fischer, V.; Alfonzo, E. P. M.; Dalcin, V. C.; Stumpf, M. T.; Kolling, G. J.; Silva, M. V. G. B. and McManus, C. 2017. Infrared thermography as a method for evaluating the heat tolerance in dairy cows. Revista Brasileira de Zootecnia 46(5):374-383.
Copyright © 2017 Sociedade Brasileira de Zootecnia. This is an Open Access article distributed under the terms of the Creative Commons Attribution License (http://creativecommons.org/licenses/by/4.0/), which permits unrestricted use, distribution, and reproduction in any medium, provided the original work is properly cited.
Introduction
Brazil has about two thirds of its territory located in the tropical region of the planet, where high air temperatures predominate, due to high solar radiation (Cruz et al., 2011), which can cause heat stress in livestock. Stressful environmental conditions become a limiting factor for animal production in the tropics as the thermal environment has a direct effect on the efficiency of the production system, as well as on animal health and welfare (Paim et al., 2013). The optimal ambient temperature for dairy production depends on the species, breed, age, feed intake,
acclimatization, yield levels, hair and coat characteristics, as well as the animal tolerance to heat and cold (Almeida et al., 2011). Establishing an economically viable system in a given region requires the choice of breeds or varieties that are suited to local environmental conditions (McManus et al., 2011). High-yielding dairy cows are more sensitive to heat stress because, as milk production increases, cows produce more metabolic heat (Vasconcelos and Demetrio, 2011).
It is a useful tool to evaluate the thermal stress of the animals (Moura et al., 2011) because it detects changes in blood flow (Stewart et al., 2005) and minimal variations in body temperature (Knížková et al., 2007). Non-invasive measurement techniques and sampling at distance should be studied to improve animal welfare (Stewart et al., 2008).
The objective of this study was to determine if infrared thermography could be used in the recognition of heat-stressed dairy cows, as well as to determine the best area of the animal that can be used for this recognition.
Material and Methods
The experiment was approved by the Ethics Committee on Animal Use (CEUA), case no. 22773/2012. The research was conducted in Coronel Pacheco, Minas Gerais, Brazil (21°33'23"S latitude, 43°6'15"W longitude, and 430 m altitude). The climate is classified according to Köppen as Cwa (mesothermal), alternating between dry (May-October) and rainy (November-April), with average temperatures of 22 °C in the summer and 16.8 °C in the winter.
Thirty-eight lactating cows were used, 19 purebred Holstein (HO), with average of 249.15±68.19 days in milk and 14.80±2.59 L day−1 milk production; 19 Girolando cows:
eight ½ Holstein × ½ Gir (½ HO), with average 95±72.33 days in milk and 12.4±3.7 L day−1 milk production; and 11
¾ Holstein × ¼ Gir (¾ HO), with average 169.3±95.85 days in milk and 15.5±3.8 L day−1 milk production. There were no
significant differences between the genetic groups for mean milk yield. Data collection for each breed was performed on three consecutive days, with the same experimental procedures for the different breeds. Holstein and Girolando (½ and ¾ HO) cows were analyzed in separate locations and periods but within the same experimental station, with distance between Girolando and Holstein cows of about 1.5 km.
The study consisted of inducing heat stress by exposing cows to a non-shaded environment (with water and fresh feed ad libitum) between morning and evening milking activities. Housing and feeding techniques were not altered or established by authors, with the exception of heat stress induction. During experimental procedures, temperature varied from 21 to 34 °C (average of 26.61 °C) and relative humidity ranged from 56 to 95% (average of 77.55%) for ¾ HO and ½ HO. For purebred Holstein cows, the same parameters ranged from 22 to 35 °C (average of 28.3 °C) and from 52 to 95% (average of 76.68%), respectively.
Rectal temperature (RT; °C) was measured using a clinical veterinary thermometer inserted in the rectum wall of the animal at a depth of approximately 30 cm during
3 min. Respiratory frequency (RF), expressed in number of breaths per minute, was measured using a stethoscope and stopwatch upon auscultation of respiratory movements for 30 s and the value obtained multiplied by two to obtain this variable in minutes. The cardiac frequency, expressed in number of beats per minute, was measured using a stethoscope and a stopwatch for 30 s and multiplying the result by two to obtain this variable in minutes. The painting score was attributed using a 0-to-4 scale (Mader et al., 2006). Heat tolerance (HT), an index combining respiratory frequency and rectal temperature, in which high values are worst, was calculated according to Benezra (1954):
HT = (RT/38.3) + (RF/23.0)
Ambient temperature (°C), relative humidity (RH; %), dry bulb temperature (DBT), and wet bulb temperature were assessed hourly during physiological data collection with the use of a digital globe thermometer model TGD-200. Temperature-humidity index (THI) was calculated according to Johnson et al. (1962):
THI = (1.8 × DBT + 32) − [(0.55 − 0.0055 × RH) × (1.8 × DBT − 26.8)]
Black globe-humidity index (BGHI) was calculated according to Buffington et al. (1981), in which black globe temperature (BGT) was obtained by the black globe thermometer, which indicates the combined defects of radiant energy, temperature, and air velocity. To calculate the DBT (dry bulb temperature, °C), GRAPSI software 6.0 (Melo et al., 2004) was used:
BGHI = BGT + (0.36 × DBT) + 41.5
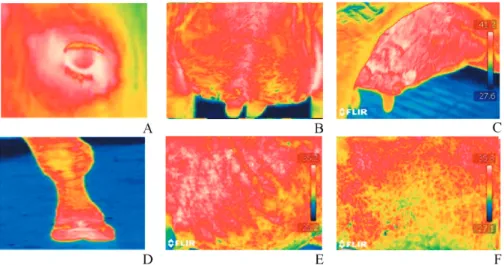
Thermographic images were obtained after physiological data collection with the use of an infrared camera (FLIR® System T300), with emissivity coefficient
equal to 0.98. Prior to the image collection, animals were led to a shaded area to avoid interference of solar radiation and photos were taken immediately. Six photos of each animal were taken: at the right area of the animal (right-area), left area (left-area), eye (eye), lateral region of the udder (lat-udder), posterior region of the udder (post-(lat-udder), and right forelimb region in posterior foot (foot) (Figure 1). Pictures were taken at a distance of approximately 1.5 m from the animal, in the same area of each region evaluated, using the same distance and without the incidence of solar radiation. QuickReport® software was used to analyze data from the
photos. The maximum temperature (°C) within the area of the medial posterior palpebral border of lower eyelid and the lacrimal caruncle was measured in accordance with Stewart et al. (2008). The experimental design was completely randomized factorial with repeated measures.
respiratory frequency, and cardiac frequency. All statistical procedures were performed using SAS software (Statistical Analysis System, version 9.3). Statistical analysis included analysis of variance (PROC GLM) to determine differences between genetic groups and interaction between genetic groups and period for physiological characteristics; stepwise multivariate regression (PROC REG) was used to test suitability of infrared thermography to estimate the changes in physiological variables; broken line regressions (PROC NLIN) was used to verify the inflexion point between environmental indexes and physiological traits within genetic groups; variable selection for discriminant analysis (PROC STEPDISC) to generate the correlation coefficients between the physiological parameters and measurements with infrared thermography in both periods of the experiment; canonical analysis (PROC CANDISC) and principal factor analysis (PROC FACTOR) were performed to determine the association between ambient temperature, relative humidity, physiological measurements, and thermographic temperatures. Data about physiological parameters, environmental indices, and infrared thermography were separated by genetic groups and period of the day (morning and afternoon).
The statistical model used for analysis of variance was: yijk = µ + αi + ßj + γij + δ1 (x − x¯ ) + δ2 (x − x¯ )2 + eijk,
in which yijk =observation made on a cow k classified
according to genetic group i on each period k; µ = overall mean; αi = effect of genetic group (n = 3); ßj =effect of the
day of measurement (n = 3); γij = effect of the interaction
between genetic group and day; x = black globe heat index;
x¯ = mean black globe heat index; δ1 and δ2 = regression
coefficients for BGHI and BGHI2; and e
ijk = random error
associated with each observation.
The model used for the broken regression line was:
yi=
β
0+β
1xi1+β
2(x
i1 − x)δi + εi,in which: δi = 1 if xi1 > x and 0 if xi1 < x, in which y is the
dependent variable, x is the independent variable; and β is the regression coefficient.
The statistical model for the assessment of genetic groups concerning the physiological variables and measurements obtained by infrared thermography was:
yijkl = µ + αi + βj + (α×β)ij + γk + (α×γ)ik + eijkl
in which: yijkl = observation made on a cow k classified
according to genetic group i on each period k; µ = overall mean; αi = effect of genetic group; βj = period (morning or afternoon); (α×β)ij =interaction between genetic group
and period; γk = effect of day of measurement; (α×γ)ik =
interaction between genetic group and day; and eijkl =
random error associated with each observation.
Results
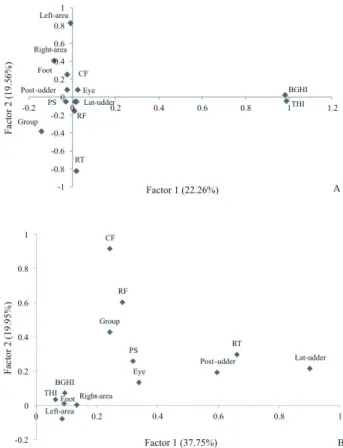
Environmental temperatures observed in this study ranged from 20.7 to 37.9 °C; relative humidity, from 52% to 95%; THI, from 69.20 to 87.70; and BGHI, from 69.20 to 89.69 (Table 1). The mean values of cardiac frequency, respiratory frequency, and rectal temperature varied significantly (P<0.001) within the groups between the days and shifts in which they were observed (Table 2). Within the genetic groups, there were significant differences between the morning and afternoon periods within the day, with the afternoons being predominantly hotter than the mornings. In the morning, Holstein cows obtained higher mean values for rectal temperature and respiratory frequency, but lower cardiac frequency in the morning than ½ HO and ¾ HO. In the afternoon, ½ HO cows had the lowest mean values
Eye (A); posterior region of the udder (B); lateral region of the udder (C); right forelimb region in posterior foot (D); left area (E); and right area (F).
for the physiological characteristics. The animals ¾ HO and HO showed similar average values for the rectal temperature and respiratory and cardiac frequencies in the afternoon. Holstein animals presented higher means for most of the physiological parameters in the two morning and afternoon periods.
Thermographic measurements showed positive correlations ranging from low to moderate (P<0.01)
with BGHI and heat tolerance in the afternoon (Table 3). Significant or tendencies of positive low correlations were found between BGHI and eye (P<0.01; r = 0.25), left-area (P<0.01; r = 0.26), and post-udder (P<0.05; r = 0.22). There were tendencies of moderate positive correlations between heat tolerance and eye (P<0.01; r = 0.44), lat-udder (P<0.01; r = 0.58), and post-udder (P<0.01; r = 0.49). The physiological parameters (rectal temperature, respiratory
Morning Afternoon
½ HO ¾ HO HO ½ HO ¾ HO HO
Rectal temperature (°C) 38.24b 37.97b 38.83a 40.03b 40.72a 40.84a
Respiratory frequency (breaths/min) 35.50c 44.66b 50.66a 77.00b 107.60a 111.36a
Cardiac frequency (beaths/min) 59.17ab 62.26a 56.84b 69.16b 89.46a 99.22a
HO - purebred Holstein cows; ½ HO - ½ Holstein × ½ Gir; ¾ HO - ¾ Holstein × ¼ Gir.
Values followed by the same letter in the row and period are not significantly different in the test at 5% probability.
Table 2 - Average of physiological parameters of dairy cows of three genetic groups depending on time of day
THI BGHI HT RT RF CF PS
Eye 0.15 0.25** 0.44** 0.57** 0.43** 0.31** 0.37**
Right-area 0.09 0.12 0.16 0.23* 0.17 0.04 0.14
Left-area 0.24 0.26** –0.01 0.12 –0.02 –0.09 –0.07
Lat-udder 0.09 0.22 0.58** 0.74** 0.57** 0.47** 0.54**
Post-udder 0.16 0.18* 0.49** 0.69** 0.50** 0.37** 0.41**
Foot 0.02 –0.12 –0.01 0.05 –0.00 –0.01 –0.10
THI - temperature-humidity index; BGHI - black globe-humidity index; HT - heat tolerance; RT - rectal temperature; RF - respiratory frequency; CF - cardiac frequency; PS - panting score.
Eye - temperature of the eye measured with infrared thermography; right-area - right area of the animal measured with infrared thermography; left-area - left area measured with infrared thermography; lat-udder - lateral region of the udder measured with infrared thermography; post-udder - posterior region of the udder measured with infrared thermography; foot - right forelimb region in posterior foot measured with infrared thermography.
* P<0.05. ** P<0.01.
Table 3 - Pearson correlations between physiological parameters and measurements with infrared thermography of the animals in the afternoon
Equation R2
Rectal temperature = –26.07144 + 0.2953 × Lat-udder + 0.4493 × Post-udder + 1.93529 × Left-area − 0.02370 × Left-area2 − 0.06529 × Foot 0.70 Respiratory frequency = –731.14083 + 10.78689 × Lat-udder + 11.95671 × Post-udder − 0.04463 × Left-area2 0.41
Cardiac frequency = –9568.63655 + 472.08375 × Lat-udder − 5.76212 × Lat-udder2 0.26
Panting score = –119.84094 + 0.52006 × Lat-udder + 0.69182 × Post-udder + 4.04860 × Left-area − 0.0553 × Left-area2 − 0.19014 × Foot 0.42
R2 - coefficient of determination.
Table 4 - Multiple regression equations and their correlation coefficients to estimate the variables that predict the physiological parameters of the animals in the afternoon
Morning Afternoon
AT RH THI BGHI AT RH THI BGHI
Girolando
Minumum 20.70 67.00 69.20 69.91 28.10 52.00 82.00 78.16
Maximum 31.60 95.00 85.30 87.66 34.20 93.00 87.70 88.53
Average 26.15 81.00 77.25 78.78 31.15 72.50 84.85 83.34
Holstein
Minumum 22.00 84.00 72.60 71.27 21.90 55.00 82.10 82.82
Maximum 25.60 95.00 75.70 76.29 37.90 95.00 87.00 83.64
Average 23.80 89.50 74.15 73.78 29.90 75.00 84.55 86.23
frequency, cardiac frequency, and panting score) presented a tendency of positive correlations and ranged from low to high (P<0.01) with infrared thermography (eye, right-area, lat-udder, and post-udder). A moderate correlation was found between eye and rectal temperature (0.57) and post-udder and rectal temperature (0.69) and high correlation between lat-udder and rectal temperature (0.74). Moderate positive correlations among eye, lat-udder, and post-udder with respiratory frequency (r = 0.43; 0.57 and 0.50, respectively) and the same thermographic measurements with cardiac frequency (r = 0.31; 0.47 and 0.37, respectively) also had moderate positive correlations. The panting score was positively but moderately correlated with eye, lat-udder, and post-udder (r = 0.37; 0.54 and 0.41, respectively). The regression analysis between thermography and physiological traits measured in the afternoon revealed that the coefficient of determination was greater for rectal temperature (R2 =
0.70), when the independent variables were lat-udder, post-udder, left-area, and left-area2 (P<0.003). As the coefficient
of determination of the regression equations between thermography and other physiological parameters were lower than 0.60, they were not considered good predictors to evaluate the thermal stress. Multiple regression analysis showed that thermography taken at the post-udder and lat-udder were the optimal regions to evaluate the thermal stress in animals during the afternoon (Table 4).
Seven variables differentiated between genetic groups, as revealed by the high significance in the multivariate test (Table 5). The heat tolerance presented the highest value for partial R2, being significant in the F test. The variable
foot was also highly significant, but with a partial R2 value
of 0.345. The two variables can be considered the most important in differentiating the genotypes used. The other characteristics were considered discriminating because they were significantly correlated, except lat-udder, but
with a low, although significant partial R2 and F value. The
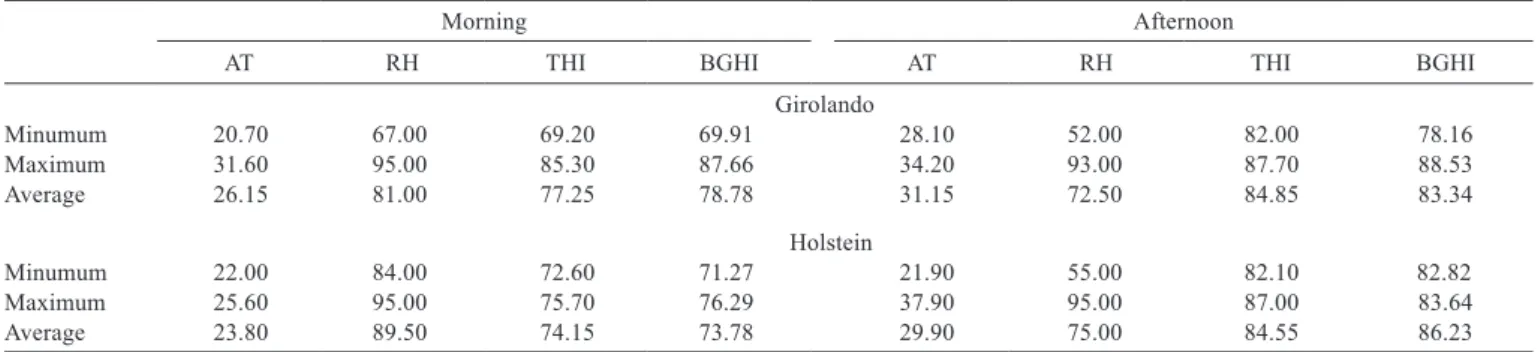
canonical analysis of the data in the morning (Figure 2A) showed that the first canonical variable separated the pure Holstein from crossbred animals, while the second canonical variable separated the ½ HO and ¾ HO. Thermographic measurements, such as post-udder, lat-udder, and foot were associated with physiological parameters as rectal temperature, respiratory frequency, panting score, and heat tolerance and all these variables were more associated with Holstein cows. Thermographic measurements such as left-area, right-area, eye, and cardiac frequency were more associated with ½ HO and ¾ HO cows. In the morning, the physiological and thermographic measurements were different between groups (Holstein and Girolando) and there was a difference between ½ HO and ¾ HO, but not with such great magnitude compared with HO.
In the afternoon (Figure 2B), again the canonical variable 1 differentiated Holstein and Girolando, while the canonical variable 2 separated ½ HO and ¾ HO. Holstein
Order Variable R2 Pr>F Pr>AMCC
1 Heat tolerance 0.348 <0.0001 <0.0001
2 Foot 0.345 <0.0001 <0.0001
3 Panting score 0.142 0.0003 <0.0001
4 Left-area 0.122 0.0011 <0.0001
5 Cardiac frequency 0.060 0.0388 <0.0001
6 Lat-udder 0.043 0.1027 <0.0001
7 Post-udder 0.061 0.0387 <0.0001
HO - purebred Holstein cows; ½ HO - ½ Holstein × ½ Gir; ¾ HO - ¾ Holstein × ¼ Gir; R2 - coefficient of determination.
Foot - right forelimb region in posterior foot measured with infrared thermography; left-area - left area of the animal measured with infrared thermography; lat-udder - lateral region of the udder measured with infrared thermography; post-udder - posterior region of the udder measured with infrared thermography.
Table 5 - Discriminant analysis of physiological variables with measurements of infrared thermography of different genetic groups (½ HO, ¾ HO, and HO) in the afternoon
HT - heat tolerance; RT - rectal temperature; RF - respiratory frequency; CF - cardiac frequency; PS - panting score.
Eye - temperature measurement of the eye with infrared thermography; right-area - right area of the animal measured with infrared thermography; left-area - left area measured with infrared thermography; lat-udder - lateral region of the udder measured with infrared thermography; post-udder - posterior region of the udder measured with infrared thermography; foot - right forelimb region in posterior foot measured with infrared thermography.
cows showed a greater association with heat tolerance, physiological variables, and with eye, lat-udder, and post-udder. The genetic groups ½ HO and ¾ HO showed greater association with right-area, left-area, and foot. When compared with the morning, afternoon results showed a greater distance between ½ HO and thermographic and physiological parameters.
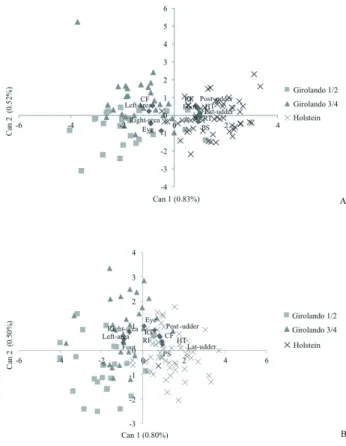
The results of the first and second principal factors in the morning (Figure 3A) explain 41.82% of the total variation among physiological and thermographic traits. The first principal factor was associated with environmental indexes (THI and BGHI). The second factor was mainly associated with thermographic (left-area, right-area, foot, post-udder, eye, and lat-udder) and physiological parameters (rectal temperature, respiratory frequency, cardiac frequency, and panting score).
In the afternoon (Figure 3B), the two principal factors explained 57.66% of the total variation. The first principal
factor was related to thermographic measurements (post-udder and lat-(post-udder) and physiological parameter (rectal temperature). The second principal factor was mainly associated with physiological parameters (respiratory frequency and cardiac frequency) and different genetic groups (group). In general, the percentage of variance explained was low, but it was higher in the afternoon than in the morning.
Regarding THI and BGHI, the inflection points reduced with the increment of Holstein participation in the genotype (Table 6), while regarding the thermal comfort index, the inflection point was lower for ½ HO than for ¾ HO and HO cows. Inflection points were observed when physiological parameters and thermographic measurements were used (Table 7). Highest inflection points were found for Holstein cows and lower points for ½ HO and ¾ HO, respectively, when relating rectal temperature with thermographic measurements. The ¾ HO cows presented higher points of inflection when respiratory and cardiac frequencies with thermographic measures were analyzed together.
Discussion
The differences in ambient temperature, relative humidity, and environmental index between morning and afternoon, with higher values for temperature and lower for relative humidity in the afternoon, were due to the higher direct solar radiation and indicate that the animals were challenged especially in the afternoon by the heat, irrespective of genetic group, as indexes such as THI and BGHI were higher than those indicated for animals in thermoneutral conditions (Akyus et al., 2010; Baêta, 1985). In the afternoon, the animals of all genetic groups showed physiological parameters above the reference values. According to Du Preez (2000), the ideal reference values for rectal temperature can range from 38.0 to 39.3 °C for dairy cows and the ideal respiratory frequency is around 40-60 breaths/min (Silanikove, 2000).
However, Holstein cows showed higher values for physiological parameters (rectal temperature, respiratory frequency and cardiac frequency) than ½ HO and ¾ HO cows, showing that purebred cows suffered more from heat stress. This was expected, since pure Holstein cows are less adapted to climate change, as they present higher metabolic rate and more problems in losing heat, while smaller animals such as Girolando (½ HO and ¾ HO) have greater ease in losing heat (McManus et al., 2009). In our study, milk production presented moderate levels and were similar among groups, but the negative results could be accentuated in more productive animals, since they present
THI - temperature-humidity index; BGHI - black globe-humidity index; HT - heat tolerance; RT - rectal temperature; RF - respiratory frequency; CF - cardiac frequency; PS - panting score.
Eye - temperature measurement of the eye with infrared thermography; right-area - right right-area of the animal measured with infrared thermography; left-right-area - left area measured with infrared thermography; lat-udder - lateral region of the udder measured with infrared thermography; post-udder - posterior region of the udder measured with infrared thermography; foot - right forelimb region in posterior foot measured with infrared thermography.
½ HO ¾ HO HO
R SE Confidence limits R SE Confidence limits R SE Confidence limits
Rectal temperature
Eye 38.38 0.27 37.84 39.93 38.53 0.28 37.96 39.10 38.84 0.12 38.50 39.10
Right-area 38.33** 0.31 37.69 38.97 37.49 0.41 36.67 38.32 40.69 0.15 40.39 41.00
Left-area 38.45** 0.31 37.82 39.08 38.40* 0.38 37.63 39.16 39.09 0.10 38.88 39.26
Lat-udder 38.43 0.21 37.99 38.87 37.85 0.36 37.13 38.58 39.05 0.13 38.78 39.33
Post-udder 38.42 0.20 38.02 38.82 37.99 0.21 37.56 38.42 40.94 0.13 40.68 41.20
Foot 38.40** 0.41 37.57 39.22 37.99* 0.21 37.56 38.42 38.87 0.13 38.60 39.14
Respiratory frequency
Eye 92.00 10.57 70.69 113.30 112.50 9.07 94.35 130.70 104.10 4.75 94.63 113.50
Right-area 86.08 10.98 63.96 108.20 110.80 7.96 94.90 126.80 104.10 4.56 95.32 113.40
Left-area 84.34 10.17 63.84 104.80 93.92 8.66 76.57 111.30 100.90 4.04 92.89 108.90
Lat-udder 80.52 5.92 68.52 95.52 107.10 8.71 89.67 124.60 105.10 3.92 97.35 112.90
Post-udder 77.85 5.65 33.46 89.23 115.10 7.68 99.66 130.40 106.00 4.27 97.51 114.40
Foot 72.00* 8.29 55.28 88.71 77.85 5.65 66.46 89.23 116.00* 11.43 93.33 138.70
Cardiac frequency
Eye 80.14 14.30 51.33 108.90 107.60 13.44 80.64 134.50 92.00 3.40 85.25 98.74
Right-area 81.70 21.41 39.57 124.80 105.80 12.49 80.78 130.80 92.57 3.02 86.58 98.56
Left-area 81.47 18.80 43.59 119.40 76.00* 9.49 5.98 95.01 95.04 3.43 88.23 101.80
Lat-udder 60.00* 13.29 33.22 86.77 100.40 10.52 79.29 121.40 93.98 3.13 87.77 100.20
Post-udder 119.60 52.36 14.16 225.10 107.10 11.60 83.88 130.40 93.98 3.13 87.77 100.20
Foot 60.00* 26.77 6.06 113.90 116.40 18.65 79.00 153.10 101.70 6.82 88.17 115.20
HO - purebred Holstein cows; ½ HO - ½ Holstein × ½ Gir; ¾ HO - ¾ Holstein × ¼ Gir; SE - standard error.
Eye - temperature measurement of the eye with infrared thermography; right-area - right area of the animal measured with infrared thermography; left-area - left area with infrared thermography; lat-udder - lateral region of the udder measured with infrared thermography; post-udder - posterior region of the udder measured with infrared thermography; foot - right forelimb region in posterior foot measured with infrared thermography.
* Proc nlin failed to converge.
** Convergence criterion met, but a note in the log indicates a possible problem with the model.
Table 7 - Inflection point of the curve (R) of the physiological parameters measured with infrared thermography
½ HO ¾ HO HO
R SE Confidence limits R SE Confidence limits R SE Confidence limits
Temperature-humidity index
Eye 77.19 2.37 72.41 81.98 78.47 1.73 74.99 81.95 74.60 0.77 73.06 76.14
Right-area 78.25 2.08 74.05 82.44 78.69 1.63 75.41 81.97 74.36 0.79 72.78 75.95
Left-area 78.30 1.85 74.56 82.03 79.25 2.00 75.24 83.27 73.59 0.67 72.25 74.93
Lat-udder 77.70 1.54 74.58 80.81 78.78 1.44 75.88 81.68 75.08 0.70 73.68 76.48
Post-udder 77.32 1.51 74.27 80.36 78.74 1.47 75.79 81.70 74.00 0.78 72.44 74.56
Foot 76.33 2.28 71.72 80.94 77.74 2.41 72.91 82.57 70.86** . . .
Black globe-humidity index
Eye 75.50 3.57 69.29 83.70 73.23 3.05 67.12 79.35 73.22 0.91 71.42 75.03
Right-area 76.90 2.74 70.97 82.03 73.52 2.99 67.53 79.52 73.62* 0.91 71.80 75.44
Left-area 78.41 2.22 73.93 82.90 74.84 2.64 69.55 80.13 72.96 0.74 71.48 74.45
Lat-udder 74.70 3.19 68.27 81.13 74.03 2.60 68.80 79.25 73.62* 0.90 71.84 75.40
Post-udder 75.59 2.41 70.72 80.46 73.65 2.81 68.00 79.29 73.62* 0.95 71.73 75.50
Foot 75.90 2.70 70.44 81.36 73.03 3.13 66.75 79.31 71.69* 4.06 63.64 79.74
Heat tolerance
Eye 2.71 0.31 2.07 3.35 3.33 0.36 2.60 4.05 2.98 0.28 2.42 3.54
Right-area 2.57* 0.43 1.68 3.45 2.57 0.44 1.67 3.46 3.10 0.25 2.60 3.59
Left-area 2.43 0.44 1.55 3.32 3.06 0.47 2.11 4.00 2.95 0.26 2.42 3.47
Lat-udder 2.20* 0.61 0.95 3.44 3.25* 0.36 2.50 3.99 2.92* 0.22 2.47 3.36
Post-udder 2.54 0.31 1.90 3.18 2.99 0.31 2.36 3.62 3.10 0.20 2.69 2.52
Foot 2.57* 0.55 1.45 3.01 2.99 0.31 2.36 3.62 3.63 0.41 2.80 4.45
HO - purebred Holstein cows; ½ HO - ½ Holstein × ½ Gir; ¾ HO - ¾ Holstein × ¼ Gir; R - inflection point of the curve; SE - standard error.
Eye - temperature of the eye measured with infrared thermography; right-area - right area of the animal measured with infrared thermography; left-area - left area measured with infrared thermography; lat-udder - lateral region of the udder measured with infrared thermography; post-udder - posterior region of the udder measured with infrared thermography; foot - right forelimb region in posterior foot measured with infrared thermography.
* Proc nlin failed to converge.
** Convergence criterion met, but a note in the log indicates a possible problem with the model.
high metabolic heat production and lower heat dissipation capacity for the environment (Dash et al., 2016).
In the afternoon, positive correlations were found between BGHI and eye, left-area, and post-udder temperatures. This positive relationship between BGHI and thermographic measurements (except right-area, lat-udder, and foot) is probably due to increased heat loss in the skin by physiological adaptive mechanisms, avoiding hyperthermia (McManus et al., 2015); in response to heat stress, vasodilation uses the heat dissipation method to attract more heat to the skin surface, increasing blood flow to the periphery (Choshniak et al., 1982). Different temperature points were evaluated using the thermograph in lambs of different genetic groups and it was verified that BGHI was a good indicator of the climatic conditions that affect animals’ response (Paim et al., 2012). Buffington et al. (1981) reported that BGHI is a more accurate comfort indicator than the THI, when animals are exposed to indirect or direct solar radiation. Such statement may indicate why, in our study, BGHI was better correlated with the thermographic measurements than THI.
There were moderate and high positive correlations between the physiological parameters (rectal temperature, respiratory frequency, cardiac frequency, and panting score) with the same thermographic measurements (eye, lat-udder, and post-udder). This showed that these measures varied simultaneously in the same direction; increasing physiological parameters corresponds to increase of the temperature of areas photographed with infrared thermography. Due to the greater stress to which the animals were subjected, there was an increase in the physiological parameters as the animals were maintaining the homeothermia and, as a consequence, the thermographic temperatures increased (McManus et al., 2015).
In our study, we found that the maximum rectal temperature in the afternoon was 40.7 °C for ½ HO and ¾ HO and 41.5 °C for HO. Vasconcelos and Demetrio (2011) reported that when the rectal temperature is equal or above 39 °C, the animals are probably suffering the effects of heat stress. Bitman et al. (1984) found correlation (r = 0.98-0.99) between the temperature of the udder and the mean temperature of the body of the cow (38±0.1 °C), because mammary gland and body do not have independent mechanisms to regulate their temperatures. In our experiment, the average temperature of the udder was 37.04 °C and correlation (r = 0.74) was found between the temperature of the udder in right lateral view and rectal temperature. Poikalainen et al. (2012) also found that the region of the udder of the cow had the highest temperatures, with no temperature difference before and after milking
(P>0.05), meaning that the temperature of the udder is not dependent on post- or pre-milking procedures.
The multiple regression analysis showed that the thermographic images of the udder (lat-udder and post-udder) had a dependent relationship with rectal temperature. This indicates that udder point is the most relevant in determining the thermal comfort and can be used to measure it. This was confirmed by principal factor analysis in the afternoon, because the values had higher weights for thermographic measurements of the udder (lat-udder and post-udder) and rectal temperature, which is in agreement with Hovinen et al. (2008). Infrared thermography scans the surface temperature of the animal (Hoffmann et al., 2013), which varies with blood flow to the tissues and the amount of heat lost to the environment (Gil et al., 2013). Therefore, the optimal region found to identify the animal under heat stress in our study was the udder, due to extensive blood flow.
Variations in temperature at the body surface can be monitored reliably with thermography (Knížková et al., 2007) and udder thermography offers an interesting possibility for monitoring the body temperature of cows (Metzner et al., 2014). The inflection point of broken-line analysis between environmental index (THI and BGHI) and measures of infrared thermography showed that ½ HO and ¾ HO animals had higher values of THI and BGHI compared with Holstein. In fact, Azevedo et al. (2005) found that crossbred cows had higher critical values of THI and BGHI than pure cows from temperature climates. In our study, the critical value of the inflection point of the THI curve with thermographic measurements was 79.25 for the different genetic groups. Akyus et al. (2010) found the critical value of THI was 89, whereas Azevedo et al. (2005) found the value of 80 in Girolando cattle.
The lower values for the inflection point between thermographic measurements and heat tolerance of ½ HO cows confirms the superior ability of Bos indicus to withstand heat stress relative to the tropical Bos taurus
that confirms the higher susceptibility of Holstein animals to increased temperatures and agrees with Façanha et al. (2012), who stated that temperate breeds introduced into the American continent are adapted to temperate regions, but not the tropical regions. The broken-line analysis for physiological parameters, compared with infrared thermography measurements, also showed the lower inflection points in rectal temperature and respiratory frequency in Holstein cattle (Table 7). This shows that these animals were in a situation of thermal discomfort compared with ½ HO and ¾ HO. Bianchini et al. (2006) reported that Holstein has a smaller area of tissue occupied by sweat glands, which may indicate greater adaptive difficulty compared with Zebu cattle, which have greater ability to eliminate sweat and greater ability to adapt to heat. However, several factors that may affect body temperature must be taken into consideration, such as the relative humidity of the environment, physiological state of the animal, production level of the cow, as well as time in relation to feeding and milking (Colak et al., 2008). In our study, there were no differences in the meteorological measurements among genetic groups. Additionally, all cows presented similar production levels. Consequently, the factor production level may not be considered the responsible for the heat tolerance. However, in our experiments, the use of infrared thermography used to evaluate the heat tolerance of the animals was sensitive to detect differences in temperature of the skin of animals, particularly in the region of the udder. Alsaaod and Büscher (2012) mentioned that a controlled environment is essential to ensure the reliability of thermographic images.
Conclusions
The Holstein animals are less tolerant to heat compared with ½ and ¾ Holstein. The black-globe humidity index is the most accurate environmental indicator of comfort in association with thermographic measurements. Infrared thermography is effective to determine heat-stressed cows of genetic groups Holstein, ½ Holstein, and ¾ Holstein. The ideal area found to determine the thermal comfort in dairy cows is the udder region, compared with others studied in this experiment.
Acknowledgments
We thank the Conselho Nacional de Desenvolvimento Científico e Tecnológico (CNPq) and the Coordenação de Aperfeiçoamento de Pessoal de Nível Superior (CAPES) for the financial support and scholarship.
References
Akyuz, A.; Boyaci, S. and Cayli, A. 2010. Determination of critical period for dairy cows using temperature humidity index. Journal of Animal and Veterinary Advances 9:1824-1827.
Almeida, G. L. P.; Pandorfi, H. and Guiselini, C. 2011. Uso do sistema de resfriamento adiabático evaporativo no conforto térmico de vacas da raça Girolando. Revista Brasileira de Engenharia Agrícola e Ambiental 15:754:760.
Alsaaod, M. and Büscher, W. 2012. Detection of hoof lesions using digital infrared thermography in dairy cows. Journal of Dairy Science 95:735-742.
Azevedo, M.; Pires, M. F. A.; Saturnino, H. M.; Lana, A. M. Q.; Sampaio, I. B. M.; Monteiro, J. B. N. and Morato, L. E. 2005. Estimativa de níveis críticos superiores do índice de temperatura e umidade para vacas leiteiras 1/2, 3/4, 7/8 Holandês-Zebu em lactação. Revista Brasileira de Zootecnia 34:2000-2008.
Baêta, F. C. 1985. Responses of lactating dairy cows to the combined effects of temperature, humidity and wind velocity in the warm season. Thesis (PhD.). University of Missouri, Columbia. Benezra, M. V. 1954. A new index measuring the adaptability of cattle
to tropical conditions. Journal of Animal Science 13:1015. Berry, R. J.; Kennedy, A. D.; Scott, S. L.; Kyle, B. L. and Schaefer, A.
L. 2003. Daily variation in the udder surface temperature of dairy cows measured by infrared thermography: Potential for mastitis detection. Canadian Journal of Animal Science 83:687-693. Bianchini, E.; McManus, C.; Lucci, C. M.; Fernandes, M. C.; Prescott,
E.; Mariante, A. S. and Egito, A. A. 2006. Características corporais associadas com a adaptação ao calor em bovinos naturalizados brasileiros. Pesquisa Agropecuária Brasileira 41:1443-1448. Bitman, J.; Lefcourt, A.; Wood, D. L. and Stroud, B. 1984. Circadian
and ultradian temperature rhythms of lactating dairy cows. Journal of Dairy Science 67:1014-1023.
Buffington, D. E.; Collazo-Arocho, A.; Canton, G. H.; Pitt, D.; Thatcher, W. W. and Collier, R. J. 1981. Black globo-humidity index (BGHI) as comfort equation for dairy cows. Transactions of the ASAE 24:711-714.
Choshniak, I.; McEwan-Jenkinson, D.; Blatchford, D. R. and Peaker, M. 1982. Blood flow and catecholamine concentration in bovine and caprine skin during thermal sweating. Comparative Biochemistry Physiology 71:37-42.
Colak, A.; Polat, B.; Okumus, Z.; Kaya, M.; Yanmaz, L. E. and Hayirli, A. 2008. Short Communication:Early detection of mastitis using infrared thermography in dairy cows. Journal Dairy Science 91:4244-4248.
Cruz, L. V.; Angrimani, D. S. R.; Rui, B. R. and Silva, M. A. 2011. Efeitos do estresse térmico na produção leiteira: revisão de literatura. Revista Científica Eletrônica de Medicina Veterinária 9(16).
Dash, S.; Chakravarty, K.; Singh, A.; Upadhyay, A.; Singh, M. and Yousuf, S. 2016. Effect of heat stress on reproductive performance of dairy cattle and buffaloes: A review. Veterinary Wold 9:235-244. Du Preez, J. H. 2000. Parameters for the determination and evaluation
of heat stress in dairy cattle in South Africa. Journal of Veterinary Research 67:263-271.
Façanha, D. A. E.; Vasconcelos, A. M.; Lima, F. R. G.; Eloy, A. M. X.; Ayura, A. O. L.; Guilhermino, M. M. and Landim, A. 2012. Características termorreguladoras e desempenho de cabras leiteiras no terço inicial da lactação em clima tropical. Revista Portuguesa de Ciências Veterinárias 111:151-156.
Godyn, D.; Herbur, E. and Walczak, J. 2013. Infrared thermography as a method for evaluating the welfare of animals subjected to invasive procedures – a Review. Annals of Animal Science 13:423-434.
Hoffmann, G.; Schmidt, M.; Ammon, C.; Rose-Meierhöfer, S.; Burfeind, O.; Heuwieser, W. and Berg, W. 2013. Monitoring the body temperature of cows and calves using video recordings from an infrared thermography camera. Veterinary Research Communications 37:91-99.
Hovinen, M.; Siivonen, J.; Taponen, S.; Hanninen, L.; Pastell, M.; Aisla, A. M. and Pyorala, S. 2008. Detection of clinical mastitis with the help of a thermal camera. Journal Dairy Science 91:4592-4598. Johnson, H. D.; Ragsdale, A. C.; Berry, I. L. and Shanklin, M. D.
1962. Effect of various temperature-humidity combinations on milk production of Holstein cattle. Research Bulletin, 791. Missouri Agricultural Experiment Station, Columbia.
Knížková, I.; Kunc, P.; Gurdil, G. A. K.; Pinar, Y. and Selvi, K. C. 2007. Applications of infrared thermography in animal production. Journal of the Faculty of Agriculture 22:329-336.
Kunc, P.; Knížková, I.; Prikryl, M. and Maloun, J. 2007. Infrared thermography as a tool to study the milking process: a review. Agricultura Tropica et Subtropica 40:29-32.
Mader, T. L.; Davis, M. S. and Brown-Brandl, T. 2006. Environmental factors influencing heat stress in feedlot cattle. Journal of Animal Science 84:712-719.
McManus, C.; Bianchini, E.; Paim, T. P.; Lima, F. G.; Braccini, J.; Castanheira, M.; Esteves, G. I. F.; Cardoso, C. C. and Dalcin, V. C. 2015. Infrared thermography to evaluate heat tolerance in different genetic groups of lambs. Sensors 15:17258-17273.
McManus, C.; Louvandini, H.; Paim, T. P.; Martins, R. S.; Barcellos, J. O. J.; Cardoso, C.; Guimarães, R. F. and Santana, O. A. 2011. The challenge of sheep farming in the tropics: aspects related to heat tolerance. Revista Brasileira de Zootecnia 40:107-120. McManus, C.; Prescott, E.; Paludo, G. R.; Oliveira, E. M. B.;
Louvandini, H. and Mariante, A. S. 2009. Heat tolerance in naturalized Brazilian cattle breeds. Livestock Science 120:256-264. Melo, E. C.; Lopes, D. C. and Corrêa, P. C. 2004. GRAPSI – Programa
Computacional para o cálculo das propriedades psicrométricas do ar. Engenharia na Agricultura 12:154-162.
Metzner, M.; Suter-Louis, C.; Seemueller, A.; Petzl, W. and Klee, W. 2014. Infrared thermography of the udder surface of dairy cattle: Characteristics, methods, and correlation with rectal temperature. The Veterinary Journal 199:57-62.
Moura, D. J.; Maia, A. P. A.; Vercellino, R. A.; Medeiros, B. B. L.; Sarubbi, J. and Griska, P. R. 2011. Uso termografia infravermelha na análise da termorregulação de cavalo em treinamento. Engenharia Agrícola 31:23-32.
Paim, T. P.; Borges, B. O.; Lima, P. M. T.; Dallago, B. S. L.; Louvandini, H. and McManus, C. 2012. Relation between thermografic temperatures of lambs and thermal comfort indices. International Journal of Apploed Animal Sciences 4:108-115.
Paim, T. P.; Borges, B. O.; Lima, P. M. T.; Gomes, E. F.; Dallago, B. S. L.; Fadel, R.; Menezes, A. M.; Louvandini, H.; Canozzi, M. E. A.; Barcellos, J. O. J. and McManus, C. 2013. Thermographic evaluation of climatic conditions on lambs from different genetic groups. International Journal of Biometeorology 57:59-66.
Poikalainen, V.; Praks, J.; Veermäe, I. and Kokin, E. 2012. Infrared temperature patterns of cow’s body as an indicator for health control at precision cattle farming. Agronomy Research 10:187-194. Santos, F. C. B.; Souza, B. B.; Alfaro, C. E. P.; Cézar, M. F.;
Pimenta Filho, E. C.; Acosta A. A. A. and Santos, J. R. S. 2005. Adaptabilidade de caprinos exóticos e naturalizados ao clima semi-árido do Nordeste brasileiro. Ciência e Agrotecnologia 29:142-149.
Silanikove, N. 2000. Effects of heat stress on the welfare of extensively managed domestic ruminants. Livestock Production Science 67:1-18.
Stewart, M.; Stafford, K. J.; Dowling, S. K.; Schaefer, A. L. and Webster, J. R. 2008. Eye temperature and heat rate variability of calves disbudded with or without local anaesthetic. Physiology and Behavior 93:789-797.
Stewart, M.; Webster, J. R.; Schaefer, A. L.; Cook, N. J. and Scott, S. L. 2005. Infrared thermography as a non-invasive tool to study animal welfare. Animal Welfare 14:319-325.