Food Science and Technology ISSN 0101-2061
DII:
D httpI://dx.doi.org/10.1590/1678-457X.04317
1 Introduction
The beginning of buffalo breeding (Bubalus bubalis) in Brazil occurred around the year 1980 in various regions of the country (Bernardes, 2007). Since the 90s, there has been an increase in the number of industries manufacturing products derived from buffalo milk in Brazil, which are responsible for using most of the milk produced. Two major factors that contribute to the interest in buffalo milk processing are the peculiar characteristics of the raw material in terms of composition, which surpasses solid content and yield when compared to bovine milk characteristics (Teixeira et al., 2005; Tonhati et al., 2008; Rangel et al., 2011).
In Brazil, there are less than ten establishments which are recognized by the Brazilian Association of Buffalo Breeders (ABCB) who manufacture some or all of their products with buffalo milk, with mozzarella cheese being the main by-product (Associação Brasileira dos Criadores de Búfalos, 2014).
Mozzarella cheese is typically from Italy where it is widely consumed and valued. As it has strong originality, this cheese has a well-established niche market and a promising future in Brazil. Encouraged by the Brazilian Association of Buffalo Breeders (ABCB) through actions linked to the “100% Buffalo Purity Label”, industries that only use this kind of milk to obtain mozzarella try to follow a similar production system to the Italian, taking careful responsibility to maintain the product as similar as possible and to protect its gastronomic and historical value (Associação Brasileira dos Criadores de Búfalos, 2014).
Citro (2010) described the manufacturing technology adopted in Italy for curd cheeses from the process to the aspects that distinguish the different Italian cheeses, including traditional mozzarella. According to this author, the attributes of mozzarella flavor, aroma and texture result from the method used for its manufacturing, which, among other things, includes the need for strict control of the quantity and quality of ingredients, coagulation and fermentation conditions and even specific machinery.
The industry can achieve about 20 to 22 kg of mozzarella from the processing of 100 liters of milk, an almost 50% higher yield than that for bovine milk (Citro, 2010). Cheese yield demonstrates the milk volume used and cheese volume produced and in a complementary way the recovery of solids from whey indicates the percentage of milk solids lost as a residue of the process. Both yield and recovery of solids from whey in cheese are valid tools for the industry to obtain information about the use of raw materials for better production management. Furthermore, good control during cheese manufacturing steps allows the dairy industry to identify bottlenecks or points with potential for improvement that can optimize the production process.
Studies in the context of manufacturing Mozzarella, as well as information regarding efficiency in the use of buffalo milk and processing aspects are still restricted in the scientific community,
Buffalo milk composition, processing factors, whey constituents recovery and yield in
manufacturing Mozzarella cheese
Danielle Cavalcanti SALES1, Adriano Henrique do Nascimento RANGEL1, Stela Antas URBAND1*,
Humberto TDNHATI2, José Geraldo Bezerra GALVÃD JÚNIDR3, Magda Maria GUILHERMIND1,
Emerson Moreira AGUIAR1, Maria de Fátima BEZERRA1
Received 10 Feb., 2017 Accepted 14 June, 2017
1 Universidade Federal do Rio Grande do Norte – UFRN, Lagoa Nova, Natal, RN, Brazil
2 Faculdade de Ciências Agrárias e Veterinárias, Universidade Estadual Paulista “Júlio de Mesquita Filho” – UNESP, Jaboticabal, SP, Brazil 3 Instituto Federal de Educação, Ciência e Tecnologia do Rio Grande do Norte – IFRN, Ipanguaçu, RN, Brazil
*Corresponding authorI: stela_antas@yahoo.com.br Abstract
Mozzarella cheese is typically from Italy and consumed in the whole world. The aim of this study was to characterize the manufacture of Mozzarella produced similarly to Italian in a Brazilian dairy industry regarding the milk composition usage, factors involved in the production process, use of raw materials and cheese yield. Was monitored the Mozzarella yield (MY), milk composition, manufacturing of Mozzarella cheese and recovery of whey constituents of 30 lots of Mozzarella cheese in a dairy brazilian industry. Dverall, processing reached an adequate MY for this type of cheese, being below 5.0 L kg-1. We find values of 5.93 ± 1.87; 34.97 ± 2.70; 33.39 ± 2.85; 95.04 ± 4.18; 44.02 ± 2.00; and 66.82 ± 3.36 respectively for recovery of fat, protein, casein, lactose, total solids and solids-not-fat in whey. The milk used by the dairy industry had satisfactory physicochemical characteristics. The manufacturing of Mozzarella cheese was efficient.
Keywords: Bubalus bubalis; dairy; efficiency; industry; pasta-filata.
especially in Brazil. Thus, this study aimed to characterize the manufacture of mozzarella produced in a Brazilian dairy industry regarding the milk composition usage, factors involved in the production process, use of raw materials and yield.
2 Materials and methods
2.1 Data collection
The study was developed in a dairy industry located in the state of Rio Grande do Norte, Brazil. Processing of 30 lots of mozzarella cheese was monitored weekly from April to November 2015, respecting the industry schedule. The average number of days between monitoring the production lots was 7.45 ± 2.69 days. The milk used for manufacturing the cheese was produced by the herd from the establishment, containing an average of 350 lactating buffaloes milked twice a day (morning and afternoon), by a mechanical system.
2.2 Mozzarella cheese manufacture
The mozzarella was produced by enzymatic coagulation of milk following the recommendations from Citro (2010), in order to obtain a cheese very close in characteristics to the same Italian cheese.
The employed manufacturing technology in mozzarella cheese production consisted of the following stepsI: Pasteurization (72 °C for 15 seconds); Addition of Ingredients - Starter culture (natural yeast), calcium chloride, chymosin rennet powder (power coagulant 1I:50.000). Coagulation of milk - 10 min after the addition of rennet and at every 5 min until the end point, at which the milk had gel consistency. Cut curd - Dnce the end of coagulation was identified, the curd was left to rest for double the amount of time, and then the first cut was performed. The first curd cut was a cross cut performed. Every 15 min changes in pH and acidity of the whey that separated from the curd were monitored. The second cut of the curd was performed into transversal lines only when it reached between 16 and 20 °D. Curd separation - the curd was transferred from the tank into a stainless steel table about 2 hours after the second cut when the curd reached a pH close to 5.0, or when the cheesemaker identified that it was close to the stretching point. Stretching - the cheesemaker repeated stretching tests using small portions of the curd, until it was easily stretched and had good elasticity without breaking (ideal point for stretching the entire curd). Thereafter, the curd was triturated in portions, immersed in water (1I:1, 90 °C) in a plastic bowl and manually stirred in circular motions until it reached the desirable softness and elasticity. Shaping, packaging and salting. Immediately after stretching, the cheese portions were placed into an Italian Cheese Ball Forming Machine, then molded into large or small balls and immediately cooled in cold water. The cheese was placed with a 1% saline solution.
2.3 Sample collection
A sample of raw milk was collected from the milk arrival flow at the receiving tank for each of the 30 lots monitored within the dairy industry, and a whey sample from mozzarella cheese at
the end of processing was collected directly from the production tank. They were identified, placed in plastic vials of 40 mL and maintained at a temperature between 4 and 7 °C until analysis.
2.4 Laboratory analyzes
The milk samples were subjected to physical-chemical
analysis of pH, acidity (°D), density (g•mL−1 at 15 °C) fat, protein,
casein, lactose, total solids, milk solids-not-fat (%), and somatic cell count (SCC) (x 103 cells•mL-1). However, the samples from cheese whey were also subjected to chemical analysis of fat, total protein, casein, lactose, total solids and solids-not-fat.
For determining protein, fat, lactose and total solids, the samples were subjected to duplicate analysis by infrared absorption (Bentley Instruments Inc., USA) and SCC using the SDMATICELL® (IDEXX Laboratories Inc., USA), following the manufacturer’s protocol. Both analyzes were carried out at the Milk Quality Laboratory of the Federal University of Rio Grande do Norte (LABDLEITE), Brazil.
Physical analysis of milk and starter culture (pH and acidity) were performed in the industry laboratory itself. pH was obtained through a digital portable meter, properly calibrated with 4.0 and 7.0 buffer solutions. Acidity was determined by titration by NaDH with phenolphthalein indicator. The density of the milk was obtained using a thermal lactodensimeter gauge at 15 °C. The results from the physical tests of the starter culture were used to calculate the starter culture volume to be added to the milk during the process.
2.5 Description of variables
The study considered a total of 32 variables, divided into three groupsI:
Group 1 - Milk composition variables (12)I: Fat content, %; total protein content, %; casein content %; caseinI:total protein ratio; lactose content, %; total solid content; solids-not-fat content,
%; density at 15ºC, g•mL-1; cryoscopic index, °H (CI); pH and
titratable acidity, ºD and somatic cell score, log2•(SCC ÷ 100.000)
+ 3, in log cells•mL-1.
Group 2 - Variables involved in the manufacturing process of mozzarella cheese (14)I: Volume of milk used, liters; pH of starter culture; starter culture acidity, °D; age of the starter culture, hours; volume of starter culture used, liters; volume
of calcium chloride, mL•L-1; volume of rennet, g; temperature
of rennet addition, °C; average pH of curd during stretching; coagulation time, min; time between cuts, min; fermentation time, min; stretching time for the whole curd, min; complete fermentation time, min.
Group 3 - Recovery variables of whey constituents (6)I: fat recovery from whey, %; protein recovery from whey, %; casein recovery from whey, %; lactose recovery from whey, %; total solids recovery from whey, % and solids-not-fat recovery from whey, %.
The mozzarella yield considered in this study was analyzed
2.6 Mathematical calculations
The values obtained for SCC were transformed into Somatic Cell Score (SCS) using the following procedure by Shook (1982)I:
SCS = log2•(SCC⁄(100,000)+3), where, SCS = Somatic Cell Score;
SCC = Somatic Cell Count (x 103 cell•mL-1).
The exact volume of milk used (VI) in the process and of residual whey for production (Vs) was calculated in liters (cm3), considering the occupied area in the tank as followsI: Vl (or Vs) = H x W x L, where, H = height reached by the milk blade in relation to the tank wall (cm); W = width of the production tank (cm); L = length of the production tank (cm).
The amount of starter culture (VSC) added to the process, in liters, was calculated taking into consideration the initial acidity of the milk and starter culture acidity, calculated byI:
VSC = (Vl x UA)⁄Asc, where, Vsc = volume of starter culture
required to raise the acidity of milk to “n” UA (L); Vl = volume of milk used (L); UA = units of acidity (°D) of the milk, which is wanted to be increased with the addition of starter culture; Asc = Acidity of starter culture (°D). The Vl (L) was converted into kilograms for use in the mozzarella yield equationI: Vlkg = Vl x Dens, where, Vlkg = volume of milk used (kg); Vl = volume of milk used (L); Dens = density (kg L-1).
Mozzarella yield in kg•kg-1 (MY), was obtained by an
equation adapted from Rossi et al. (1998), which represents the milk volume used to obtain one kg of cheeseI: MY = Vlkg/Vc, where, Vlkg = volume of milk used in kilograms; VC = volume of produced cheese in kilograms.
The recovery of fat, protein, casein, lactose, total solids and solids-not-fat in the whey was obtained as proposed by Furtado & Pombo (1979)I: (c)REC = %Whey/%Milk, where, (c) = Fat, total protein, casein, lactose, total solids or solids-not-fat; REC(c) = Recovery of whey constituents (%); %Whey = content
of the component (c) in whey (%); content of the component (c) in milk (%).
2.7 Statistical analysis
The data was organized in an electronic spreadsheet and subjected to statistical methods of descriptive analysis through the PRDC MEANS procedure (SAS Institute Inc., 2003).
3 Results and discussion
3.1 Milk and whey characteristics
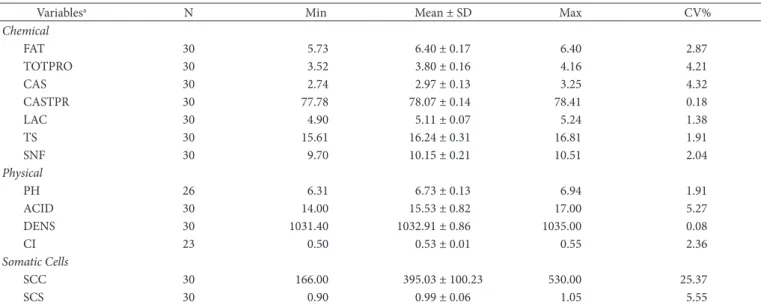
Results of the raw milk chemical composition analysis for each monitored lot is found in Table 1. The composition of milk is subject to changes due to numerous factors such as race, environmental conditions and health status of the mammary gland. Fat and protein are the components that tend to suffer greatest variations in milk even when in the same environmental conditions, and these variations are generally related to the nutrition and diet of animals (Costa et al., 2014). However, it is important to verify milk composition before its use in manufacturing dairy products, considering the importance of the chemical and physical conditions and the SCC of raw materials for good processing and final quality of the cheese.
The values for physico-chemical characteristics of raw buffalo milk are not very different from the findings in national and international studies (Table 1). Despite many of these foreign buffalo herds being at a more advanced breeding stage than Brazilian herds in the main sense of increasing total solids and casein, the physical and chemical composition of milk in this study is only slightly different from the international reality, and therefore is what is expected for the species.
Soares et al. (2013), Costa et al. (2014) and Lima et al. (2014) in studying the herd from the same establishment as this study, but
Table 1. Number of observations (N), mean values, standard deviation (SD), minimum (Min) and maximum values (Max) and coefficient of
variation (CV%) of physical-chemical variables of raw buffalo milk used in the dairy industry.
Variablesa N Min Mean ± SD Max CV%
Chemical
FAT 30 5.73 6.40 ± 0.17 6.40 2.87
TDTPRD 30 3.52 3.80 ± 0.16 4.16 4.21
CAS 30 2.74 2.97 ± 0.13 3.25 4.32
CASTPR 30 77.78 78.07 ± 0.14 78.41 0.18
LAC 30 4.90 5.11 ± 0.07 5.24 1.38
TS 30 15.61 16.24 ± 0.31 16.81 1.91
SNF 30 9.70 10.15 ± 0.21 10.51 2.04
Physical
PH 26 6.31 6.73 ± 0.13 6.94 1.91
ACID 30 14.00 15.53 ± 0.82 17.00 5.27
DENS 30 1031.40 1032.91 ± 0.86 1035.00 0.08
CI 23 0.50 0.53 ± 0.01 0.55 2.36
Somatic Cells
SCC 30 166.00 395.03 ± 100.23 530.00 25.37
SCS 30 0.90 0.99 ± 0.06 1.05 5.55
aFAT = Fat; TDTPRD = total protein; CAS = Casein; CASTPR = caseinI: total protein ratio; LAC = Lactose (%); TS = Total solids; SNF = solids-not-fat; PH = Potential of Hydrogen;
in previous years, found similar mean averages for fat (between 5.44 and 6.33%), total protein (between 3.99 and 4.24%), casein (3.27%), lactose (between 4.77 and 4.8), total solids (between 15.42 and 16.26%) and solids-not-fat (between 9.88 and 9.89%).
For optimal manufacturing efficiency, a high CI:TP ratio is desirable, since casein is a protein portion which is highly associated to milk coagulation, and retention of other constituents in curd and cheese yield, therefore having high technological property. Tripaldi et al. (2010) found an average of 80.44% for casein/protein ratio in buffalo milk; Costa et al. (2014) identified an average of 79.17% (min. of 78.07 and max. of 80.49%) with the same herd of this study, values within a similar CI:TP found in this study (78.07). Thus, the buffalo milk used in mozzarella cheese production had its physical and chemical characteristics within the expected range for the species, and naturally has the potential to be used as raw material in the dairy industry.
Pizauro et al. (2014) monitored the SCC of buffaloes throughout lactation, and obtained an average of 199 x 103 cells•mL-1. Tripaldi et al. (2010) obtained an average of 286,5 x 10³ cells•mL-1. Studies with the herd from the same establishment where this study was conducted in different years found averages of 302.62 x 10³ cells•mL-1 (min. 220 and max. 470 x 103 cells•mL-1)
and 2.11 log cells•mL-1 (min. 1.90 and max. 2.34 log cells•mL-1)
by Costa et al. (2014) and Rangel et al. (2011), respectively. The effects of SCC on the yield and loss of constituents from whey are clear. To ensure the properties of manufacturing cheese, especially coagulation, Tripaldi et al. (2010) suggest that the buffalo milk should not contain SCC above 200 x 103 cells•mL-1, an amount equal to that required as a limit by Italian industries (Sollecito et al., 2011).
The high SCC found (395.03 ± 100.23 x 10³ cells•mL-1) indicate that the herd may have animals infected by pathogenic microorganisms that cause inflammation of the mammary gland and contaminate milk with enzymatic compounds, potential factors for proteolysis of cheese and reducing its shelf life.
Moreover, if by chance there are animals in the herd with chronic inflammation, they could individually contribute to increased SCC rates of the herd milk (storage tank) and drastically influence a decreasing trend on the production of milk and its constituents, which may be linked to small fluctuations found in physical and chemical composition of raw milk.
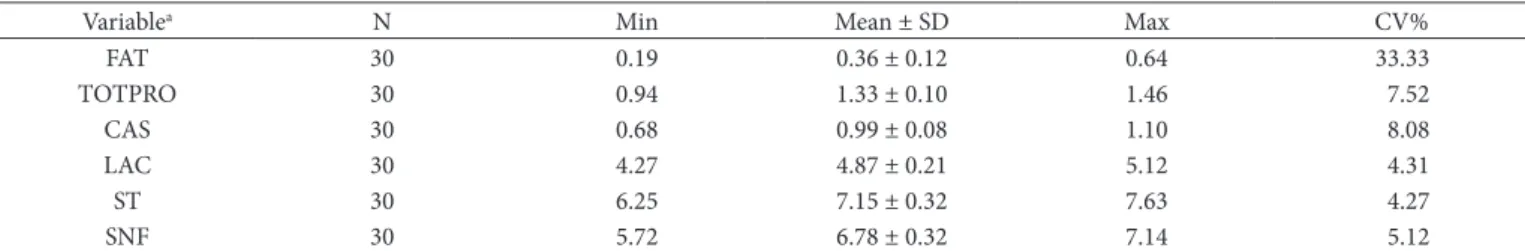
The mozzarella whey composition is shown in Table 2. As in milk, the composition of the whey of derivatives depends
on numerous factors, including milk conditions. Furthermore, the handling of the cheese curd, the processing as a whole and its efficiency/yield provide specific characteristics to the whey produced in the transformation of each derivative.
Lima et al. (2014) found higher values of fat (0.91%) and total protein (1.51%) in the cheese whey obtained by enzymatic coagulation of buffalo milk in the same dairy industry as this study. However, that might be related to the manufacturing method of each cheese. These results indicate that the whey from buffalo milk may be a good source of milk solids, particularly lactose and proteins, for the production of other products such as milk beverages and whey protein powder concentrates.
3.2 Factors regarding the mozzarella manufacturing process
The dairy industry in this study follows the guidelines of the Italian mozzarella manufacturing and for this reason they strictly monitor important factors during the processing of cheese, attempting to reach the Italian goals and at times corrected goals according to the current reality of the company. During this study, the cheesemakers monitored and controlled some of these factors according to their routine. Table 3 shows the overview of the important factors in the production of each monitored cheese lot.
Factors related to the starter culture, time spent during the process and final production of curd, cheese and whey were those with the highest variations among the evaluated factors. The variation of factors related to starter culture is due to the inter-relationship between such characteristics. The interleaving challenge between using an old starter culture and obtaining a new one (whey “renewal”) ensures that the obtained whey has increased fermentation efficiency in each lot of produced cheese, and consequently higher acidity due to the greater load of microorganisms responsible for producing lactic acid. Thus, the whey’s age naturally defines its conditions and its use; a longer storage time provides greater acidity and lower pH to the whey due to a higher concentration of fermentative bacteria and lactic acid. Consequently, using a small amount of this ingredient at the beginning of the process to increase the acidity of milk is needed, providing favorable conditions for lactic acid bacteria.
Monitoring the time spent throughout the whole process and for its main stages is a factor that helps in the management of efficiency and the use of manpower. There was a discrepancy in the average time spent for all steps considered and the optimum time, except for the time between the first and second
Table 2. Number of observations (N), mean values, standard deviation (SD), minimum (Min) and maximum values (Max) and coefficient of
variation (CV%) of the chemical constituents from mozzarella cheese whey.
Variablea N Min Mean ± SD Max CV%
FAT 30 0.19 0.36 ± 0.12 0.64 33.33
TDTPRD 30 0.94 1.33 ± 0.10 1.46 7.52
CAS 30 0.68 0.99 ± 0.08 1.10 8.08
LAC 30 4.27 4.87 ± 0.21 5.12 4.31
ST 30 6.25 7.15 ± 0.32 7.63 4.27
SNF 30 5.72 6.78 ± 0.32 7.14 5.12
cuts, and especially for fermentation. The delayed coagulation had a slight variation compared to the ideal time, and it only occurred in a small number of lots; the portion of rennet used in one of the lots was stored in a clear plastic bag, not in the factory packaging and was exposed to light, which may have diminished its coagulating power.
The time between cuts was within standards, as the second cut at this stage was only performed when the whey tank acidity reached between 16 and 18 °D or 90 min after identifying coagulation.
The factor “Intermediate Fermentation” comprises the step between the second cut until the identification of the stretching point and subsequent separation of the curd as adopted by the dairy industry for controlling the curd conditions. Some lots took longer to reach the stretching point, which may be associated with conditions of the starter culture, coagulation temperature and fermentation, or the composition of raw materials, etc. Further studies should be conducted to understand what motivated such a delay in the intermediate fermentation.
As the complete duration of the processing depends on the steps between the addition of ingredients starting time until the end of the molding, time oscillations spent within that period have variation in the total processing time as a consequence. For some lots, a longer time than the optimal time was observed, indicating that the cheese makers devoted more attention to the mozzarella processing than necessary, which may have caused delays in the processing of other products that were taking place at that time. In practical terms, if an industry has an intense output
stream of goods, it should seek to produce several products in a synchronized manner, respecting the optimum time limit in order to be efficient in the use of available manual labor and also mitigating processing risks (loss of fermentation, pH, and acidity control, etc.) and the final quality of the product (taste, softness, melting, shelf life, etc.). Furthermore, the increase in processing time results in higher production costs for the industry and reduced profits (Mazal et al., 2007).
The production of mozzarella cheese and residual whey depends on the curd obtained. The volume of these three materials suffer significant variations among the lots, probably due to variations in the moisture of the curd and therefore of cheese and whey. Because the starter culture behaves as moisture aggregator to the raw material, and it is indirectly linked to a number of factors during the process, it may have contributed to the fluctuations in the curd, cheese and whey volumes produced. Different levels of SCC affect coagulation times, delayed fermentation and reduction of pH in processing of various types of cheeses (Tripaldi et al., 2003; Castro et al., 2014). Thus, they suggest more specific studies to understand the effect of SCC on these factors in the context of this study.
3.3 Mozzarella cheese yield
In order to ensure standardization of mozzarella characteristics, the dairy industry management pursued a yield in the range of
4.5 to 5.0 L•kg-1. Given that one kilogram of cheese is obtained
from a very low volume of milk (<4.5 L•kg-1), it is inferred that
there has been a great contribution of another element (water)
Table 3. Number of observations (N), mean values, standard deviation (SD), minimum (Min) and maximum values (Max) and coefficient of
variation (CV%) from the manufacturing process factors of mozzarella cheese.
Factor Unity N Min Mean±SD Max CV% Dptimuma
Raw milk
pH - 26 6.31 6.73 ± 0.13 6.94 1.91 6.6-6.7
Acidity °D 30 14.00 15.53 ± 0.82 17.00 5.27 10-18
Volume L 30 641.13 738.08 ± 26.52 797.74 3.59 750
Starter culture
pH - 26 3.42 4.06 ± 0.34 4.82 8.28 4.15-4.25
Acidity °D 30 58.00 79.77 ± 14.54 115.00 18.23 80-90
Age hour 30 12.00 37.43 ± 17.63 84.00 47.09
-Volume L 30 19.00 35.33 ± 7.54 50.00 21.34 30
Calcium chloride Volume mL.100L-1 30 28.20 30.43 ± 0.65 31.97 2.13 30
Rennet Volume g 30 10.00 10.93 ± 0.06 12.00 4.33 9-12
T°C addition °C 30 37.00 37.30 ± 0.47 38.00 1.25 37-38
Time spent
Coagulation Min 30 10.00 15.37 ± 1.83 20.00 11.90 10.00-15.00
Between cuts Min 30 30.00 48.77 ± 10.02 66.00 20.55 50.00
Ferm1Tb min 30 103.00 165.27 ± 33.53 223.00 20.29 90.00
Ferm2Tc min 30 200.00 266.47 ± 32.10 340.00 12.05 210.00 – 240.00
Stretching min 30 34.00 45.60 ± 6.92 59.00 15.18 45.00
Totald min 30 235.00 301.10 ± 32.53 370.00 10.80 300.00
Average pH of the curd stretching - 22 4.79 5.02 ± 0.16 5.40 3.20 4.95-5.10
Production
Curd kg 28 143.08 187.92 ± 20.52 224.35 10.92
-Mozzarella cheese
kg 30 108.70 156.80 ± 14.29 177.80 9.11 150-165
Whey L 30 411.37 545.91 ± 82.33 873.81 15.08
into the cheese constitution. Usually this occurs due to insufficient loss of moisture through the whey or its exaggerated aggregation to the rennet/curd at the time of stretching; the reverse is also
true for the use of a high volume of milk (> 5.0 L•kg-1).
Citro (2010) argues that the stretched cheese yield varies according to its composition, processing type and moisture of the final product. Hence, for the ideal yield range, the cheesemaker can maintain the desirable characteristics of mozzarella, particularly in terms of balancing the composition, humidity (important for tenderness and flavor) and water activity (important for product’s shelf life).
The unit L•kg-1 is a practical way to express yield in the daily
routine of industries. However, because the milk component content varies, and consequently density also varies, the adjusted
kg•kg-1 form to represent milk density can more accurately
represent the yield of lots and the differences between them. Table 4 shows the results for mozzarella yield monitored in two
units of measurement - L•kg-1 and kg•kg-1.
For the overall average, the yield found of 4.89 kg•kg-1 (which
corresponds to 4.74 L•kg-1), was within the recommended amount
for mozzarella obtained from buffalo milk by Citro (2010) and
the dairy industry’s goals (above 4.5 and below 5.0 L•kg-1), and
can be tied to the good physico-chemical quality of the milk used as raw material in producing the mozzarella.
It was observed that 76.67% of the lots reached a yield
lower than 5.0 L•kg-1, and less than half of the monitored lots
(40%) reached the goal. These lots may have been produced with different moisture content from the ideal amount, which is not desirable when seeking optimal quality of the product, especially regarding softness, taste and shelf life.
3.4 Recovery of constituents in whey
As the cheese has higher added value in relation to the milk itself, the ideal situation is to take advantage of the milk components as much as possible. Therefore, knowledge about the recovery of milk constituents through whey, in percentage
terms, is a valuable tool in the context of industrial efficiency, because it indicates how much of the milk solids have been incorporated into the cheese curd and how much was lost in the whey.
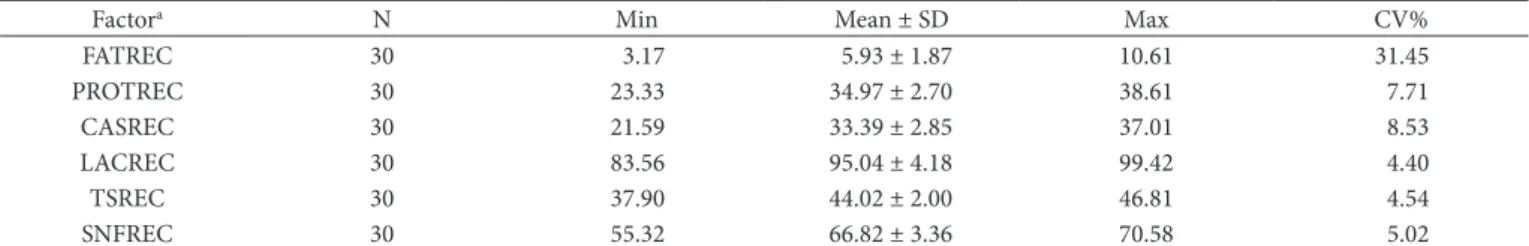
Table 5 describes the percentage of recovery of milk constituents in mozzarella cheese whey. About 80% of the milk volume used for manufacturing mozzarella results in whey (Table 3), containing almost half of the total and non-fat solids from milk (Table 5). The protein and fat constituents were lost less in the process when compared to lactose (Table 5). Although part of lactose is consumed by microorganisms during the process, the high loss of this constituent through the whey is natural, which suggests that most of the lost solids were related to low lactose utilization.
Through a detailed study on the genetic relationship between milk coagulation properties, the recovery of constituents and the yield, Cecchinato & Bittante (2016) indicate that the protein and fat recovery in cheese is an important tool for the technological properties, quantity and quality of cheese. The study reports that protein recovery is a highly heritable trait that is strongly related to yield, proving to be an important element to be considered when seeking to increase cheese manufacturing efficiency.
Casein is the component of milk which has the greatest functional relationship with cheese yield, and therefore it is the most important component from the industrial point of view. As it represents approximately 78% of the total protein of milk (Table 1), it can be inferred that the use of total protein values over 60% were a result of the high casein recovery, which is evidenced by the low values of PRDTREC and CASREC, both close to 30%.
For comparison purposes of efficiency, it is interesting to consider reference values concerning the same product, and if possible, with the same or very similar processing, as the quality of raw material, handling and manufacturing process are factors that have a strong influence on the utilization efficiency of milk constituents. However, it can also be observed that the proportion of FAT (FATREC) and TDTPRD (PRDTREC) losses
Table 4. Number of observations (N), mean values, standard deviation (SD), minimum (Min) and maximum values (Max) and coefficient of
variation (CV%) of mozzarella cheese yield.
N Min Mean ± SD Max CV% D.P
Mozzarella Yield (L.kg-1) 30 4.13 4.74 ± 0.40 5.90 8.44 0.40
Mozzarella Yield (kg.kg-1) 30 4.16 4.89 ± 0.42 6.09 8.58 0.42
Table 5. Number of observations (N), mean values, standard deviation (SD), minimum (Min) and maximum values (Max) and coefficient of
variation (CV%) of milk constituent recovery from mozzarella cheese whey.
Factora N Min Mean ± SD Max CV%
FATREC 30 3.17 5.93 ± 1.87 10.61 31.45
PRDTREC 30 23.33 34.97 ± 2.70 38.61 7.71
CASREC 30 21.59 33.39 ± 2.85 37.01 8.53
LACREC 30 83.56 95.04 ± 4.18 99.42 4.40
TSREC 30 37.90 44.02 ± 2.00 46.81 4.54
SNFREC 30 55.32 66.82 ± 3.36 70.58 5.02
aFATREC = recovery of fat; PRDTREC = recovery of protein; CASREC = recovery of casein; LACREC = recovery of lactose; TSREC = recovery of total solids; SNFREC = recovery of
found were below that found by Lima et al. (2014), who detected a 16.73% fat recovery and 35.61% of total protein recovery in whey obtained by enzymatic coagulation of buffalo milk in the same dairy industry as this study.
Cecchinato & Bittante (2016) identified that variations in FAT recovery have much to do with the milk coagulation time (curd firmness x time), especially during the last firming phase (about 45 minutes after the addition of rennet).
As the curd suffers fat and protein losses during the stretching process after being separated from the whey, the REC results do not indicate the actual content in the cheese. However, these values observed for REC can be understood as an everyday guide for the dairy industry, as they help in investigating processing efficiency and are complementary to yield, which is already used in management and decision-making processes of companies.
Understanding milk constituent recovery from whey and the production yield allows the dairy industry to have greater control over efficiency and better standardization of physical, chemical and organoleptic characteristics of mozzarella cheese, thus ensuring stability in quality to the consumer.
Even with SCC being above what is suggested by literature, it was possible to achieve raw materials and mozzarella yield within the expected range. However, it is known that milk composition in physicochemical terms and SCS (SCC), as well as factors from the manufacturing process and the percentage recovery of solids from whey (REC) are aspects that have a potential effect on yield in the industry, suggesting that more detailed studies should be done in this logic.
4 Conclusions
Buffalo milk used by the dairy industry had satisfactory physicochemical characteristics and was in accordance with the revised literature. The manufacturing of mozzarella cheese was efficient in terms of yield and milk constituent use. The control of processing factors mainly related to starter culture and elapsed times for each step is necessary for the industry to obtain a more uniform efficiency in the production of mozzarella cheese lots.
References
Associação Brasileira dos Criadores de Búfalos – ABCB. (2014). Laticínios: derivados de leite de búfalas. São PauloI: ABCB . Retrieved from httpI://www.bufalo.com.br/laticinios.html
Bernardes, D. (2007). Bubalinocultura no BrasilI: situação e importância econômica. Revista Brasileira de Reprodução Animal, 31(3), 293-298. Castro, K. A., Silva, K. A. L., Pereira, A. I. A., & Drsine, J. V. (2014). Efeito da contagem de células somáticas sobre a qualidade dos queijos prato e mussarela. Revista Brasileira de Tecnologia Agroindustrial., 8(1), 1237-1250. httpI://dx.doi.org/10.3895/S1981-36862014000100009. Cecchinato, A., & Bittante, G. (2016). Genetic and environmental relationships of different measures of individual cheese yield and curd nutrients recovery with coagulation properties of bovine milk. Journal of Dairy Science, 99(3), 1975-1989. PMidI:26805996. httpI:// dx.doi.org/10.3168/jds.2015-9629.
Citro, A. (2010). Classificazione dei formaggi a pasta filata e tecnologia di produzione. AIVEMP Newsletter, 7(1)I:8-12. Retrieved from httpI://cms.aivemp.it/SiteTailorCommon/showBinary.aspx?id=4731 Costa, M. H. B. Fo., Lima, D. M. Jr., Rangel, A. H. N., Silva, F. J. S.,
Novaes, L. P., Galvão, J. G. B. Jr., Silva, M. J. M., & Moreno, G. M. B. (2014). Sazonalidade e variação na qualidade do leite de búfalas no Rio Grande do Norte. Acta Veterinaria Brasilica, 8, 201-208. Furtado, M. M., & Pombo, A. F. W. (1979). Fabricação de queijo prato
e minasI: estudo do rendimento / parte I - determinação das cifras de transição. Revista do Instituto de Laticínios Cândido Tostes, 34(205), 1-48.
Lima, T. C. C., Rangel, A. H. N., Macedo, C. S., Araújo, T. P. M., Araújo, V. M., Lima, , D. M., Murmann, L., & Novaes, L. P. (2014). Composição e qualidade do leite e do soro do leite de búfalas no estado do Rio Grande do Norte. Acta Veterinaria Brasilica, 8, 25-30. Mazal, G., Vianna, P. C. B., Santos, M. V., & Gigante, M. L. (2007).
Effect of somatic cell count on prato cheese composition. Journal of Dairy Science, 90(2), 630-636. httpsI://doi.org/10.3168/jds.S0022-0302(07)71545-X.
Pizauro, L. J. L., Silva, D. G. S., Santana, A. M., Morais, S. M. A., Benincasa, N. C., & Fagliari, J. J. (2014). Perfil bioquímico, inclusive proteinograma, do soro lácteo de búfalas primíparas e pluríparas sadias ao longo da lactação. Pesquisa Veterinaria Brasileira, 34(Suppl. 1), 79-86. httpI://dx.doi.org/10.1590/S0100-736X2014001300015. Rangel, A. H. N., Dliveira, J. P. F., Araújo, V. M., Bezerra, K. C., Medeiros,
H. R., Lima, D. M. Jr., & Araújo, C. G. F. (2011). Influência do estádio de lactação sobre a composição do leite de búfalas. Acta Veterinaria Brasilica, 3, 306-310.
Rossi, D. A., Abreu, L. R., Furtado, M. M., & Moura, C. J. (1998). Utilização do coalho bovino e coagulantes microbiano e genético na composição e rendimento do queijo Minas Frescal. Revista do Instituto do Laticínio Candido Tostes, 53(305), 8-14.
SAS Institute Inc. (2003). User’s Guide versão 9.1.3 versão para Windows. CaryI: SAS Institute Inc.
Shook, G. G. (1982). Approaches to summarizing somatic cell count which improve interpretability. In Proceedings of the Nacional Mastitis Council Annual Meeting Pennsylvania. Madison.
Soares, A. D., Rangel, A. H. N., Novaes, L. P., Lima, D. M. Jr., & Bezerra, K. C. (2013). Composição do leite de búfala em diferentes ordens de parto. Agropecuária Científica no Semi-Árido, 9(4)I:56-64. Sollecito, N. V., Lopes, L. B., & Leite, R. C. (2011). Contagem de células
somáticas, perfil de sensibilidade antimicrobiana e microrganismos isolados de mastites em búfalosI: uma breve revisão. Revista Brasileira de Medicina Veterinária, 33(1), 18-22.
Teixeira, L. V., Bastianetto, E., & Dliveira, D. A. A. (2005). Leite de búfala na indústria de produtos lácteos. Revista Brasileira de Reprodução Animal, 29, 96-100.
Tonhati, H., Mendoza-Sánchez, G., Sesana, R. C., Aspilcueta Borquis, R. R., & Galvão de Albuquerque, L. (2008). Programa de mejoramiento genético de búfalos. Revista Argentina de Producción Animal, 28, 53-67. Tripaldi, C., Palocci, G., Miarelli, M., Catta, M., Drlandini, S., Amatiste, S., Bernardini, R., & Catillo, G. (2010). Effects of Mastitis on Buffalo Milk Quality. Asian-Australasian Journal of Animal Sciences, 23(10), 1319-1324. httpI://dx.doi.org/10.5713/ajas.2010.90618.