ABSTRACT
RESUMO
Submitted on May 29th, 2015 and approved on July 19th, 2016.
1 Experiment on the scope of projects GeoDegrade, GeoRastro and GeoPecus financed by Embrapa. 2 Embrapa Gado de Leite, Juiz de Fora, Minas Gerais, Brazil. ricardo.andrade@embrapa.br
3 Embrapa Monitoramento por Satélite, Campinas, São Paulo, Brazil. heriberto.teixeira@embrapa.br; janice.leivas@embrapa.br; sandra.nogueira@embrapa.br
*Corresponding author: ricardo.andrade@embrapa.br
Analysis of evapotranspiration and biomass in pastures with degradation
indicatives in the Upper Tocantins River Basin, in Brazilian Savanna
1The objective of this study was to apply the Simple Algorithm For Evapotranspiration Retrieving (SAFER) with MODIS images together with meteorological data to analyze evapotranspiration (ET) and biomass production (BIO) according to indicative classes of pasture degradation in Upper Tocantins River Basin. Indicative classes of degraded pastures were obtained from the NDVI time-series (2002-2012). To estimate ET and BIO in each class, MODIS images and data from meteorological stations of the year 2012 were used. The results show that compared to not-degraded pastures, ET and BIO were different in pastures with moderate to strong degradation, mainly during water stress period. Therefore, changes in energy balance partition may occur according to the degradation levels, considering that those indicatives of degradation processes were identified in 24% of the planted pasture areas. In this context, ET and BIO estimates using remote sensing techniques can be a reliable indicator of forage availability, and large-scale aspects related to the degradation of pastures. It is expected that this knowledge may contribute to initiatives of public policies aimed at controlling the loss of production potential of pasture areas in the Upper Tocantins River Basin in the state of Goiás, Brazil.
Key words: degraded pastures; land use; remote sensing; SAFER.
Ricardo Guimarães Andrade2*, Antônio Heriberto de Castro Teixeira3, Janice Freitas Leivas3, Sandra Furlan Nogueira3
10.1590/0034-737X201663060002
Análise da evapotranspiração e da biomassa em pastagens com indicativos
de degradação na bacia do Alto Tocantins
O presente estudo objetivou aplicar o Simple Algorithm For Evapotranspiration Retrieving (SAFER) juntamente com imagens MODIS e dados meteorológicos para analisar a evapotranspiração (ET) e a produção de biomassa (BIO) de acordo com classes indicativas de degradação das pastagens na bacia hidrográfica do Alto Tocantins. Classes indicativas de pastagens degradadas foram obtidas a partir de série temporal de NDVI (2002 a 2012). Para estimar a ET e a BIO em cada classe, imagens MODIS e dados de estações meteorológicas do ano de 2012 foram utilizados. Os resultados indicam que, em relação às pastagens não degradadas, a ET e a BIO apresentaram diferenças, principalmente no período de estresse hídrico, nas pastagens com indicativo de degradação moderado e forte. Assim, alterações na partição do balanço de energia podem ocorrer de acordo com os níveis de degradação, haja vista que indicativos de processos de degradação foram identificados em 24% das áreas de pastagens plantadas. Nesse contexto, as estimativas de ET e BIO por meio de técnicas de sensoriamento remoto pode ser um bom indicador da disponibilidade de forragem e, consequentemente, de aspectos relacionados à degradação das pastagens em larga escala. Espera-se que esse conhe-cimento possa contribuir para iniciativas de políticas públicas voltadas para o controle da perda do potencial produtivo das áreas de pastagens na bacia do Alto Tocantins, Estado de Goiás.
INTRODUCTION
Upper Tocantins River Basin has undergone increasing changes in the use and occupation of land as the agricultural frontier has been expanding. Livestock is one of the agricultural activities that generate thousands of direct and indirect jobs and has a significant share of the gross domestic product. However, it is essential to combine development and economic growth with environmental sustainability, since a significant part of cultivated pastures shows some indications of degradation (Andrade et al., 2013b).
Therefore, the application of remote sensing techniques on a large scale may help in a dynamic manner to diagnose and to obtain indicators relating to economic and environmental sustainability of pasture areas, contributing, for example, with Low-Carbon Agriculture Program (LCAP), which predicts several mitigating actions of greenhouse effect gas emission (GHGs). Thus, it should be highlighted that some studies have successfully applied the data of orbital remote sensing to identify and to monitor plant conditions by means of vegetation indices, such as the Enhanced Vegetation Index (EVI) and the Normalized Difference Vegetation Index (NDVI). Moreover, evapontranspiration (ET) and plant biomass (Bio) can also be estimated via remote sensing and, for that, algorithms and models are implemented.
Simple Algorithm For Evapotranspiration Retrieving (SAFER) is a simplified algorithm that has shown good results in the estimation of ET and Bio at a large scale (Teixeira et al., 2013a). This algorithm has the advantage of not requiring the use of thermal band and it can be applied with meteorological data from different types of stations (agrometeorological, conventional and automatic stations). This is an important characteristic because it allows the evaluation of historical trends of the components of energy balance and water productivity on a large scale over the years since automatic sensors are relatively recent developments in instrumental technology (Teixeira et al., 2013b).
Thus, the objective of this study was to apply the algorithm SAFER and MODIS images along with weather station data to analyze the ET and Bio according to degradation indicative classes of pasture production potential in the Upper Tocantins river basin.
MATERIAL AND METHODS
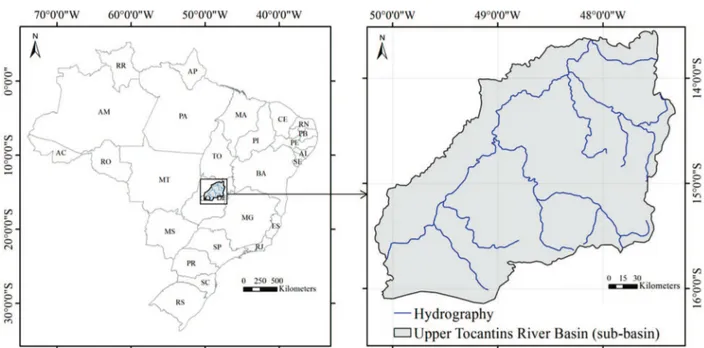
The study area (53,904 km2) comprises the sub-basins
of the Tocantinzinho River and Das Almas River, which belong to the Upper Tocantins River basin, located in the State of Goiás (Figure 1).
The average temperatures in this region vary between 21 and 25 °C and average rainfall varies from 1100 to 1700 mm. The rainiest season is usually from November to February and the least rainy season is from May to August
(Ferreira & Tokarski, 2007). Regarding the soil, Oxisols, Ultisols and Cambisols prevail in the area.
To obtain the indicative classes of degraded pastures, NDVI product (16-day synthesis) from the MODIS (Moderate Resolution Imaging Spectroadiometer) sensor was used for the period from January 2002 to December 2012. From the NDVI data time series, linear regression analysis was used to simulate the trend of positive or negative changes in pasture areas. Stow et al. (2003) adopted this method to simulate the change rate of vegetation “greenness”. Annual maximums NDVI linear trends were estimated by applying the ordinary least-squares regression, in which Slope is the slope coefficient of the regression line adjusted on each pixel. Slope > 0 indicates that the vegetation is in recovery process, while Slope < 0 indicates the occurrence of a degradation process.
(1)
Where n is equal to 11 due to the use of NDVI data series referring to the period from 2002 to 2012; i is year 1 to 2002, year 2 to 2003 up to year 11 for 2012;
Y
NDVIi is the maximum value of NDVI for the year i.The slope was used to evaluate the change in NDVI over the series as a whole. It was considered that the pastures had some degradation indicatives when the slope coefficient (Slope) was less than – 0.001 (Liu et al., 2010; Andrade et al., 2013a). From this value, indicative classes of pasture degradation were established as it is shown in Table 1.
For pasture areas with degradation indicatives, algorithm SAFER was applied and evapotranspiration (ET) was estimated in each class. For that purpose, a series of MODIS images of the year 2012 along with weather station data provided by the National Institute of Meteorology (INMET) were used. Regarding SAFER, the surface albedo (α0) from
the bands 1 and 2 of MODIS with spatial resolution of 250 m:
α0 = a + bα1 + cα2 (2) Where, α1 and α2 are reflectances in the spectral range of bands 1 and 2 in the MODIS sensor and a, b and c are regression coefficients and present the values of 0.08, 0.41 and 0.14, respectively (Teixeira et al., 2013a). However, surface temperature (To) was estimated as a residue of the equation of the daily net radiation (Rn), described by:
(3)
Where á0 is the surface albedo; is the atmospheric transmissibility; is the incident shortwave radiation;
(4)
Where, β and η are the regression coefficients, with values of 1.8 and – 0.008, respectively (Teixeira et al., 2013a) and ETo is the control evapotranspiration given in millimeters per day (mm d-1), Penman-Monteith method, according to
FAO bulletin number 56 (Allen et al., 1998).
(5)
Where, Rn is the radiation net at the surface (MJ m-2 day-1),
G is the soil heat flux density (MJ m-2 day-1), T is the average
daily air temperature (ºC), u2 is the wind speed at 2 meters of height (m s-1), e
s is the saturation pressure of air vapor
(kPa), ea is the real air vapor pressure (kPa), es – ea is the air vapor saturation pressure deficit (kPa), ∆ is the curve declivity of air vapor pressure in the atmosphere (kPa ºC-1)
and γ is the psychometric constant (kPa ºC-1).
Then, vegetation biomass accumulation was calculated for a particular period:
(6)
Where Bio is the biomass vegetation accumulation (kg ha-1),
is the maximum efficiency of radiation use, considering the value 2.5 g MJ-1 (Bastiaanssen & Ali, 2003), E
f is the
ratio between latent heat flux (λE, in W m-2) and radiation
net (Rn, W m-2) (Teixeira et al., 2012).
In this case, of the pasture was achieved by means of ET values when transforming unit mm d-1 into W m-2. However,
APAR parameter is the absorbed photosinthetically active radiation (W m-2) and it was estimated by using the
equation (Teixeira et al., 2009):
APAR = (-0.161 + 1.257 x NDVI) x 0.44 x R
G (7) Where, RG is the incident global solar radiation (W m-2)
and scalar 0.44 is the percentage of RG concerned to the photosinthetically active radiation (PAR).
RESULTS AND DISCUSSION
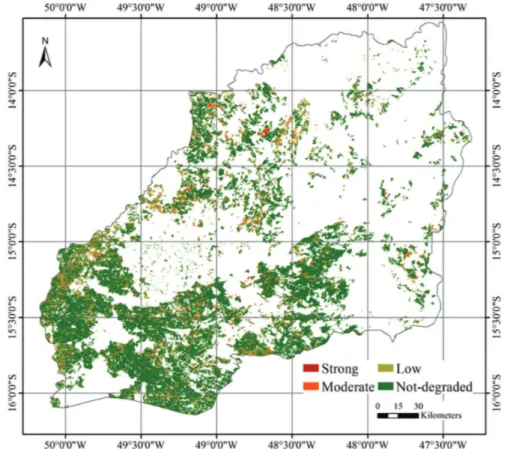
Figure 2 shows the map with degradation indicative classes of planted pastures in the region of the Upper Tocantins River Basin, in the State of Góias.
According to the methodology applied in this study, it was identified that about 24% (383,290 ha) of planted pasture areas present some degradation indicatives. In addition, these degraded areas are spatially distributed over pastures. However, it is noteworthy that, indicatives of strong degradation (red color) are concentrated in the pastures located in the north and middle-south of the Upper Tocantins River basin. These results are consistent with a study carried out by Andrade et al. (2013a), for pastures areas in the State of Goiás, when NDVI data time series from Spot-Vegetation sensor were used.
Figure 1: Area of Tocantinzinho and Das Almas River sub-basin belonging to Upper Tocantins River Basin.
Table 1: Indicative classes of pasture degradation according to
intervals of slope coefficients set in each condition
Class Interval
Strong Slope < - 0.013
Moderate - 0.013 d < Slope < - 0.005
Low - 0.005 < Slope < - 0.001
For each degradation indicative class (Figure 2), average values of monthly evapotranspiration (ET) and biomass in the pasture were estimated by means of MODIS images (16-day composition) for the year 2012. Thus, it can be observed in Figure 3a that the average ET in low degradation class was very close to those values found for the pasture areas classified as not-degraded; however, in some months, the average values of low degradation class of ET were equal to or slightly above those observed for not degraded pasture. Consequently, ET average for
the 12 months in these two classes was around 45 mm month-1. Despite that, ET average for moderate to strong
degradation classes was 40 mm month-1 and 32 mm month-1
respectively. As a rule, an average value of 41 mm month -1 was found when all classes of planted pastures in the
Upper Tocantins River basin were taken into account. For areas of planted pastures in the Pantanal (Brazilian wetland) biome, Andrade et al. (2012) obtained an average daily ET of 1.50 mm d-1, which is equivalent to about 45 mm month-1.
This average was also observed by Andrade et al. (2009)
Figure 2: Degradation indicative classes of planted pastures areas in Upper Tocantins River basin in the State of Goiás.
Figure 3: (a) Average monthly evapotranspiration (ET) values for pastures classified as not-degraded, low degradation, moderate
in experimental pasture area at Embrapa Beef Cattle, Cam-po Grande, state of Mato Grosso do Sul.
By analyzing ET percentage differences of degradation indicative classes in relation to the not-degradet class, (Figure 3b), it is noted that for low degradation class, the differences ranged from 0 to 6%, with an annual average of 2.80%. In the moderate degradation class, those differences were between 1.7 and 14.8%, with an annual average of 8.3%. However, for strong degradation class, the average was at the order of 32.2%, with minimum and maximum values of 17.8% and 59.2%, respectively. In general, the largest differences occurred in the months from September to October and the lowest were those observed from February to March. Moreover, it is highlighted that in August, ET values were equal for pastures classified as low degradation and not degraded.
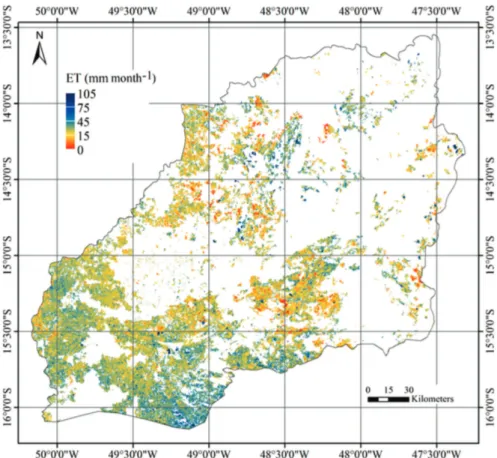
Figure 4 shows the map of monthly average ET of pastures estimated for the year 2012. The highest ET values (> 100 mm month-1) are represented by shades of
dark blue and the lowest are identified by shades of red (< 10 mm month-1). Low ET values are more frequently
observed in pastures in the north-central portion and southeast of the Upper Tocantins River basin. When evaluating water availability in degraded pastures in Cer-rado Cuiabana Lowlands from April, 2009 to December 31st, 2012, Oliveira (2013) found average ET around 2.0
mm d-1 (equivalent to 60 mm month-1). However, in the
months of July, August and September of 2011, the average ET obtained from the Bowen ratio method showed values close to zero, in which case the author points out that in 2011, only in September, a small report of rainfall was made. Thus, it is found that ET is strongly dependent upon soil moisture, or low water availability in the soil affects the amount of energy that is partitioned and likely to reduce the amount of energy for latent heat flux (LE), increasing energy partition aimed at sensible heat flux (H). This result was also reported by Meirelles et al. (2003), in a study using Bowen ratio in Brachiaria brizantha cv. Marandu pasture located in the central region of the Brazilian Savannah (Cerrado) (Planaltina, GO), where they obtained average ET of 5.19 mm d-1 for
the beginning of the rainy season and showed that in this period, most of the available energy was designed for processes of evapotranspiration.
It is observed in Figures 5a and 5b that during the months of 2012, the average Bio values were very close for pastures of not-degrated and low degradation classes. In addition, in some months, the low degradation class presented Bio values equal to or higher than those found for the not-degraded class. Among these classes (green line), except for October (7.0%), the percentage average of absolute difference of Bio was less than 5.0%, which
Figure 4: Evapotranspiration (ET) of pastures in Upper Tocantins River basin. Average month values estimated based on the results
emphasizes that the annual average difference was 3.8%. In these classes, average Bio production was estimated around 1550 kg ha-1 month-1, where the maximum (~ 2650
kg ha-1 month-1) and minimum (~ 390 kg ha-1 month-1) for
Bio were found in March and September, respectively. In 2012, Bio average production of pasture in moderate and strong degradation classes was 1400 and 965 kg ha-1
month-1, respectively, however, for the class of moderate
deterioration in March and September, the highest (~ 2490 kg ha-1 month-1) and the lowest (~ 330 kg ha-1 month-1)
values of Bio were found. As for the strong degradation
class, the highest and the lowest Bio values were recorded in February (~ 1875 kg ha-1 month-1) and September (~ 170
kg ha-1 month-1), respectively. By comparing Bio values of
the not-degraded and strong degradation classes, a minimal and maximal percentage difference of 26 and 63%, respectively (Figure 5b), were found.
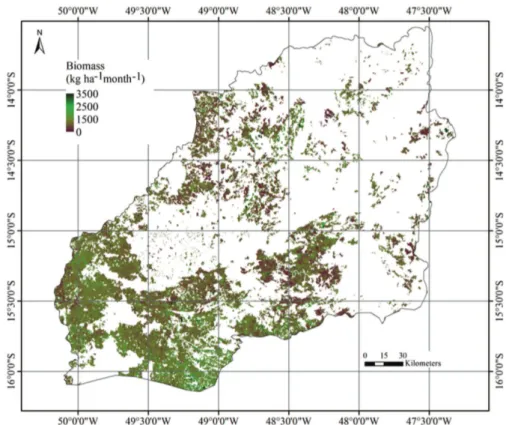
The average Bio estimated based on the results obtained for the 12 months of 2012 can be viewed on the map in Figure 6. A large spatial variability of Bio is seen but larger spots of pastures represented in green shades, that is, areas with the best conditions in terms of Bio can be
Figure 5: (a) monthly average biomass (kg ha-1 month-1) for classes of not degraded, low degradation, moderate degradation and strong
degradation pastures; (b) percentage average of absolute difference of biomass of not degraded pastures in relation to pastures with indicatives of low, moderate and strong degradation in the Upper Tocantins River basin in the State of Goiás.
Figure 6: Biomass of pastures in Upper Tocantins River Basin. Average values estimated based on the results obtained for 12 months
seen towards the south of the basin. However, in the north and south-central region of the basin, pasture areas with lower average Bio and represented in shades of green-brown stood up. In this context, Zanchi et al. (2009) state that pasture Bio presents a well-defined seasonal cycle, influenced by variations in climate and water availability in the soil. The authors also report that grazing intensity may reduce as well as enhance pasture growth. For Kichel et al. (2012), a degraded pasture may have less than 50% of its productive potential in relation to soil and climatic conditions of the site where it was set and to the species or forage cultivar used.
In general, the great variability of ET and Bio values are highlighted in 2012. This marked variation influenced the average monthly production of pastures during the year (Figure 6). In this case, pasture management (such as over grazing), presence of invasive plants and climate variability throughout the year are some of the factors that may have influenced these results.
CONCLUSIONS
Significant differences between ET and Bio were found on the pastures areas according to degradation indicative classes. Those differences were more marked in the water stress period, particularly in pastures classified as moderate to strong degradation indicative.
The estimated plant biomass from remote sensing techniques may be a reliable indicative of forage availability and therefore of aspects related to large-scale degradation of pastures.
These results points to changes in energy balance partition according to the loss of productive potential of grazing areas, since indicative of degradation was identified in 24% of areas of planted pastures.
Such knowledge is expected to contribute to public policy initiatives aimed at controlling the loss of productive potential of grazing areas in the Upper Tocantins River basin, in the State of Goiás.
REFERENCES
Allen RG, Pereira LS, Raes D & Smith M (1998) Crop Evapotranspiration: Guidelines for Computing Crop Water Requirements. Rome, FAO Irrigation and Drainage. 300p. (Paper, 56)
Andrade RG, Batistella M, Amaral TB & Menezes SJMC (2009) Análise preliminar da variabilidade espacial da evapotranspiração de pastagens com o uso de imagens orbitais. In: 7º Congresso Brasileiro de Agroinformática, Viçosa. Anais, SBIAGRO. 5p.
Andrade RG, Leivas JF, Garçon EAM, Silva GBS, Gomes D, Vicente LE, Bolfe EL & Victoria DC (2013a) Indicativo de degradação de pastagens a partir de dados Spot Vegetation. In: XVI Simpósio Brasileiro de Sensoriamento Remoto, Foz do Iguaçu. Anais, SELPER Brasil/INPE. p.6917-6922.
Andrade RG, Rodrigues CAG, Sanches ID, Torresan FE & Quartaroli CF (2013b) Uso de técnicas de sensoriamento remoto na detecção de processos de degradação de pastagens. Engenharia na Agricultura, 21:234-243.
Andrade RG, Sediyama GC, Paz AR, Lima EP & Facco AG (2012) Geotecnologias aplicadas à avaliação de parâmetros biofísicos do Pantanal. Pesquisa Agropecuária Brasileira, 47:1227-1234.
Bastiaanssen WGM & Ali S (2003) A new crop yield forecasting model based on satellite measurements applied across the Indus Basin, Pakistan. Agriculture Ecosystems & Environment, 94:321-340.
Ferreira EB & Tokarski DJ (2007) Bacia hidrográfica do Alto Tocantins – retrato e reflexões. Disponível em: <http:// d3nehc6yl9qzo4.cloudfront.net/downloads/baciahidrografica-doaltoto_retratoereflexoes_07_08_2007.pdf>. Acessado em: 29 de maio de 2015.
Kichel NA, Costa JAA & Almeida RG (2012) Vantagens da recu-peração e renovação de pastagens degradadas com a utilização de sistemas integrados de produção agropecuária. Revista Agro & Negócios, 11:48-50.
Liu S, Wang T, Guo J, Qu J & AN P (2010) Vegetation change based on SPOT-VGT data from 1998-2007, northern China. Environmental Earth Science, 60:1459-1466.
Meirelles ML, Farias SEM & Franco AC (2003) Balanço de ener-gia de uma pastagem cultivada no Cerrado. Planaltina, Embrapa Cerrados. 14p. (Boletim de Pesquisa e Desenvolvimento, 81).
Oliveira RG (2013) Avaliação da disponibilidade de água em pasta-gem degradada em uma área de Cerrado na Baixada Cuiabana. Dissertação de Mestrado. Universidade Federal de Mato Grosso, Cuiabá. 44p.
Stow D, Daeschner S, Hope A, Douglas D, Petersen A, Myneni R, Zhou L & Oechel W (2003) Variability of the seasonally integrated normalized difference vegetation index across the north slope of Alaska in the 1990s. International Journal of Remote Sensing, 24:1111-1117.
Teixeira AHC, Scherer-Warren M, Hernandez FBT, Andrade RG & Leivas JF (2013a) Large-Scale Water Productivity Assessments with MODIS Images in a Changing Semi-Arid Environment: A Brazilian Case Study. Remote Sensing, 5:5783-5804.
Teixeira AHC, Hernandez FBT, Lopes HL, Scherer-Warren M & Bassoi LH (2013b) Modelagem espaço temporal dos compo-nentes dos balanços de energia e de água no Semiárido brasileiro. Campinas, Embrapa Monitoramento por Satélite. 32p. (Docu-mentos, 99)
Teixeira AHC, Scherer-Warren M, Hernandez FBT & Lopes HL (2012) Water productivity assessment by using MODIS images and agrometeorological data in the Petrolina municipality, Brazil. Disponível em: <http://proceedings.spiedigitallibrary.org/ proceeding.aspx?articleid=1386128>. Acessado em: 29 de maio de 2015.
Teixeira AHC, Bastiaanssen WGM, Ahmad MD & Bos MG (2009) Reviewing SEBAL input parameters for assessing evapotranspiration and water productivity for the Low-Middle São Francisco River basin, Brazil – Part B: Application to the large scale. Agricultural and Forest Meteorology, 149:477-490.