Setembro, 2018
Liliana Andreia dos Santos Ferreira
Licenciada em Bioquímica
A contribution to the valorisation of a maritime plant:
the
Corema album
(L.) D. Don
Dissertação para obtenção do Grau de Mestre em Fitotecnologia Nutricional para a Saúde Humana
Orientador: Aida Maria Gonçalves Moreira da Silva, Professora Coordenadora, ESAC
Co-orientador: Fernando Henrique da Silva Reboredo, Professor Auxiliar com Agregação, FCT/UNL
Júri:
Presidente: Fernando José Cebola Lidon
Vogais: Vânia Sofia Santos Ribeiro
A contribution to the valorisation of a maritime plant: the Corema album (L.) D. Don
Copyright © Liliana Andreia dos Santos Ferreira, Faculdade de Ciências e Tec-nologia, Universidade Nova de Lisboa.
i Acknowledgements
I would like to thank my master’s coordinator and also dissertation coordi-nator professor Fernando Reboredo for having always welcomed me. It was thanks to all his help that I chose the master's degree in which I am and was also he who sought a dissertation study that was exactly what I would like to do, to study plants and their applications for health.
I would also like to thank my dissertation coordinator in Coimbra College of Agriculture, professor Aida Moreira da Silva, for having received and inte-grated me in her study in white crowberry.
Thank you to professor Maria João Barroca who has always helped me in the studies that were developed throughout this work and being always availa-ble to clarify any questions.
Thanks to the researchers Ana Batista de Carvalho and Adriana Mamede from the Molecular Physical Chemistry R&D Unit of the University of Coimbra who received and helped me in the study developed in a cancer cell line.
Thank you to laboratory assistant Sandrine da Ressurreição for integrating me in her laboratory and for the help in the nutritional characterization of the berries.
A special thanks to superior technician Rosa Guilherme for having wel-comed me and introduced me to the people with whom I would work in Coimbra College of Agriculture, and also for supporting me during all the time spent in Coimbra.
Thank you to auxiliary researcher António Eduardo Leitão for making it possible to carry out the chromatography present in this work.
Thank you to professor Ana Margarida Urbano for always being so kind and helping me during my time in the Molecular Physical Chemistry R&D Unit of the University of Coimbra.
For all the sympathy, kindness and friendship since the first day, and for always helping and accompanying me during all this work, a special thanks to my co-worker and dear friend Joana Romano. I'm very grateful to have met her and for our friendship.
ii A very special thank you to my boyfriend, André Carvalho, for always be-ing by my side in everythbe-ing and for supportbe-ing me so much. Thank you also for reading my work and helping me so much with it.
For being my lovely friend and supporting me at all times, thank you Cláudia Ferreira. Your company and huge help during all my academic life cre-ated so many wonderful memories.
Thank you to Maria Tavares for also helping me with this work and always care so much about my academic works. Thank you too Pedro Bragança and Lili-ana Carvalho for always being ready to help me.
iii
Summary
Corema album is an endemic maritime plant of the Iberian Peninsula that can be found in sandy dunes along the Portuguese maritime coast. The shrub and its white berries, white crowberries, have long been known, being the berries tra-ditionally harvested and consumed along the Atlantic littoral. However, alt-hough the berries are a source of nutrients and distinct from other berries because of their colour and acidic taste, they are not currently commercially exploited. The aim of this study was to contribute to the valorisation of C. album by deter-mining the nutrient profile of its berries and addressing the phytochemical po-tential of the plant by quantification of total phenolic compounds content, in par-ticular flavonoids, of extracts made with its berries and leaves. The plant showed to be a source of phenolic compounds, and the results suggest that C. album leaves extracts have a higher potential as a source of total phenolic compounds and flavonoids than the berries extracts.
Another aim of this study was to determine the phytochemical potential of the plant by measuring the antioxidant activity of extracts made with its berries and leaves. The extracts have antioxidant activity, being the antioxidant activity of the leaves extracts slightly superior.
iv and 5-CQA, and contains ferulic acid. The results show that the berries extract is a better source of caffeic acid, chlorogenic acid and its isomers, 4-CQA and 5-CQA, and the leaves extract is a better source of trigonelline and ferulic acid.
With ATR-FTIR spectroscopy results was possible to identify major classes of compounds in the lyophilized berries powder and grinded leaves samples and, in the case of the berries sample, to recognize whether a particular peak or shoulder was due to the presence of seeds in the sample.
Another aim of this study was to determine the anticancer activity of ex-tracts made with berries and leaves. The leaves extract showed to have a cyto-toxic effect against the HT-29 cancer cell line, inducing cell death, visible by a reduction of cell viability through the MTT assay and also by a reduction of cell proliferation through the SRB assay.
Foods with the addition of white crowberries were also developed, cookies and bread, which were generally well accepted by the sensory panel of non-trained panelists to which they were submitted for sensory evaluation, showing that the development of new food products may be a way to make these berries more known to the public and start being commercialized.
v
Resumo
A Corema album é uma planta marítima endémica da Península Ibérica que pode ser encontrada em zonas dunares ao longo da costa marítima portuguesa. O arbusto e a as suas bagas de cor branca, camarinhas, são há muito conhecidos, sendo as bagas tradicionalmente colhidas e consumidas ao longo do litoral atlân-tico. No entanto, apesar de as bagas serem uma fonte de nutrientes e distintas das outras bagas devido à sua cor e gosto ácido, não são actualmente exploradas comercialmente. O objectivo deste estudo foi contribuir para a valorização da C. album através da determinação do perfil nutricional das suas bagas e do poten-cial em fitoquímicos pela quantificação do conteúdo total em compostos fenóli-cos, em particular de flavonóides, de extractos das suas bagas e folhas. A planta mostrou ser uma fonte de compostos fenólicos, e os resultados sugerem que os extractos das folhas de C. album têm maior potencial como fontes de compostos fenólicos totais e flavonóides do que os extractos das bagas.
Outro objectivo deste estudo foi determinar o potencial fitoquímico da planta pela medição da actividade antioxidante de extractos das suas bagas e fo-lhas. Os extractos possuem actividade antioxidante, sendo a actividade antioxi-dante dos extractos de folhas ligeiramente superior.
vi e 5-ACQ, e contem ácido ferúlico. Os resultados mostraram que o extracto de bagas é uma melhor fonte de ácido cafeico, ácido clorogénico e os seus isómeros, 4-ACQ e 5-ACQ, e o extracto de folhas é uma melhor fonte de trigonelina e ácido ferúlico.
Com os resultados da espectroscopia por ATR-FTIR foi possível identificar as principais classes de compostos presentes nas amostras de pó de bagas liofili-zadas e de folhas trituradas e, no caso da amostra de bagas, perceber se um de-terminado pico ou ombro estava presente devido à presença de sementes na amostra.
Outro objectivo deste estudo foi determinar a actividade anticancerígena dos extractos das bagas e folhas. O extracto de folhas mostrou ter um efeito cito-tóxico contra a linha celular cancerígena HT-29, induzindo a morte celular, o que foi visível pela redução da viabilidade celular através do ensaio de MTT e tam-bém pela redução da proliferação celular através do ensaio de SRB.
Foram também desenvolvidos alimentos com a adição de camarinhas, bo-lachas e pão, que foram globalmente bem aceites pelo painel de provadores não treinados a que foram submetidos para análise sensorial, mostrando que o de-senvolvimento de novos produtos alimentares pode ser uma forma de dar a co-nhecer estas bagas ao público e de iniciar a sua comercialização.
vii
Contents
Acknowledgements ... i
Summary ... iii
Resumo ... v
Contents ... vii
List of Figures ... x
List of Tables ... xiii
1. Introduction ...1
1.1. Corema album general description ... 1
1.2. Plant potential... 2
1.3. Phytochemicals and their importance to human health ... 3
1.3.1. Phenolic compounds ... 5
1.3.2. Alkaloids ... 7
1.4. Antioxidant activity ... 7
1.5. Anticancer activity ... 8
2. Materials and Methods ... 11
2.1. Corema album berries and leaves ... 11
2.2. Preparation of Corema album berries and leaves ... 11
2.2.1. Preparation of berries ... 11
2.2.2. Preparation of leaves ... 12
2.3. Nutritional characterization of Corema album berries ... 12
2.3.1. Determination of moisture and water activity of berries ... 12
2.3.2. Crude ash determination ... 12
viii
2.3.4. Crude fibre determination ... 14
2.3.5. Crude protein determination ... 14
2.3.6. Total carbohydrates determination ... 15
2.4. Preparation of Corema album extracts ... 16
2.4.1. Preparation of extracts of lyophilised berries... 16
2.4.2. Preparation of extracts of grinded leaves ... 16
2.4.3. Determination of the concentration of all extracts made ... 16
2.5. Determination of total phenolic content of the extracts ... 17
2.6. Determination of flavonoid compounds of the extracts ... 18
2.7. Determination of antioxidant activity of the extracts ... 18
2.8. High-performance liquid chromatography analysis of phenolic compounds ... 20
2.9. Infrared spectroscopy: attenuated total reflection measurements ... 23
2.10. Cell studies ... 24
2.10.1. Preparation of the culture medium and solutions ... 25
2.10.2. Subculturing and measuring cell growth... 25
2.10.3. Filtration of extracts of berries and leaves ... 26
2.10.4. Determination of the concentration of extracts after filtration ... 26
2.10.5. Evaluation of cellular viability and proliferation ... 26
2.11. Sensory evaluation of cookies and bread with white crowberries ... 29
2.11.1. Experimental samples ... 30
2.11.2. Sensory evaluation: consumer acceptability and intention to buy ... 30
3. Results and Discussion ... 32
3.1. Preparation of Corema album berries and leaves ... 32
3.2. Nutritional characterization of berries ... 33
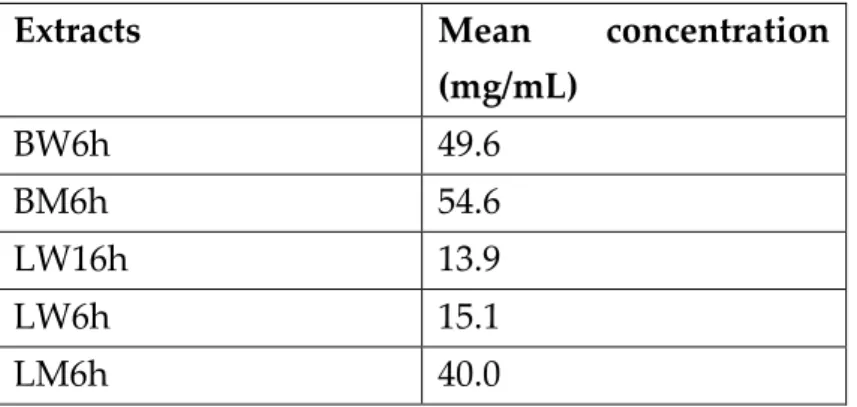
3.3. Determination of the concentration of lyophilized berries and grinded leaves ex-tracts ... 34
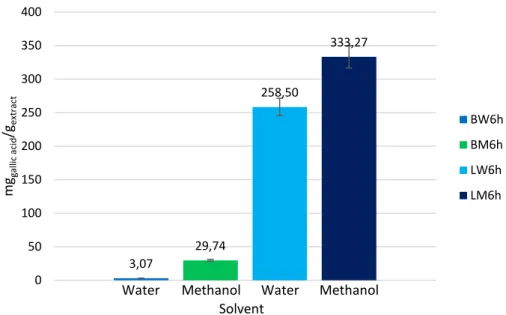
3.4. Determination of total phenolic content of the extracts ... 35
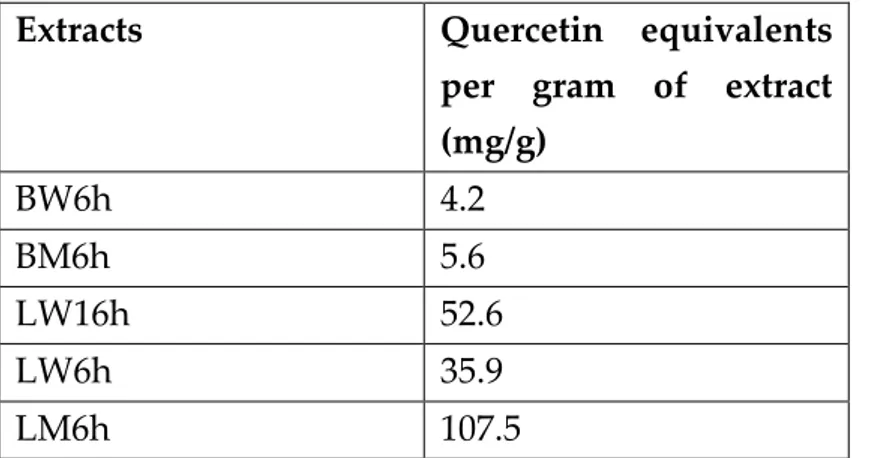
3.5. Determination of flavonoid compounds of the extracts ... 38
3.6. Determination of antioxidant activity of the extracts ... 41
3.7. Identification and quantification of phenolic compounds by HPLC ... 42
3.8. Infrared spectroscopy: attenuated total reflectance measurements ... 44
3.8.1. ATR-FTIR spectral features of berries ... 44
3.8.2. ATR-FTIR spectral features of leaves... 45
3.9. Cell studies ... 46
3.9.1. Cell viability measured by MTT assay ... 46
3.9.2. Cell proliferation measured by SRB assay ... 48
3.10. Sensory profile of cookies and bread with white crowberries ... 49
ix
3.10.2. Consumer acceptability and intention to buy of white crowberry cookies ... 51
3.10.3. Consumer acceptability and intention to buy of white crowberry bread ... 52
4. Conclusion... 54
5. Future Work ... 56
References ... 57
x
List of Figures
Figure 1 – Current and potential distributions of C. album with plotted archaeo-logical records. The potential distribution is a minimum estimate based on the current distribution areas recorded in most references or successfully introduced and naturalized populations outside the frequently cited range (from [2]) ... 3
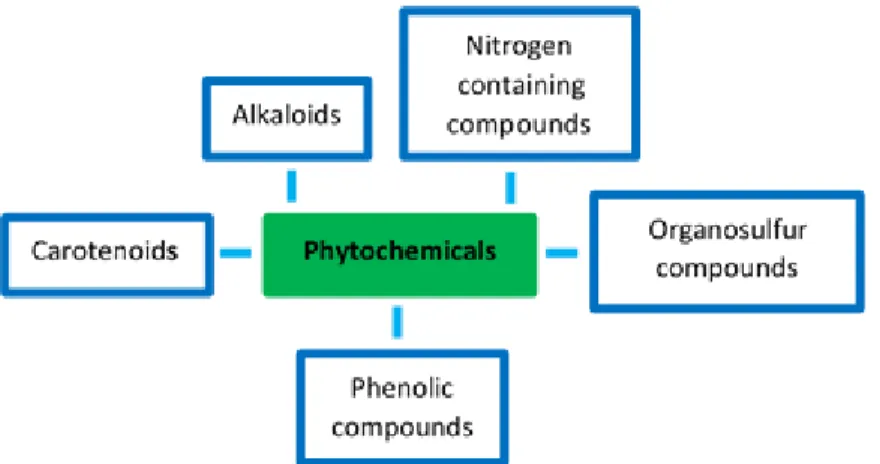
Figure 2 – The main classes of phytochemicals. ... 5
Figure 3 – Basic structures of phenolic acids (hydroxybenzoic and hy-droxycinnamic acids) and flavonoids. The basic structure of flavonoids consists of two benzene moieties (rings A and B) linked in the middle through a hetero-cyclic pyran or pyrone with a double bond (ring C) (from [38]) ... 6
Figure 4 – Structures and nomenclature of the common mono-caffeoylquinic ac-ids and their building blocks, quinic acid and caffeic acid (trivial names in brack-ets) (from [126]) ... 23
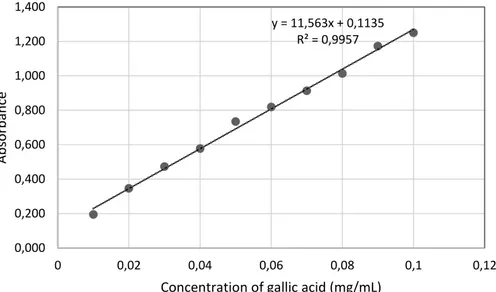
Figure 5 – Standard curve of aqueous gallic acid solution... 35
Figure 6 – Standard curve of methanolic gallic acid solution ... 36
Figure 7 – Effect of the solvent used for the preparation of the extracts in the ex-traction of phenolic compounds from the C. album berries and leaves ... 38
Figure 8 – Standard curve of methanolic quercetin solution ... 39
Figure 9 – Effect of the solvent used for the preparation of the extracts in the ex-traction of flavonoid compounds from the C. album berries and leaves ... 40
xi
Figure 11 – Cytotoxic effect of C. album BW6h and LW6h extracts. The results are presented in percentage relative to control cultures taken as 100% (horizontal dashed line). All cultures were plated with cell density 3.0x10⁴ cells/cm2. The val-ues presented are the mean ± SD of the valval-ues obtained for three independent assays, each one performed in triplicate. Statistical analysis was performed using the One-Way ANOVA, followed by Turkey's multiple comparisons test. Differ-ences were considered statistically significant with: * p < 0.05; ** p < 0.01; *** p < 0.001 or # p < 0.0001 ... 46
Figure 12 – Cell proliferation in the presence of C. album BW6h and LW6h ex-tracts. The results are presented in % of SRB retention in relation to control cell cultures at time 0 h (C0). All cultures were plated with cell density 3.0x10⁴ cells/cm2. The values presented are the mean ± SD of the values obtained for three independent assays, each one performed in triplicate. Statistical analysis was per-formed using the One-Way ANOVA, followed by Turkey's multiple compari-sons test. Differences were considered statistically significant with: * p < 0.05; ** p < 0.01; *** p < 0.001 or # p < 0.0001 ... 48
Figure 13 – White crowberry cookies made with white crowberries powder (1) and standard butter cookies (2) ... 50
Figure 14 – White crowberry bread made with whole berries (1) and standard bread (2) ... 50
Figure 15 – Mean consumer acceptability of white crowberry cookies and butter cookies attributed by the 40 panelists. Sensory characteristics were rated on a 9-point scale from 1 – really dislike, to 9 – really like ... 51
Figure 16 – Mean consumer intention to buy of white crowberry cookies and but-ter cookies attributed by the 40 panelists. Sensory characbut-teristics were rated on a 5-point scale from 1 – certainly would not buy, to 5 – certainly would buy ... 52
Figure 17 – Mean consumer acceptability of white crowberry bread and simple bread attributed by the 38 panelists. Sensory characteristics were rated on a 9-point scale from 1 – really dislike, to 9 – really like ... 53
Figure 18 – Mean consumer intention to buy of white crowberry bread and sim-ple bread attributed by the 38 panelists. Sensory characteristics were rated on a 5-point scale from 1 – certainly would not buy, to 5 – certainly would buy ... 53
Figure 1A – Standard curves of trigonelline, caffeic acid, p-coumaric acid and ferulic acid obtained using different concentrations of each compound [A. Leitão, unpublished] ... 67
xii
with a (a) were attributed to the phenolic compounds present in the berries (1300-1000 cm-1). ... 68
Figure 3A – ATR-FTIR spectra of lyophilized berries powder of C. album, skin, pulp and seeds. The identified peaks that are associated with the presence of seeds in the berries powder sample are assigned. The peaks in the region marked with a (a) were attributed to the phenolic compounds present in the berries (1300-1000 cm-1) ... 69
xiii
List of Tabels
Table 1 –C. album berries and leaves moisture and water activity ... 32
Table 2 – Nutritional characterization of lyophilized C. album berries powder ob-tained using the Weende analysis ... 33
Table 3 – Nutritional characterization of C. album berries preserved by freezing at -75 °C obtained using the Weende analysis [Luís Simões, unpublished] ... 33
Table 4 – Concentration of C. album lyophilized berries powder and grinded leaves extracts made with the solvents water and methanol ... 34
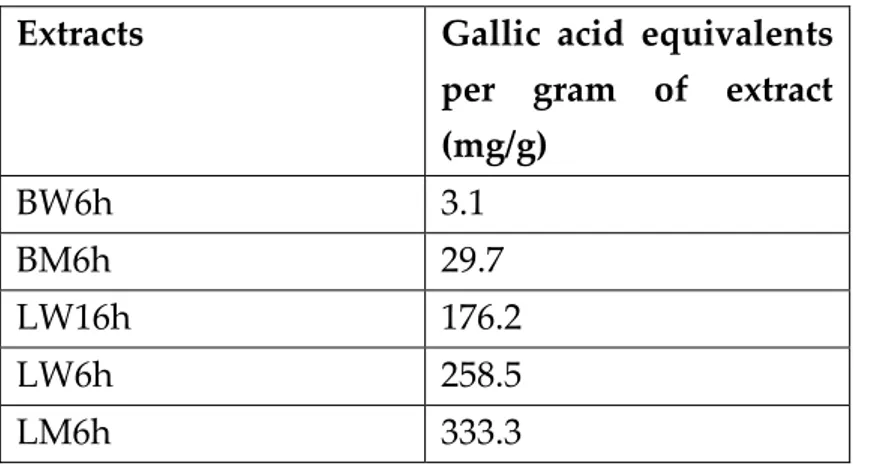
Table 5 – Total phenolic content in the C. album extracts expressed in milligrams of gallic acid equivalents per gram of extract (mg/g) ... 36
Table 6 – Total flavonoid compounds content of the C. album extracts expressed in milligrams of quercetin equivalents per gram of extract (mg/g)... 39
Table 7 – The IC50 values of DPPH scavenging effect of C. album berries and leaves extracts ... 41
Table 8 – Average peak areas obtained by HPLC for the phenolic compounds tested in the berries and leaves extracts. Chromatographs were acquired at λmax of 272 nm and 320 nm, depending on the compounds ... 43
Table 9 – Concentration of the phenolic compounds tested in the berries and leaves extracts expressed in mg of compound per 100 mg of extract for wet matter ... 43
Table 10 – IC50 values (mg/mL) for the C. album BW6h and LW6h extracts tested, obtained with the MTT assay after 24, 48 and 72 h of incubation ... 47
1
1. Introduction
1.1. Corema album general description
Corema album(L.) D. Don is a plant whose fruits, “white crowberries” or “camarinhas” in Portuguese, have been eaten by people in the Iberian Peninsula since at least the Early Neolithic. They were traditionally consumed along the Atlantic littoral of the Iberian Peninsula and have been used in popular medicine as antipyretic to treat fevers and as a vermifuge against pinworm infections1,2. The plant was also used to make rustic brushes, which may explain the origin of the genus name Coremathat came from the Greek verb “korema” which means “broom”. Although the plant and its fruits have been known and consumed since a long time, the berries never became a commercial crop. However, the shrub has been cultivated has an ornamental plant, and the berries are reported to be sold fresh in a few public markets in Galicia, Spain. Local populations that are familiar with the berries continue to harvest and consume it nowadays3,4. Current archae-obotanical research is expanding the record on the importance of this plant in human culture, dating back as far as the Early Neolithic2. C. album belongs to the division Spermatophyta, subdivision Magnoliophytina (Angiospermae), class Magnoliopsida, subclass Asteridae and order Ericales, being a member from the
2
Ericaceae family5. Two subspecies exist: subsp. album and subsp. azoricum. C. al-bum subsp. album occurs on the Atlantic coast of the Iberian Peninsula and subsp
Azoricum in the Portuguese archipelago of Azores6. It has 26 chromosomes3. C. album is an endemic maritime plant of the Iberian Peninsula that can be found in coastal areas, particularly in sand dunes but also at rocky sites6. In Por-tugal this plant can be found on land by the sea, from north to south of the coun-try7 (Figure 1). The plant consists of a dioecious and perennial shrub which can reach 1 m and with numerous branches. The leaves are sub-verticillated and gla-brous and are distributed along the branches in whorls of three or four, with short petioles which tend to lie against the stem. The roots are thick and spreading. The flowers are small with pink petals8 and the fruits are small, round and usually white and can acquire a pink colour3. They have a strong skin and usually three large seeds with a thick endocarp. The berries grow during late spring and early summer3,6 and have a distinct fresh and acidic taste2.
1.2. Plant potential
The white crowberries have a different and distinct colour from the cur-rently commercialized fruits, and also from the other berries present in the mar-kets. Its acidic taste and flavour are also very distinct in relation to the sensorial characteristics of other berries. Due to these characteristics they have the poten-tial to join the other edible berries already so well known to us and becoming one more source of nutrients. In addition to the current distribution, the plant also has potential to be distributed through other locations, as shown in Figure 12.
3 1.3. Phytochemicals and their importance to human health
Phytochemicals constitute a diverse group of compounds present in plants, being part of their secondary metabolism. They have evolved as a re-sponse to the interaction between the plant and the environment and provide varying levels of protection to biotic and abiotic stress conditions. The number of phytochemicals has been estimated in the hundreds of thousands. Their biosyn-thesis is tightly spatio-temporally regulated and often restricted to specialized cells10.
4
their consumption has been associated with a reduction in the risk of occurrence of numerous diseases: cancer13,14, cardiovascular diseases15, diabetes16, osteoporo-sis17,18, cataracts19 and cognitive impairment20,21 are examples22. These effects are associated to the antioxidant actions of phytochemicals and their capacity to gen-erate signals that promote the cellular defence system23.
Indeed, some phytochemicals have been used therapeutically since an-cient times. The discovery of the phytochemicals responsible for the biological effect and their molecular structures are the basis of many modern pharmaceuti-cals. Some examples are artemisinin from the plant Artemisia annua, very effective treatment of malaria, including highly drug-resistant strains24; paclitaxel (with the commercial name taxol), an anti-cancer drug originally extracted from the Pacific Yew tree (Taxus brevifolia)25 and reserpine from the plant Rauwolfia serpen-tine, effective in the treatment of hypertension26. Knowing the dose required for the desired effect is essential for the success of phytochemicals and for avoiding side effects.
Primary and secondary plant metabolites have different functions. The primary plant substances are proteins, fats, carbohydrates and fibres which con-tribute to energy metabolism and to the structure of the plant cell. The secondary plant metabolites are non-nutritive and present in very small amounts, but es-sential in the interaction of the plant with the surrounding environment12. They serve as defence and increase the plant tolerance to herbivore, insect and patho-gen attacks. Others participate in shielding plants from unfavourable environ-mental conditions, such as high UV or drought. Particular types of phytochemi-cals are also involved in plant development and growth, being integral compo-nents of the plant signalling machinery that can directly serve as signalling mol-ecules or interfere with the signalling activity of other molmol-ecules10.
Phytochemicals can be classified into large classes, based on the starting point of their biosynthesis: phenolic compounds, carotenoids, products with ni-trogen, alkaloids and organosulfur compounds (Figure 2)27. Every class of phy-tochemicals is further divided in many other smaller subclasses forming a com-plex diagram of classification, with a wide range of isomeric forms and different substituents, that show the different biological active effect10,27.
5
Their regular consumption was shown to exhibit numerous benefits such as can-cer protective and anticancan-cer effects28,29, cardioprotective effects30,31 or antimicro-bial activities against human pathogens32,3334. The different species of berries have a different efficacy in terms of their biological effects, depending on the quality and quantity of the active compounds present. Due to both the quantitative and qualitative high diversity of these bioactive compounds, berry fruits are increas-ingly referred to as natural functional food35.
1.3.1. Phenolic compounds
Among the various phytochemicals, phenolic compounds are the largest group and the most widely distributed in the plant kingdom36. These secondary metabolites are also one of the most diverse in edible plants37. The basic structural feature of phenolic compounds is an aromatic ring bearing one or more hydroxyl groups (Figure 3)38,39. Plant phenolic compounds are classified as simple phenols or polyphenols based on the number of phenol units in the molecule. Thus, plant phenolics comprise simple phenols, coumarins, lignins, lignans, condensed and hydrolysable tannins, stilbenes, phenolic acids and flavonoids38,40. Phenolic com-pounds appear to largely contribute to the biological effects of plants, having many potential biology properties and extensive studies are being carried out at present on their important effects on human health 34,35. Their biological activities are as antioxidants through free-radical scavenging activity and metal chelation, and they are also capable of modulation of enzymatic activity, inhibition of cel-lular proliferation and altering signal transduction pathways1,41. Other
6
experimental studies performed on animals or cultured human cell lines support that polyphenols prevent cardiovascular diseases42,43, cancers44,45, neurodegener-ative diseases46,47, diabetes48,49 or osteoporosis50. However, it is very difficult to predict the direct effects of polyphenol intake on disease prevention in humans. One of the reasons are the doses or concentrations used in these studies, that are far beyond the ones documented in humans41.
Interest in phenolic compounds has been focused on specific groups, one of them flavonoids. Flavonoids are divided into subgroups (flavonols, flavones, flavanones, flavanols (catechins), anthocyanins, isoflavones and chalcones)40 and are found in many food products with plant origin such as vegetables, fruits, tea and wine51. They are concentrated in the seeds, fruit skin or peel, bark and flow-ers52. These compounds exhibit various physiological activities including antiox-idant53,54, anti-inflammatory55,56, antimutagenic and anticarcinogenic57,58.
In C. album berries the phenolic acids are considered to be the main group of phenolic compounds present9. Extracts of the berries showed to be rich in hy-droxycinnamic acids (phenolic acids), and also to contain flavonoids and stil-benes1. However, the total phenolic content in C. album berries is thought to be lower than that of other coloured berries because the amount of anthocyanins is very low9. Anthocyanins are the flavonoids universally responsible for the colour of fruits, vegetables, cereal grains and flowers59. As the white crowberry is white or pinkish white it has few anthocyanins9. But the phenolic compounds are a very vast group of compounds and it is important to know each one that is present in these berries.
7
1.3.2. Alkaloids
Alkaloids are a structurally diverse group of over 12000 cyclic nitrogen-containing compounds that are found in over 20% of plant species. This chemical group has contributed to the majority of poisons, neurotoxins, and traditional psychedelics and social drugs (nicotine, caffeine, methamphetamine (ephedrine), cocaine and opiates) consumed by humans. Given their toxicity profile and low levels of efficacy in terms of benefits to brain function, only few alkaloid-based psychotropics are appropriate for use in healthy populations60. Some examples are the compounds galantamine and rivastigmine that are prescribed as a treat-ment for the Alzheimer’s disease61.Trigonelline also has therapeutic potential be-cause of its beneficial effects in diabetes and central nervous system diseases but further in vivo and in vitro study is required, especially with regard to its mecha-nisms of action62. In certain conditions trigonelline may also damage bone, as shown in a study performed in rats63.
Recent research in alkaloids is considering its possible medicinal use in the treatment of depression64 and also as an antiplatelet agent65.
1.4. Antioxidant activity
Reactive oxygen species (ROS) are produced by living organisms as a re-sult of their normal cellular metabolism. Environmental factors, such as air pol-lutants, cigarette smoke, ionizing radiation and heavy metal ions, also contribute to the production of ROS. At low to moderate concentrations, they interact in physiological cell processes, forming products like superoxide anion in mito-chondria during production of adenosine triphosphate (ATP) - the molecule that provides energy for many processes in the cells66.
8
intricately regulated antioxidant defence system. The cellular antioxidant de-fence is made up of enzymatic dede-fence, non-enzymatic dede-fence and the DNA re-pair systems66. The mechanism of action of antioxidants consist of firstly, neutral-izing their action by donating an electron to the free radical, and second the re-moving of ROS by quenching chain-initiating catalyst. Antioxidants may exert their effect on biological systems by different mechanisms including electron do-nation, metal ion chelation, co-antioxidants, or by gene expression regulation67. However, when the balance between oxidants and antioxidants is in favour of oxidants the cells are under “oxidative stress”. Oxidative stress contributes to many pathological conditions and diseases, including cancer68–70, neurological disorders71, hypertension72, acute respiratory distress syndromes73, chronic ob-structive pulmonary disease74 and asthma75,76.
Phytochemicals may contribute to reduce the oxidative stress due to its antioxidant activity and capacity to trigger the cellular defence system to protect our cells against molecular damage. Dietary phytochemicals have been associ-ated with increasing the levels of both enzymatic and non-enzymatic antioxidant defence in animal77–79 and human dietary intervention studies80–82. Consumption of phytochemical-rich diets increased the expression of genes associated with DNA repair and immune responses in humans83–8523. Research suggests that the increased intake of fruits and berries may be associated with a reduced incidence of disorders induced by ROS86,87.
A study showed that C. album berries extracts can help cells in a case of oxidative stress. Pre-treatment of HepG2 cells, a human liver cancer cell line, with extracts of C. album (1-40 μg/mL of acetone extract, ethyl acetate extract and water extract) increased their capacity to face oxidative stress (induced by t-butyl hy-droperoxide, t-BOOH), greatly preventing cell damage and slightly but signifi-cantly reducing ROS, having antioxidant activity. The compounds present in the berries extracts can be responsible to enhance the quenching of the ROS gener-ated during the period of oxidative stress1.
1.5. Anticancer activity
9
high mortality and disability rates. The development of cancer involves the oc-currence of mutation and the mutated cells acquire the capacity to proliferate, survive, invade, and metastasize88. In most cases, activation of oncogenes (spe-cific genes capable of inducing cell transformation, as a consequence of genetic alterations that either increase gene expression or lead to uncontrolled activity of the oncogene-encoded proteins, thereby providing the first steps into cancer) and/or deactivation of tumour suppressor genes (normally acting to inhibit cell proliferation and tumour development)88 lead to uncontrolled cell cycle progres-sion and inactivation of apoptotic mechanisms89. The substances that cause can-cer are called carcinogens and include radiation, chemicals and viruses. The ma-jority (approximately 80%) of human cancers are caused by radiation and chem-icals88.
Phytochemicals can be important regulators in the processes and condi-tions that induce cancer. They can modulate gene expression, leading to restora-tion of the normal signal transducrestora-tion pathways. Phytochemical intervenrestora-tion in chemotherapy is sustained by a higher number of clinical trials that have shown that these compounds increase the treatment efficiency and decrease the side ef-fects, inducing apoptosis in cancer cells, reducing drug resistance and also the severity of comorbid conditions. Thus, they are a potential complementary treat-ment for cancer13,27,90,91.
10
In this work we aim to contribute to the valorisation of the maritime plant
11
2. Materials and Methods
2.1. Corema album berries and leaves
C. album berries used throughout the study were harvested in Palheirão, Praia de Mira, a Portuguese village in the district of Coimbra, in July and frozen in plastic boxes at -75 °C (Thermo Scientific Revco Value Plus freezer). The leaves, used fresh, were harvest at the same place at the time the studies were carried out.
2.2. Preparation of Corema album berries and leaves
2.2.1. Preparation of berries
C. album berries were first lyophilized and reduced to powder to prepare a homogeneous sample. The process of freeze-drying is done in three main phases: first – freezing, or sub-cooling, the product; second - dehydration (dry-ing) by ice sublimation under vacuum, and third - completion of product drying by vacuum drying92. Lyophilization was carried out with a condenser tempera-ture of -98 °C at a pressure of 9.2 Pa using a freeze dryer (CoolSafe, Scanvac). A first attempt was made to lyophilize the intact berries but they were not totally dehydrated and had a sticky texture. For this reason, the berries were cut in half with a scalpel before the freeze-drying process. After freeze-dried, they were re-duced to powder with a shredder. Finally, the lyophilized berries powder was stored in a refrigerator at 4 °C.
12
2.2.2. Preparation of leaves
The fresh leaves were reduced to small pieces using a grinder food pro-cessor (Vorwerk) and stored in a refrigerator at 4 °C.
2.3. Nutritional characterization of Corema album berries
The nutritional characterization was performed for the lyophilized berries powder, following the Weende or proximate analysis that was developed by Henneberg and Stohmann in 186493.
2.3.1. Determination of moisture and water activity of berries
The moisture content of the lyophilized berries powder was determined at 105 °C in duplicate and in accordance to NP 875:199494. For this purpose, cru-cibles were dried at 105 °C for 2 h, cooled in a desiccator for 15 min and weighted. Approximately 2 g of the lyophilized berries sample were weighted for each cru-cible, and the weight value of the crucibles with the sample was recorded. The crucibles were then placed in an oven at 105 °C for 2 h. After this time the dry sample was cooled in the desiccator and subsequently weighted. The moisture is given, in percentage of dry matter (g/100 g of sample), by:
Moisture (in dry matter) = 100 ×PP2− P3
2− P1
P1 - crucible weight (g)
P2 - crucible weight with sample (g) P3 - crucible weight with dry sample (g)
For measuring the water activity (aw) of the berries sample was used a wa-ter activity mewa-ter (Humimewa-ter RH2, Schaller) and the value was recorded.
Moisture and water activity were also determined for the grinded leaves, following the same procedures.
2.3.2. Crude ash determination
13
sample were placed in the crucibles and weighted. The crucibles were placed in a muffle at 550 °C for 2 h and then cooled in the desiccator and weighted. Crude ash is given in percentage (g/100 g of sample), in dry matter and crude matter, by:
Ash (in dry matter) = 100 ×PP2− P3
2− P1
Ash (in crude matter) =Ash (in dry matter) × (100 − M)100
P1 - crucible weight (g)
P2 - crucible weight with sample (g) P3 - crucible weight with ash (g) M - moisture (%)
2.3.3. Crude fat determination
The crude fat was determined by Soxhlet extraction with diethyl ether, in accordance with NP 876:200196. For this purpose, round-bottom flasks were dried in an oven at 105 °C for 2 h, cooled in a desiccator and then weighted. The flasks were filled with diethyl ether (Sigma-Aldrich) up to 2/3 of their capacity. 2 g of sample previously dried at 105 °C were weighted and placed in an extraction thimble. The extraction thimbles were placed in the Soxhlet extractor (Behrotest R306 S, Behr Labor Technik, Fisher Scientific), the Soxhlet extraction apparatus was assembled and the extraction was carried out for 16 h. After this time, the flasks were removed from the Soxhlet extractor and the solvent was carefully collected from the apparatus. The solvent was evaporated with the aid of a rotary evaporator (Rotavapor RII, Buchi). Subsequently, the flasks were placed in the oven at 105 °C for 2 h, cooled in the desiccator and weighted. Crude fat is given in percentage (g/100 g of sample) by:
Crude fat (in dry matter) = 100 ×P3P− P1
2
14
P1 - flask weight (g) P2 - sample weight (g) P3 - flask weight with fat (g) M - moisture (%)
2.3.4. Crude fibre determination
Crude fibre was determined according to the NP 1005:197497. Approxi-mately 2 g of the sample, previously dried at 105 °C, were weighted and placed in a tall 800 mL beaker. 200 mL of sulfuric acid (12.5 g/L, Sigma-Aldrich) were added and the beaker was placed in a crude fibre apparatus (Labconco) for 40 min. With the aid of a vacuum pump, the content of the beaker was filtered into a filter plate crucible G2. The mixture was removed from the crucible, placed in the beaker and 250 mL of sodium hydroxide (12.5 g/L, Sigma-Aldrich) were added. The mixture was again placed on the crude fibre apparatus for 40 min and the filtration was also done to a filter plate crucible G2 with the aid of the vacuum pump. Subsequently, the crucible was placed in an oven at 130 °C for 2 h, cooled in a desiccator and weighted. Finally, the crucible was placed in a muf-fle at 550 °C for 2 h, cooled in the desiccator and weighted. Crude fibre is given in percentage (g/100 g of sample) by:
Crude fibre (in dry matter) = 100 ×P2P− P3
1
Crude fibre (in crude matter) = Crude fibre (in dry matter) × (100 − M)100
P1 - sample weight (g)
P2 - crucible weight with dry sample at 130 °C (g) P3 - crucible weight with dry sample at 550 °C (g) M - moisture (%)
2.3.5. Crude protein determination
15
performed with the same reagents but without addition of sample. The Kjeldahl tubes were placed in a Kjeldahl digester at 400 °C for 2 h. Subsequently the tubes were left to cool in a fume cupboard and 50 mL of distilled water were added. 25 mL of boric acid solution (Sigma-Aldrich) with a mixed indicator were added to an Erlenmeyer flask and this flask, together with the Kjeldahl tube, was placed in an automatic Kjeldahl distillation unit (UDK 129 Distillation Unit, Velp Scien-tifica) preceding the addition of 50 mL of 40% sodium hydroxide (Sigma-Al-drich). 150 mL of distillate were collected into the Erlenmeyer flask which were then titrated with a 0.1 M hydrochloric acid solution (Sigma-Aldrich). For the crude protein calculations, the factor of 6.25 was considered. This factor is used when a specific factor is not listed and until a more appropriate factor has been determined101. Crude protein is given in percentage (g/100 g of sample) by:
Crude protein (in dry matter) = factor × 100 ×0,01401 × [HCl] × (V − VP 0 )
1× 10
Crude protein (in crude matter) =Crude protein (in dry matter) × (100 − M)100
P1 - sample weight (g)
[HCl] - concentration of hydrochloric acid (M) V - volume of titrant in the titration of sample (mL) V0 - volume of titrant in the titration of control (mL) M - moisture (%)
2.3.6. Total carbohydrates determination
16 2.4. Preparation of Corema album extracts
2.4.1. Preparation of extracts of lyophilised berries
For the preparation of the extracts were weighted 5 g of the lyophilized berries powder with a ratio of plant/solvent of 1(dry basis):10. Two extracts were made: an aqueous extract with ultrapure water (BW6h) and a methanol (Sigma-Aldrich, 99.5%) extract (BM6h). The extracts were performed in a heating plate only with the stirrer on, covered with aluminium foil to protect from light expo-sure and left to extract for 6 h. After this time, the extracts were centrifugated in a centrifuge (High Speed Brushless Centrifuge MPW-350R) in falcon tubes at 3913 G for 10 min to remove larger particles. A vacuum filtration was then made with filter paper of 2.5 µm, followed by a new centrifugation at 35217 G for 10 min. Finally, a filtration with a syringe filter of 0.20 µm was made and the extracts were stored in a refrigerator at 4 °C covered with aluminium foil.
2.4.2. Preparation of extracts of grinded leaves
For the preparation of the extracts were weighted 16.8 g of fresh grinded leaves (the ratio used was 1:20 and not 1:10 as for the preparation of the berries extract since the grinded leaves are very light and have a high volume for the amount of water used, making its extraction difficult). Three extracts were made: two aqueous extracts with ultrapure water and a methanol extract. The extracts were performed in a heating plate only with the stirrer on and covered with alu-minium foil to protect from light exposure. One of the aqueous extracts was left to extract for 16 h (LW16h) and the other for 6 h (LW6h). The methanol extract was left to extract for 6 h (LM6h). After this time, the extracts were centrifugated in falcon tubes at 3913 G for 10 min to remove larger particles. A vacuum filtra-tion was then made with filter paper of 2.5 µm followed by a new centrifugafiltra-tion at 35217 G for 10 min. Finally, a filtration with a syringe filter of 0.20 µm was made and the extracts were stored in a refrigerator at 4 °C covered with alumin-ium foil.
2.4.3. Determination of the concentration of all extracts made
17
in triplicate. After drying, they were left to cool in a desiccator for 15 min and then weighted.
2.5. Determination of total phenolic content of the extracts
To determine the total content of phenolic compounds present in the ex-tracts of berries and leaves was followed the Singleton and Rossi (1965) method102 with some modifications. The basic mechanism involved is an oxidation/reduc-tion reacoxidation/reduc-tion. The phenolic compounds of the plant extracts suffer oxidaoxidation/reduc-tion in alkaline solution by the yellow molybdotungstophosphoric heteropolyanion re-agent Folin-Ciocalteu, transferring electrons to them and forming a blue complex (phosphotungstic/phosphomolybdenum complex) that can be quantified by spectrophotometry103.
18
using a 48 well culture plate. These determinations were performed in duplicate. The total phenolic content of the extracts was determined from the calibration curve and expressed as gallic acid equivalents (mg) per gram of extract.
2.6. Determination of flavonoid compounds of the extracts
The content in flavonoids was determined by the Al-Dabbas et al. (2006) method104 with slight modifications. This method uses aluminium chloride (AlCl3) as the reagent and is based on the reaction of aluminium ions with flavo-noid molecules under basic conditions. The products of this reaction are red alu-minium flavonoid chelates capable of absorption under a certain wavelength. Colour intensity and method sensitivity depends on the number of hydroxyl groups in the flavonoid molecule and on the properties of the aluminium ion105. A methanolic solution of quercetin (methanol and quercetin from Sigma-Aldrich, Germany) with a concentration of 0.1 mg/mL was used as the standard for a calibration curve. For making the standard curve 10 to 100 µL (10, 20, 30, 40, 50, 60, 70, 80, 90 and 100) of the methanolic solution of quercetin were added to a 96 well culture plate and diluted to 100 µL with methanol to obtain different concentrations of quercetin in this solvent. 100 µL of all plant extract solutions with concentration of 1 mg/mL were mixed with 100 µL of 2% AlCl3 (Sigma-Al-drich) in methanol. The same volume of 2% AlCl3 solution was also added to all the wells containing the standard solutions of quercetin. The mixture was then left for 40 min at room temperature and its absorbance was measured at 415 nm in a microplate reader. In the blank was used a mixture of 100 µL of methanol with 100 µL of 2% AlCl3 solution, followed by measurement of the absorbance as described above. The analysis was performed in triplicate. The total amount of flavonoids was determined from the calibration curve and expressed as querce-tin equivalents (mg) per gram of extract.
2.7. Determination of antioxidant activity of the extracts
19
2,2-diphenyl-1-picrylhydrazyl (DPPH•)106,107. The DPPH solution has a dark vio-let colour that when mixed with antioxidants starts to decrease in intensity be-cause the antioxidants react with the stable radical in a methanolic solution. This change is a sign of resistance to the oxidative stress induced in the medium. This reaction of antioxidants with the DPPH radical can occur by transfer of electrons or hydrogen atoms from the antioxidants to the radical, forming a stable mole-cule. The reduction in the concentration of the DPPH• is monitored by the de-crease in the absorbance at a characteristic wavelength, 515 nm, due to the reduc-tion of colour intensity. This wavelength is used because it corresponds to the maximum absorbance of DPPH in its radical form106,108.
20
% 𝐴𝐴 =𝐴𝑐𝑜𝑛𝑡𝑟𝑜𝑙− (𝐴𝐴 𝑒𝑥𝑡𝑟𝑎𝑐𝑡− 𝐴𝑏𝑙𝑎𝑛𝑘)
𝑐𝑜𝑛𝑡𝑟𝑜𝑙 × 100
Where Acontrol is the absorbance of control, Aextract is the absorbance of extract and Ablank is the absorbance of blank. The antioxidant activity of each extract was de-fined as the concentration of extract necessary to decrease the initial concentra-tion of DPPH free radicals by 50%: the half minimal inhibitory concentraconcentra-tion or IC50. This concentration value was obtained by interpolation and using linear re-gression analysis.
2.8. High-performance liquid chromatography analysis of phenolic com-pounds
Chromatography is an important biophysical technique that enables the separation, identification and purification of the components of a mixture for qualitative and quantitative analysis. The technique is based on the principle where molecules in mixture applied onto a surface or into a solid, called station-ary phase, can be separated from each other while moving with the aid of a mo-bile phase. Thus, three components form the basis of the chromatography tech-nique:
• Stationary phase: composed of a “solid” phase or “a layer of a liquid ad-sorbed on the surface of a solid support”;
• Mobile phase: composed of “liquid” or a “gaseous component”;
• Separated molecules.
The type of interaction between stationary phase, mobile phase and sub-stances contained in the mixture is the basic component effective on separation of molecules from each other. The factors involved in the separation process in-clude molecular characteristics related to adsorption, partition and affinity, or differences among their molecular weights. Because of these differences some components of the mixture stay longer in the stationary phase as they move slowly in the chromatography system, while others pass rapidly into the mobile phase and leave the system faster109,110.
21
particles, thereby achieving more efficient separations than those used in con-ventional liquid chromatography. To perform this chromatography some instru-mental equipment is needed. The basic equipment consists of a column packed with a stationary phase, a driving force to propel the solvent through the column (pump), a system (injector) for introducing the sample into the column, a system (detector) for measuring a physical property of the solutes being analysed that differs from the properties of the solvent or a property of the mobile phase which is altered by the presence of the solute, and a system for recording the detector signals and converting them into graphic traces of chromatograms111.
In this work a reverse phase chromatography was performed. This chro-matography uses resins with small hydrophobic groups attached. The stationary phase is of a nonpolar nature and the mobile phase is more polar than the sta-tionary phase. The most widely used stasta-tionary phase is silica-based and the mo-bile phase is usually water with an organic modifier (as acetonitrile, for example). The organic modifiers are added to the elution buffer to decrease the water con-centration in the mobile phase. This in turn weakens the hydrophobic attraction of the hydrophobic groups on the chromatography matrix for the compounds. The stronger hydrophobic interactions will require higher concentrations of or-ganic modifiers. Therefore, a gradient of oror-ganic solvent will release the com-pounds from the column matrix in the order of their hydrophobic interaction strengths111,112.
22
and changed from 87% to 95% A in 1 min. The column was stabilized for 5 min before re-injection114. Chromatographs were acquired at λmax of 272 nm and 320 nm, depending on the compounds. The alkaloid trigonelline and the phenolic acids (hydroxycinnamic acids) caffeic acid, p-coumaric acid and ferulic acid were identified and quantified according to the standard curves of each standard, ob-tained using different concentrations of each compound, and were already avail-able in the laboratory (in appendix, Figure 1A). The identification and quantifi-cation of the polyphenol chlorogenic acid (3-O-caffeoylquinic acid or 3-CQA) and its isomers, cryptochlorogenic acid (4-O-caffeoylquinic acid or 4-CQA) and neo-chlorogenic acid (5-O-caffeoylquinic acid or 5-CQA), was made according to Trugo and Macrae (1984)115. Chlorogenic acids are obtained through an esterifi-cation reaction between quinic acid and caffeic acid (Figure 4)116. Esterification can occur on carbon 1, 3, 4 or 5, resulting in the synthesis of four different isomers, among them the isomers mentioned above117. For the isomerisation of the chloro-genic acids 5-CQA (Sigma-Aldrich), 200 mg were dissolved in distilled water (20 mL) and the pH was adjusted to 8 with dilute ammonia (Sigma-Aldrich) solution. This solution was heated for 30 min in a boiling water-bath. The pH was then adjusted to 2.5-3.0 with dilute hydrochloric acid (Sigma-Aldrich), after cooling to room temperature. Quantification was achieved by peak-area measurement and by comparison with a 5-CQA standard. It was possible to quantify the individual isomers using their molar absorptivities, according to the equation:
𝐶 =𝑅𝐹 × 𝜀1× 𝑀𝑟2× 𝐴
𝜀2× 𝑀𝑟1
23 2.9. Infrared spectroscopy: attenuated total reflection measurements
Infrared spectroscopy (IR) is used for studying biological molecules and can be applied to study any sample in any state: liquids, solutions, pastes, pow-ders, films, fibres, gases and surfaces. This technique is based on the vibrations of the atoms of a molecule. Thus, an infrared spectrum is obtained by passing infrared radiation through a sample and determining what fraction of the inci-dent radiation is absorbed at a particular energy. The energy at which any peak in an absorption spectrum appears corresponds to the frequency of a vibration of a part of the sample molecule.
The attenuated total reflection (ATR) Fourier transform infrared (FTIR) spectroscopy (ATR-FTIR) involves directing the infrared light at an interface be-tween an infrared transparent material with a high refractive index called the internal reflection element (IRE, a prism made of diamond or germanium, for example) and a sample on the surface of the IRE118. The IRE is designed so that the infrared beam of light strikes on the plate at an angle greater than the critical angle, resulting in total internal reflection. Under these conditions, the beam in-tensity is attenuated by a surface ‘evanescent’ wave that penetrates a short dis-tance into any absorbing sample placed in contact with the crystalline plate. The depth of penetration (dp) varies with the angle of incidence (θ), the wavelength (λ) and the indices of refraction of both the plate (n1 ) and the sample (n2), accord-ing to the equation119,120:
24
𝑑𝑝 = 𝜆
2𝜋(𝑛12sin2𝜃 − 𝑛 2 2)12
The resulting spectrum is similar to a transmission spectrum, with some differ-ences in the intensity of the peaks because of the variable penetration119.
To study the composition of the lyophilized berries powder and grinded leaves by infrared spectroscopy an attenuated total reflectance (ATR) infrared spectrometer with Fourier transform (FTIR) was used (Vertex 70 spectrometer with a Platinum ATR, both from Bruker, Billerica, Massachusetts, EUA), that was continuously purged with nitrogen gas to reduce the content of unwanted at-mospheric interferents (water vapor and carbon dioxide, for example) inside the spectrometer significantly, avoiding high noise in the spectrum. The spectres were collected in the wavenumber range from 4000 cm-1 to 400 cm-1. The samples in study were placed in direct contact with the diamond crystal and the average of 100 scans were recorded for each sample.
2.10. Cell studies
The anticancer effect of extracts of white crowberries and leaves was eval-uated against the human colon adenocarcinoma HT-29 cell line.The cell line was provided by the professor Ana Margarida Urbano (PhD, professor at Departa-mento de Ciências da Vida, Faculdade de Ciências e Tecnologia of Universidade de Coimbra). This is an adherent cell line which grows in monolayer121. For maintenance, the cells were stored in an incubator (Sanyo) at 37 °C with 72-90% humidity, 5% CO2 and 95% air.
25
2.10.1. Preparation of the culture medium and solutions
The HT-29 cells were grown in McCoy’s 5A medium (Sigma-Aldrich) with 10% fetal bovine serum (FBS, Gibco) and2.2 g of sodium bicarbonate (NaHCO3, Sigma-Aldrich) per litre at pH 7.4. After preparation, the culture medium was filtered under vacuum with a 0.2 μm membrane filter under sterile conditions in a laminar flow biological safety cabinet (Biowizard, Kojair) and stored at 4 °C. All necessary solutions were also prepared: phosphate buffered saline (PBS), made with 1.5 mM of monopotassium phosphate (KH2PO4), 8.1 mM of disodium phosphate (Na2HPO4), 0.14 mM of sodium chloride (NaCl) and 2.7 mM of potas-sium chloride (KCl) (all from Sigma-Aldrich) per 500 mL in ultrapure water at pH 7.4; MTT (Sigma-Aldrich) with the concentration of 5 mg/mL in PBS 1x; SRB 0.5% (v/v) made with SRB (Sigma-Aldrich) dissolved in 1% (v/v) of acetic acid (Sigma-Aldrich); and 190 mM tris buffer made with tris(hydroxymethyl)amino-methane (Sigma-Aldrich) dissolved in ultrapure water at pH 10.
2.10.2. Subculturing and measuring cell growth
The cell line used was normally divided twice a week with a split ration of 1:8. For subculturing, the culture medium was removed from the flask and the cells washed with 5 mL of 1x PBS. After this washing step the PBS was removed, 2 mL of trypsin 1x (Sigma-Aldrich) were added and the enzyme was left to incu-bate for 5 min at 37 °C in the incubator. Then the mixture was resuspended with 5 mL of culture medium. According to the split ratio used, the required volume of cells and medium were added to the flask, which was then incubated.
26
in total) of the hemacytometer chambers by 104, obtaining the number of cells per 0.5 mL, thus being possible to determine the number of cells in 1 mL.
2.10.3. Filtration of extracts of berries and leaves
To be used in the study in HT-29 cells the BW6h and LW6h extracts had to be filtered under sterile conditions with a 0.2 μm syringe filter and diluted in PBS 1x to the final desired concentration for the experiment (10 mg/mL for the BW6h extract and 15.1 mg/mL for the LW6h extract).
2.10.4. Determination of the concentration of extracts after filtration
To determine the exact concentration of the BW6h and LW6h extracts after being filtered with 0.2 μm filters under sterile conditions the procedure to deter-mine their concentration was repeated. 1 mL of each extract was pipetted into pre-weighted Eppendorf tubes and allowed to dry in an oven at 62°C for 3 days. Each extract was pipetted in triplicate. After drying, they were left to cool in a desiccator for 15 min and then weighted.
2.10.5. Evaluation of cellular viability and proliferation
Cell proliferation was evaluated using sulforhodamine B (SRB) colorimetric assay and cell viability using the method of reducing 3-(4,5-dimethylthiazol-2-yl)-2,5-diphenyltetrazolium bromide or thiazolyl blue tetrazolium bromide (MTT) to determine the effect of BW6h and LW6h extracts against the HT-29 cell line and if it is dosage and time dependent. To determine the possible relation-ship between the effect on the cancer cells and the dosage a range of concentra-tions of both extracts were tested. The time dependence was evaluated by MTT and SRB assays at three different times: 24, 48 and 72 h. To validate the results three independent assays were made, and each one performed in triplicate.
• MTT assay
27
cytotoxic effect of the water extracts of berries and leaves on HT-29 cells. The purple coloured formazan crystals have an absorbance maximum near 570 nm making possible the measurement by spectrophotometry122–124.
For the MTT assay the cell line used was plated at a density of 3×10⁴ cells/cm2 in 24 well plates (with an area of 1.95 cm2), adding 1 mL of cell suspension after adequate dilution so each well had the desired cell density. Plates with the cells were incubated at 37 °C with 72-90% humidity and 5% CO2. After 24 h, the cul-ture media was substituted by 750 μL of new one, except for the wells in which the extract was applied at the highest concentration tested, to which 1350 μL of medium and 150 μL of the extract tested, BW6h or LW6h, were added. 750 μL of this well were pipetted to the next well, resuspended, and the same procedure was repeated for the following three wells - successive dilutions, being possible to test five different extract concentrations (1.00, 0.50, 0.25, 0.13 and 0.06 mg/mL for the BW6h extract and 1.50, 0.75, 0.38, 0.19 and 0.09 mg/mL for the LW6h ex-tract). Controls were also made for each time, 24, 48 and 72 h, with 1 mL of culture medium and without addition of extract. The plates were then incubated again under the same conditions and the cells were exposed to the extracts for 24, 48 and 72 h. After the specific times of exposure to the extract, the wells content and the respective control were aspired, the cells were washed with 500 μL of PBS and 500 μL of MTT (5 mg/mL in PBS 1x) were added to each well and allowed to incubate for 3 h, with the plates covered with aluminium foil. Supernatants were removed, 500 μL of dimethyl sulfoxide (DMSO, Sigma-Aldrich) were added, the plates were gently shaken to solubilize the formazan crystals and absorbance was measured at 570 nm using BioTek MQX200 μQuant microplate reader. The val-ues of cell viability (in %) were determined according to the following equa-tion124:
cell viability (%) =A Asample
control− Ablank× 100
Asample - sample absorbance Acontrol - control absorbance Ablank - blank absorbance
28
as a function of the concentration of BW6h and LW6h extracts applied after 24, 48 and 72 h of incubation. The extract concentration values for which 50% inhi-bition of cancer cells (IC50) was verified, against control cultures, were deter-mined using the program GraphPad Prism 6.01 for Windows (GraphPad Soft-ware, USA). The presented results are the mean ± standard deviation (SD, corre-sponding error bars are plotted in the graphs) of at least three independent as-says, each one performed in triplicate. Statistical analysis was performed using the One-Way ANOVA, followed by Turkey's multiple comparisons test. Differ-ences were considered statistically significant with: p < 0.05; p < 0.01; p < 0.001 or p < 0.0001.
• SRB assay
The SRB colorimetric assay, developed by the National Cancer Institute of the United States of America125, was used in this study for cell density determination and is based on the measurement of cellular protein content. The SRB compound is capable of binding to protein components of the cells that have been fixed to culture plates with acetic acid. SRB is an aminoxanthene dye with a bright pink colour and has two sulfonic groups that bind to basic amino acid residues when under mild acidic conditions. The chemical bond formed can be broken under basic conditions and, as the binding of SRB to the amino acids is stoichiometric, the amount of dye extracted from the stained cells is directly proportional to the cell mass (and then linear with cell density), and this method can be used to de-termine cell density124,126.
29
Germany) (v/v) solution and placed at -20 C for approximately 24 h. The 1% acetic acid in methanol (v/v) solution was removed and the plates were left to dry at room temperature. The plates were then incubated for 1 h with 250 μL of 0.5% SRB (sulforhodamine B sodium salt, Sigma-Aldrich) in 1% acetic acid (v/v), thoroughly washed with 1% acetic acid solution until removing all the un-bounded dye and allowed to dry at room temperature. 500 μL of 10 mM Tris buffer solution were added to each well and absorbance was measured at 540 nm using a microplate reader. The values of cell proliferation (in %), measure by the % of SRB retention, were determined according to the following equation124:
cell proliferation (%) =AAsample− A0 h
control− A0 h× 100
Asample - sample absorbance A0 h - 0 h absorbance
Acontrol - control absorbance
The results were expressed as a percentage of SRB retention in relation to control cell cultures at time 0 h (C0) and plotted in a graphic with SRB retention as a function of the concentration of BW6h and LW6h extracts applied after 24, 48 and 72 h of incubation. The extract concentration values for which 50% inhi-bition of cell growth (IC50) was verified, against control cultures, were deter-mined using the program GraphPad Prism 6.01 for Windows. The presented re-sults are the mean ± standard deviation (SD, corresponding error bars are plotted in the graphs) of at least three independent assays, each one performed in tripli-cate. Statistical analysis was performed using the One-Way ANOVA, followed by Turkey's multiple comparisons test. Differences were considered statistically significant with: p < 0.05; p < 0.01; p < 0.001 or p < 0.0001.
2.11. Sensory evaluation of cookies and bread with white crowberries
30
2.11.1. Experimental samples
To make the cookies was used the lyophilized berries powder and for the bread were used the intact berries stored frozen at -75 °C after thawing.
• White crowberry cookies
To make the cookies was followed a recipe for butter cookies with the ad-dition of varying amounts of white crowberries powder: 1,2 or 3 g. The base rec-ipe for the cookies was as follows: 40 g of melted butter were mixed with 60 g of sugar and the amount of white crowberries powder mentioned above. Then 160 g of flour and one egg were added to the mixture, manually mixed in the form of a ball and the cookie dough was left in the fridge for 30 min. After this time the cookie dough was rolled out, cut into circular shapes with a cookie cutter and the cookies were baked for 8 min at 200 °C. For the sensory evaluation were also made butter cookies following the same recipe but without the berries powder (standard cookies).
• White crowberry bread
To make the bread was followed a traditional wheat homemade bread rec-ipe with the addition of varying amounts of white crowberries: intact berries (30% w/w) or grinded berries (20, 30 or 40% w/w). The base recipe for the bread was as follows: 1 kg of wheat flour was mixed with 10 g of compressed baker's yeast dissolved in 600 mL of warm water. The bread dough was kneaded with the hands and left to leaven for 1 h. After this time, the bread dough was divided into 100 g pieces and the berries were added and mixed in the dough. The bread was then baked in a wood oven for 1 h. In the same way as for the cookies, for the sensory evaluation of the white crowberry bread was also made a bread fol-lowing the same recipe but without the berries (standard bread).
2.11.2. Sensory evaluation: consumer acceptability and intention to buy
31
32
3. Results and Discussion
3.1. Preparation of Corema album berries and leaves
As referred in materials and methods section, the process of lyophilization was first carried out with intact berries but they were not totally dehydrated. The explanation we found for this lyophilization result is that the skin of the berries is very thick, preventing a greater exit of water contained within the berry. For this reason, they were cut in half and introduced again in the freeze dryer to con-tinue the drying process. The amount of water present was drastically reduced, as shown by the moisture and water activity (aw) values present on Table 1. This table also shows the leaves moisture and water activity.
Part of the plant Moisture (g/100 g of sample)
aw
Berries (lyophilized) 54.51 (with intact skin) 21.11 (after being cut)
0.69 (with intact skin) 0.21 (after being cut)
Leaves (fresh grinded) 69.90 0.72
The values in the table for the berries show that there was a significant decrease in the moisture and water activity of the lyophilized berries with cut skin (21.11% and 0.21, respectively) when compared to the lyophilized berries with the intact skin (moisture of 54.51% and water activity of 0.69), which
3
33
indicates that the skin actually hinders the exit of water from the berries during the lyophilization process.
3.2. Nutritional characterization of berries
The nutritional characterization of the lyophilized berries powder follow-ing the Weende or proximate analysis is shown in Table 2. The nutritional char-acterization of another batch of berries preserved by freezing at -75 °C was al-ready available (Luís Simões), following the same method (Table 3).
Chemical composition (g/100 g of sample)
In dry matter In crude matter
Moisture ‒ 21.11
Crude ash 1.65 1.30
Crude fat 4.00 3.16
Crude fibre 30.14 23.78
Crude protein 5.02 3.96
Total carbohydrates 59.19 46.69
Chemical composition (g/100 g of sample)
In dry matter In crude matter
Moisture ‒ 84,79
Crude ash 2,01 0,31
Crude fat 4,77 0,72
Crude fibre 42,68 6,49
Crude protein 5,99 0,91
Total carbohydrates 44,56 6,78
Table 2 – Nutritional characterization of lyophilized C. album berries powder obtained using the Weende analysis.

![Figure 4 – Structures and nomenclature of the common mono-caffeoylquinic acids and their building blocks, quinic acid and caffeic acid (trivial names in brackets) (from [126])](https://thumb-eu.123doks.com/thumbv2/123dok_br/16681687.743202/41.892.189.747.130.409/figure-structures-nomenclature-caffeoylquinic-building-caffeic-trivial-brackets.webp)

![Table 3 – Nutritional characterization of C. album berries preserved by freezing at -75 °C obtained using the Weende analysis [Luís Simões, unpublished]](https://thumb-eu.123doks.com/thumbv2/123dok_br/16681687.743202/51.892.148.660.842.1111/nutritional-characterization-preserved-freezing-obtained-analysis-simões-unpublished.webp)