ABSTRACT
Introduction: Vertical jump tests can be used as estimators of muscular power, physical capacity, mo-tor development and functional capacity. The ability to jump can be analyzed with different methods, including the use of inertial sensors. Objective: To describe and analyze kinematic characteristics using the inertial sensor integrated into the iPhone 4S® and jump contact mat variables in the squat jump (SJ) and countermovement jump (CMJ) tests, and to determine the interaction between kinetic and kinematic variables. Methods: A cross-sectional study was conducted with 27 healthy young adults. The primary outcome measures were linear acceleration, flight time, contact time, jump height and dynamometry of the knee extensors. Spearman’s rho was used to investigate the correlation between variables. The Mann–Whitney U rank-sum test was used for the analysis of intergender variance. Results: The greatest difference between groups (gender) was in the dynamometry variables (p<0.001) and contact mat vari-ables (p<0.001). Between the jump tests, the greatest difference between groups (gender) was in the CMJ test (p<0.001). Conclusion: The inertial sensor embedded in the smartphone demonstrated a correlation with the jump mat and the dynamometry. Finally, the higher kinetic and kinematic scores observed in the jumps performed by male participants than in those performed by female participants suggest that they can be used to better characterize their jumping profile. Level of Evidence IV; Diagnostic Studies - Investigating a Diagnostic Test.
Keywords: Acceleration; Biomechanical Phenomena; Athletic Performance.
RESUMO
Introdução: testes de saltos verticais podem ser utilizados como estimadores de potência muscular, capaci-dade física, desenvolvimento motor e capacicapaci-dade funcional. A capacicapaci-dade de pular pode ser analisada através de diferentes métodos, incluindo o uso de sensores inerciais Objetivo: descrever e analizar características cinemáticas, usando o sensor inercial integrado no iPhone 4S®, e variáveis de contato no tapete de saltos, nos testes de salto com
agachamento (SA) e salto de contraposição (SCP), e determinar a interação entre variáveis cinéticas e cinemáticas. Método: foi realizado um estudo de corte transversal, envolvendo 27 adultos jovens saudáveis. As principais me-didas de resultados foram aceleração linear, tempo de vôo, tempo de contato, altura de salto e dinamometria do joelho. Foi utilizado o Rho de Spearman para a investigação da correlação entre variáveis. O teste Mann-Whitney U de soma de classificação foi utilizado para a análise de variância entre gênero. Resultados: a maior diferença entre os grupos (gênero) estava nas variáveis de dinamometria (p <0,001) e variáveis de contato (p<0,001). Entre o teste de saltos, a maior diferença entre grupos (gênero) estava no teste SCP (p <0,001). Conclusão: O sensor inercial embutido no smartphone demonstrou uma correlação com o tapete de saltos e a dinamometria. Por fim, os scores mais altos (cinéticos e cinemáticos), observados nos saltos dos individuos do gênero masculino em comparação com o feminino, sugerem que podem ser usados para melhor descrever o seu perfil de salto.Nível de Edidência IV; Estudos diagnósticos–Investigação de um exame para diagnóstico.
Descritores: Aceleração; Fenômenos Biomecânicos; Desempenho Atlético.
RESUMEN
Introducción: las pruebas de salto vertical pueden ser utilizadas como estimaciones de potencia muscular, capacidad física, desarrollo motor y capacidad funcional. La capacidad de salto puede ser analizada a través de di-ferentes métodos, entre ellos el uso de sensores inerciales. Objetivo: describir y analizar las características cinemáticas utilizando el sensor inercial integrado en el iPhone 4S®y las variables en las pruebas de agachamiento (SA) y salto
de contraposición (SCP). Métodos: Se realizó un estudio transversal analítico con 27 jóvenes adultos saludables. Las principales variables de resultado fueron aceleración lineal en los tres ejes de movimiento, tiempo de vuelo, tiempo de contacto, altura de salto y dinamometría de los extensores de rodilla. La rho de Spearman se utilizó para la inves-tigación de la correlación entre variables. La prueba de U Mann-Whitney de suma de rangos se utilizó para el análisis de variación entre los grupos de estudio. Resultados: La mayor diferencia entre grupos (género) fue en las variables
KINEMATIC ANALYSIS BY GENDER IN DIFFERENT JUMP
TESTS BASED ON A SMARTPHONE INERTIAL SENSOR
ANÁLISE CINEMÁTICA POR GÊNERO COM BASE NO SENSOR INERCIAL DE UM SMARTPHONE
EM DIFERENTES TESTES DE SALTOS
ANÁLISIS CINEMÁTICO POR GÉNERO COM BASE EN EL SENSOR INERCIAL DE UN SMARTPHONE
EN DIFERENTES PRUEBAS DE SALTO
Mateos-Angulo Alvaro1
(Physical Therapist) Galán-Mercant Alejandro1,2
(Physical Therapist)
Cuesta-Vargas Antonio Ignacio1,3
(Physical Therapist)
1. Universidad de Málaga, IBIMA, Department of Physical Therapist, Málaga, Spain.
2. Universidad de Jaén,Department of Health Science, Área de Fisioterapia, Jaén, Spain.
3. University of Technology, School of Clinical Sciences of the Faculty of Health at the Queensland, Brisbane, Australia.
Correspondence:
Galán-Mercant A. Universidad de Jaén, Área de Fisioterapia, Departamento de Ciencias de la Salud, Jaén, Spain, 23004. [email protected].
ORIGINAL ARTICLE
264
de dinamometría (p <0,001) y tiempo de contacto (p <0,001). Las mayores diferencias localizadas entre los grupos (género) fue en la prueba CMJ (p <0,001). Discusión: El sensor inercial incorporado en el Smartphone demostró una correlación con la matriz de salto y la dinamometría. Las puntuaciones durante la saltametría masculina (cinemática y cinética) fueron más altas que las femeninas. Nivel de Evidencia IV; Estudios de diagnósticos - Investigación de un examen para diagnóstico.
Descriptores: Aceleración; Fenómenos Biomecánicos; Rendimiento Atlético.
INTRODUCTION
There are investigations focused on the changes in anthropometric characteristics during the evolution and growth in boys and girls.1 Other works reported sex differences in jump height with larger increases in height for boys compared to girls at puberty.2 Their results exhibited a highly significant difference in jump performance between genders from the age of 14 years. However, the observed jumping performance changes remain questionable since the relationships between physical performance and anthropometric characteristics between young healthy adults were not studied.
Various approaches can be described in order to evaluate functional capacity; for instance, vertical jump tests. Moreover, the latter could also be used as a predictor of anaerobic capacity, motor development and athletic skills in sports.3 Other research accounts that the vertical jump test could serve as a measuring tool to evaluate functional capacity in the elderly4 and young population.5 Several calculation procedures can be defined so as to assess functional capacity, including vertical launch velocity rate, flight duration, output force, and the trajectory displace-ment of the body centre of mass (COM). Force platform, video-analysis systems, photoelectric cells and contact mats have been a few of the typical determining methods to estimate these variables.
Moreover, innovative tools have recently been launched for the purpose of human motion research, for example inertial sensors, small and handy appliances that offer solutions to the inconveniences of the standard tools for human motion examination.6 In a few studies, ac-celerometer components have been applied to calculate vertical jump capacity.7 These tools identify the acceleration highest values registered while carrying out the routine of vertical jumps.
Nowadays, the modern generation of smartphones are typically manufactured with inertial sensor components and subcomponents, such as accelerometers and gyroscopes, being able to register posi-tion as acceleraposi-tion and inclinaposi-tion. Subsequently, several applicaposi-tions compatible with various operating systems have been developed, being able to show, record and transfer inertial sensor information. Many of the uses of these applications include a great capacity for tracing hu-man motion variables for both investigation and medical uses. Many of these mobile applications are being implemented for use in statuses associated with human movement; for instance the pedometer,8 or the innovation of an evaluation and measurement of kinematic variables instrument, being able to detect frailty in the elderly.9 The ubiquitous accessibility of smartphones in the industrialized countries, due to their important role in most of the population’s daily affairs, small size and handiness, allow these tools to be advantageous for field experiments and consequently in clinical practice.6
Thus, due to the conveniences presented by smartphones as instru-ments for human movement evaluation and analysis, it is of interest to determine the ability to measure and evaluate vertical jump tests. The purpose of this study was to describe kinematic features using the inertial sensor component integrated in the iPhone 4S® and the jump variables obtained with a contact mat in the squat jump (SJ) and
countermovement jump (CMJ) tests from a group of healthy young people across the gender. The second objective in this study was to determine the interaction between study variables (kinetic variables and kinematic variables).
METHODS
Subjects
Twenty-seven subjects executed 81 jumps. The participants were healthy Health Science students, aged from 18 to 35 years old from the University of Malaga (Spain). A physical therapist evaluated the volunteers for the presence of any of the following exclusion criteria: any disability that would make the correct achievement of the tests difficult; any pain that prevented the completion of tests or any pathology that could be aggravated by participating in the study. The study complied with the principles laid out in the Declaration of Helsinki. Ethical approval was received from University of Málaga ethics committee (Protocol number: 309, registration: 89-2015-H). This study was a cross-sectional study completed at the University of Malaga (Spain).
Anthropometry. Weight, height and body mass index (BMI) were obtained following the guidelines of The International Society for the Advancement of Kinanthropometry (ISAK)s.10 The height is the distance from the vertex to the soles of the feet. It is measured with the subject standing in an anatomical position with the occipital region, back, glu-teal region and heels in contact with the height rod. The subject takes a deep breath at the time of measurement. The weight was recorded with the subject barefoot and in underwear. The body mass index (BMI) was calculated by dividing weight in kilograms (kg) by height in metres squared (m2).
Vertical jump performance. Participants performed three trials of the
SJ and CMJ (with arm swing modality) jump tests described by Bosco.11 All the participants completed a 10-minute warm-up consisting of cycling on a cycle-ergometer. After the warm-up, the participants were instructed on how to perform the CMJ and the SJ. A Globus Ergojump Thesys® contact mat was used to record the height (centimetres) and flight time (seconds) through the CMJ with arm swing and SJ tests. The Globus Ergojump® contact mat was validated in a prior study.12 All the participants performed three attempts at each jump (CMJ and SJ). The CMJ test was performed with the subjects starting from an upright posi-tion, performing a rapid downward movement followed by a dynamic complete extension of the lower limbs, the subject performing a quick flexion and extension of the knee joint with minimal stops between ec-centric and conec-centric phases. CMJ was validated in a previous study.13 For the SJ test, all participants were instructed to maintain a static first position with hands on hips and knees in flexion (90º degrees). The
subject performed the jump without any preparatory movement.12
Kinematic variables. Linear acceleration was measured along three orthogonal axes using the iPhone 4S© inertial sensor, which incorporates a three-axis gyroscope, accelerometer and magnetometer. The smart-phone was fixed at L5-S1 level attached to a belt. The orientation and movement of the sensors are presented as axes (x, y, z). With the sensor
aligned with the anatomical axes of the trunk (fixed at L5-S1), the z axis in the smartphone is around the anteroposterior (AP) accelerations, the
x axis in the smartphone is around the mediolateral (ML) accelerations, and the y axis in the smartphone is around the vertical (VT) accelerations. From the accelerometer were obtained: maximum peak, minimum peak, mean and SDs of accelerations in the three axis of movements (AP, ML and VT). In addition, maximum peak, minimum peak, mean and SDs of the vector sum (VS) accelerations (VS = √ x2 + y2 + z2) were obtained. Data were obtained for analysis through SensorLog©, Bernd Thomas© from Apple© AppStore©. The recording rate was set at 30 milliseconds. The recordings were stored in the internal memory of the smartphone and were then sent via email for offline processing. A previous study14 exhibited that the smartphone (iPhone) inertial sensor subunit (ac-celerometer) was accurate against a gold standard (ICC r2>0.98). The accelerometer embedded into iPhone 4S© was accurate and reliable in measuring and quantifying physical activity in the laboratory setting.14 Maximum isotonic strength. Knee extensor isotonic muscle strength was evaluated by bilateral dynamometry through the digital manual
dynamometer POWERTRACK® JtechMedical. This tool incorporates a
load cell affixed to the distal end of the leg of the subject. The dyna-mometer has a digital display that shows the force applied to the load cell in newtons and records the peak of each attempt. The validity of this dynamometer has been demonstrated, with an interclass correlation coefficient (ICC) ranging from 0.72 to 0.85.15
The participant is placed in a sitting position on a stretcher, his hands resting on his legs and feet hanging off the ground. The examiner places one hand to stabilize the subject’s leg and the other hand to support the load cell on the subject’s distal third tibia. Starting from 90° knee flexion, the subject performs a knee extension resisted by the examiner with the load cell. A full extension must be avoided, with the knee flexion reach-ing 5°. The maximum peak force is recorded in the digital dynamometer. The test was performed three times for each subject, with a 2-minute break between tests; the highest value was taken.
Statistical analysis
A database was created from anthropometric data, the inertial sen-sor variables, the jump test variables and maximum isotonic strength of the knee extensor variables. The Kolmogorov–Smirnov test was used to determine normal distribution of the variables. Descriptive statistics were performed with measures of central tendency and dispersion of the variables studied. Spearman’s rho was used for the investigation of the correlation between the kinematic variables, vertical jump variables and maximum isotonic strength variables in SJ and CMJ. Furthermore, the non-parametric Mann–Whitney U rank-sum test was used for the variance analysis between gender jumps. Analysis was performed with SPSS® Statistics Version 20 of IBM® software for Windows.
RESULTS
A total of 27 healthy adults (44.4% female, 55.6% male) signed in-formed consent to participate and complete the study. The anthropo-metric characteristics of the sample were: 24.29 ± 3.90 years (female
– 22.91 ± 2.43 years, – male – 25.40 ± 4.48 years); 173.59 ± 9.74 height
centimetres (female – 165.41 ± 5.60 cm, male 180.13 ± 7.01 cm); 72.57 ± 13.01 weight kilograms (female – 62.70 ± 8.24, kg, male – 80.47 ±
10.49 kg); 23.94 ± 2.95 BMI (female – 22.91 ± 2.79, male – 24.77 ± 2.84).
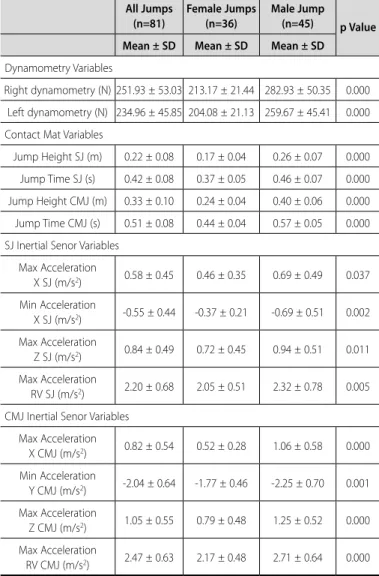
Table 1 shows the jump, kinetic and kinematic characteristics for all the sample (n=81 jumps) and significant differences of the jumps by gender. The highest difference between groups (gender) was in the dynamometry variables (p<0.001) and contact mat variables (p<0.001). Between the jumps test, the biggest difference between groups (gender) was in the CMJ jump test (p<0.001).
Table 2 shows the significant correlation between kinetic and kine-matic variables of the study for all the sample, adjusted by sex, in the SJ test. The inertial sensor embedded in the smartphone demonstrated a correlation between the jump mat, SJ kinematic jump test variables and the dynamometry (see Table 2).
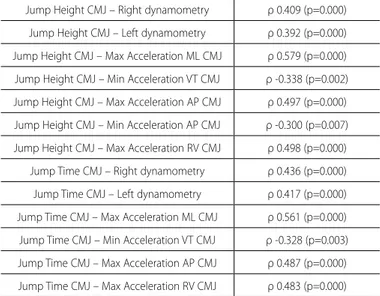
Table 3 shows the significant correlation between jump, kinetic and kinematic variables of the study for all the sample, adjusted by sex, in the CMJ test. The inertial sensor embedded in the smartphone demonstrated a correlation between the jump mat, CMJ kinematic jump test variables and the dynamometry (see Table 3).
Table 1. Jump Kinetic and kinematic characteristic and differences of the jumps by gender (n=81).
All Jumps (n=81)
Female Jumps (n=36)
Male Jump (n=45) p Value
Mean ± SD Mean ± SD Mean ± SD
Dynamometry Variables
Right dynamometry (N) 251.93 ± 53.03 213.17 ± 21.44 282.93 ± 50.35 0.000
Left dynamometry (N) 234.96 ± 45.85 204.08 ± 21.13 259.67 ± 45.41 0.000
Contact Mat Variables
Jump Height SJ (m) 0.22 ± 0.08 0.17 ± 0.04 0.26 ± 0.07 0.000
Jump Time SJ (s) 0.42 ± 0.08 0.37 ± 0.05 0.46 ± 0.07 0.000
Jump Height CMJ (m) 0.33 ± 0.10 0.24 ± 0.04 0.40 ± 0.06 0.000
Jump Time CMJ (s) 0.51 ± 0.08 0.44 ± 0.04 0.57 ± 0.05 0.000
SJ Inertial Senor Variables
Max Acceleration
X SJ (m/s2) 0.58 ± 0.45 0.46 ± 0.35 0.69 ± 0.49 0.037
Min Acceleration
X SJ (m/s2) -0.55 ± 0.44 -0.37 ± 0.21 -0.69 ± 0.51 0.002
Max Acceleration
Z SJ (m/s2) 0.84 ± 0.49 0.72 ± 0.45 0.94 ± 0.51 0.011
Max Acceleration
RV SJ (m/s2) 2.20 ± 0.68 2.05 ± 0.51 2.32 ± 0.78 0.005
CMJ Inertial Senor Variables
Max Acceleration
X CMJ (m/s2) 0.82 ± 0.54 0.52 ± 0.28 1.06 ± 0.58 0.000
Min Acceleration
Y CMJ (m/s2) -2.04 ± 0.64 -1.77 ± 0.46 -2.25 ± 0.70 0.001
Max Acceleration
Z CMJ (m/s2) 1.05 ± 0.55 0.79 ± 0.48 1.25 ± 0.52 0.000
Max Acceleration
RV CMJ (m/s2) 2.47 ± 0.63 2.17 ± 0.48 2.71 ± 0.64 0.000 SD, Standard deviation; Max, maximum; Min, minimum; RV, resultant vector; X, x axis; Y, y axis; Z, z; CMJ, Countermovement Jump Test; SJ, Squat Jump Test; s, second; m, meters; N, Newton.
Table 2. SJ best correlations indexes.
Jump Height SJ – Right dynamometry ρ 0.312 (p=0.005)
Jump Height SJ – Left dynamometry ρ 0.292 (p=0.008)
Jump Height SJ – Max Acceleration ML SJ ρ 0.301 (p=0.006)
Jump Height SJ – Min Acceleration ML SJ ρ -0.257 (p=0.020)
Jump Time SJ – Right dynamometry ρ 0.337 (p=0.002)
Jump Time SJ – Left dynamometry ρ 0.309 (p=0.005)
Jump Time SJ – Max Acceleration ML SJ ρ 0.285 (p=0.010)
Jump Time SJ – Min Acceleration ML SJ ρ -0.234 (p=0.035)
266
In general, the results obtained in this study show lower values in the female group. The most significant differences were found in the dynamometry and contact mat variables. It should be noted that analysing CMJ and SJ, the differences were more pronounced in the CMJ test. In the kinematics variables, in the x, z axis and the value in the resultant vector, the females obtained lower minimum and maximum accelerations in the SJ test than the male group. In the kinematics variables in the CMJ test, the females obtained lower minimum and maximum accelerations than the male group in the x, y, z axis and the value in the resultant vector. Males and females jumped higher in the CMJ than in the SJ (Table 3). It is well established that jumping
could be enhanced by making compensation countermovements.21
The greater height jump score in the CMJ test could be explained by the active state initiated during the preparatory countermovement, whereas in the SJ, the countermovement is inevitably developed during the propulsion phase, so that the muscles can produce more force and work during shortening.23 The muscles’ elastic properties differ in structural composition between male and female, and these differences have a significant impact on the contribution to the force and power transference.24–26
Other structural factors that have an influence on the localized differences are the pennation angle and the cross-sectional area. A greater pennation angle in the quadriceps muscle (vastus medialis) has an impact on the male and female jump test performance scores: males have significantly greater angles.27 In addition, the cross-sectio-nal area plays an important role, in which males are able to activate more motor units resulting in greater force development, greater acceleration peaksand a high jump performance.28,29 With regards to the functionality, muscle function differences between male and female are found in the literature; for example, males have shown a superior aptitude in using the stretch-shortening cycle (active stretch in eccentric contraction of a muscle followed by an immediate shor-tening concentric contraction of that same muscle).24–26 In this active stretch, the storage of elastic energy is required, and this energy is used during the concentric action.30 This stretch load could be greater in males, and this has a direct impact on the kinematic and kinetic variables, which could explain the greater values registered in males with the smartphone inertial sensor in the SJ and CMJ tests in the present study. The higher male jump scores (kinematic and kinetic) compared to those of females suggest that they can be used to better characterize their jumping profile.
CONCLUSION
This study has described the anthropometric characteristics, dyna-mometry variables, contact mat variables (jump height and jump time) in the SJ and CMJ, as well as the kinematic variables from the inertial sensor in the CMJ and SJ jump tests. As predictors, it is important to observe the values of correlation between the kinetic variables with the performance in the jump tests (CMJ and SJ). The differences (active stretch energy load) could be explained by the differences identified in the present study between CMJ and SJ, being greater in CMJ for male than female.
All authors declare no potential conflict of interest related to this article.
AUTHORS’ CONTRIBUTIONS: Each author contributed individually and significantly to the development of this article. AMA (0000-0002-8561-1913)*: data acquisition, statistical analysis and writing the article; AGM 0003-3581-0372)*: writing, anlysis of the study and critically reviewing the article and its intellectual content; AICV (0000-0002-8880-4315)*: design of the study and final approval of the version of the manuscript to be published. *ORCID (Open Researcher and Contributor ID).
DISCUSSION
The inertial sensor built into an iPhone 4S smartphone was used to describe the acceleration variables in three planes of motion and on a contact mat to record flight time, contact time and jump height in SJ and CMJ jump tests. The results of the SJ and CMJ jump tests, across acceleration variables from the smartphone’s inertial sensor, have been described and analysed. In this study, we have demonstrated the cor-relation between the jump mat, the kinematic analysed drop jump tests and the dynamometry in the SJ and CMJ tests. Significant differences were found between the gender groups in dynamometry, contact mat and the inertial sensor variables obtained in the kinematic readings of the trunk during the SJ and CMJ jump tests.
To the best of our knowledge, this is the first study to investigate the relationship between strength, kinematic and jump performance in healthy female and male young people, with the kinetic variables recorded in the instrumentation of the jump tests (CMJ and SJ) using an inertial sensor mobile phone. Two previous studies have studied and analysed jump tests using smartphone instrumentation for the CMJ and SJ tests16. However, these previous studies were focused on the optical measurement of the jump, but not on the acceleration signals.
The present results show different results between gender in the kinetic and kinematics performance in the jump tests (CMJ and SJ). The effects of gender and age on the force-generating capacity (force) of muscle fibres has been previously investigate.17 Similarly, the effects of gender and age on maximal unloaded shortening velocity has been systematically studied.18 Muscle power is considered one of the main determinants of sport performance19 and this muscle power is required in explosive movements like jumps.20 Jump performance is correlated to several physical, mechanical and metabolic components and therefore widely accepted as an index of motor performance.21 In accordance with current evidences, kinematic and kinetic variable measurements were higher in males compared to females during the jump tests. A previous study have attributed the lower kinetic and kinematic values in females to sex differences.22
Table 3. CMJ best correlation indexes.
Jump Height CMJ – Right dynamometry ρ 0.409 (p=0.000)
Jump Height CMJ – Left dynamometry ρ 0.392 (p=0.000)
Jump Height CMJ – Max Acceleration ML CMJ ρ 0.579 (p=0.000)
Jump Height CMJ – Min Acceleration VT CMJ ρ -0.338 (p=0.002)
Jump Height CMJ – Max Acceleration AP CMJ ρ 0.497 (p=0.000)
Jump Height CMJ – Min Acceleration AP CMJ ρ -0.300 (p=0.007)
Jump Height CMJ – Max Acceleration RV CMJ ρ 0.498 (p=0.000)
Jump Time CMJ – Right dynamometry ρ 0.436 (p=0.000)
Jump Time CMJ – Left dynamometry ρ 0.417 (p=0.000)
Jump Time CMJ – Max Acceleration ML CMJ ρ 0.561 (p=0.000)
Jump Time CMJ – Min Acceleration VT CMJ ρ -0.328 (p=0.003)
Jump Time CMJ – Max Acceleration AP CMJ ρ 0.487 (p=0.000)
Jump Time CMJ – Max Acceleration RV CMJ ρ 0.483 (p=0.000)
REFERENCES
1. Alegre LM, Lara AJ, Elvira JLL, Aguado X. Muscle morphology and jump performance: gender and intermuscular variability. J Sports Med Phys Fitness. 2009;49(3);320–6.
2. Asmussen E, Bonde-Petersen F. Storage of elastic energy in skeletal muscles in man. Acta Physiologica. 1974;91(3):385–92.
3. Balsalobre-Fernández C, Tejero-González CM, del Campo-Vecino J, Bavaresco N. (2014). The concurrent validity and reliability of a low-cost, high-speed camera-based method for measuring the flight time of vertical jumps. J Strength Cond Res. 2014;28(2):528–33.
4. Benefice E, Malina R. Body size, body composition and motor performances of mild-to-moderately undernourished Senegalese children. Ann Hum Biol. 1996;23(4):307–21.
5. Bergman RJ, Spellman JW, Hall ME, Bergman SM. Is there a valid app for that? Validity of a free pedometer iPhone application. J Phys Act Health. 2012;9(5):670–6.
6. Bobbert MF, Gerritsen KG, Litjens MC, Van Soest AJ. Why is countermovement jump height greater than squat jump height? Med Sci Sports Exerc. 1996;28(11):1402–12.
7. Bobbert MF, van Soest AJ. Why do people jump the way they do? Exerc Sport Sci Rev. 2001;29(3):95–102. 8. Bojsen-Møller J, Magnusson SP, Rasmussen LR, Kjaer M, Aagaard P. Muscle performance during maximal isometric and dynamic contractions is influenced by the stiffness of the tendinous structures. J Appl Physiol (1985). 2005;99(3):986-94.
9. Bosco C, Luhtanen P, Komi PV. A simple method for measurement of mechanical power in jumping. Eur J Appl Physiol Occup Physiol. 1983;50(2):273-82.
10. Carlos-Vivas J, Martin-Martinez JP, Hernandez-Mocholi MA, Perez-Gomez J. Validation of the iPhone app using the force platform to estimate vertical jump height. J Sports Med Phys Fitness. 2018;58(3):227-32.
11. Cuesta-Vargas AI, Galán-Mercant A, Williams JM. The use of inertial sensors system for human motion analysis. Phys Ther Rev. 2010;15(6):462–73.
12. Deheeger M, Rolland-Cachera MF. [Longitudinal study of anthropometric measurements in Parisian children aged ten months to 18 years]. Arch Pediatr. 2004;11(9):1139–44.
13. Frontera WR, Suh D, Krivickas LS, Hughes VA, Goldstein R, Roubenoff R. Skeletal muscle fiber quality in older men and women. Am J Physiol Cell Physiol. 2000;279(3):C611-8.
14. Galán-Mercant A, Barón-López FJ, Labajos-Manzanares MT, Cuesta-Vargas AI. Reliability and criterion--related validity with a smartphone used in timed-up-and-go test. Biomed Eng Online. 2014;13:156. 15. Galán-Mercant A, Cuesta-Vargas AI. Differences in Trunk Accelerometry Between Frail and Nonfrail Elderly Persons in Sit-to-Stand and Stand-to-Sit Transitions Based on a Mobile Inertial Sensor. JMIR Mhealth Uhealth. 2013;1(2):e21.
16. García-López J, Peleteiro J, Rodgríguez-Marroyo JA, Morante JC, Herrero JA, Villa JG. The validation of a new method that measures contact and flight times during vertical jump. Int J Sports Med. 2005;26(4):294–302.
17. Golle K, Muehlbauer T, Wick D, Granacher U. Physical Fitness Percentiles of German Children Aged 9–12 Years: Findings from a Longitudinal Study. PLoS ONE. 2015;10(11):e0142393.
18. Janot JM, Beltz NM, Dalleck LD. Multiple Off-Ice Performance Variables Predict On-Ice Skating Performance in Male and Female Division III Ice Hockey Players. J Sports Sci Med. 2015;14(3):522-9.
19. Kanehisa H, Ikegawa S, Fukunaga T. Comparison of muscle cross-sectional area and strength between untrained women and men. Eur J Appl Physiol Occup Physiol. 1994;68(2):148–54.
20. Komi PV, Bosco C. Utilization of stored elastic energy in leg extensor muscles by men and women. Med Sci Sports. 1978;10(4):261–5.
21. Krivickas LS, Suh D, Wilkins J, Hughes VA, Roubenoff R, Frontera WR. Age- and gender-related differences in maximum shortening velocity of skeletal muscle fibers. Am J Phys Med Rehabili. 2001;80(6):447-55.
22. Laffaye G, Choukou MA. Gender bias in the effect of dropping height on jumping performance in volleyball players. J Strength Cond Res. 2010;24(8):2143-8.
23. Laffaye G, Choukou M, Benguigui N, Padulo J. Age-and gender-related development of stretch shortening cycle during a sub-maximal hopping task. Biol Sport. 2016;33(1):29-35.
24. Miller AEJ, MacDougall JD, Tarnopolsky MA, Sale DG. Gender differences in strength and muscle fiber characteristics. Eur J Appl Physiol Occup Physiol. 1993;66(3):254-62.
25. Pijnappels M, van der Burg PJCE, Reeves ND, van Dieën JH. Identification of elderly fallers by muscle strength measures. Eur J Appl Physiol. 2008;102(5):585-92.
26. Quagliarella L, Sasanelli N, Belgiovine G, Moretti L, Moretti B. Power output estimation in vertical jump performed by young male soccer players. J Strength Cond Res. 2011;25(6):1638-46.
27. Riddiford-Harland DL, Steele JR, Baur LA. Upper and lower limb functionality: are these compromised in obese children? Int J Pediatr Obes. 2011;1(1):42–9.
28. Ross W, Hebbelinck M, Faulkner R. Kinanthropometry terminology and landmarks. In: Shepard R, and Lavalle H. Physical Fitness Assessment. Springfield: Charles Thomas; 1978. p. 44-50.
29. Roy JS, MacDermid JC, Orton B, Tran T, Faber KJ, Drosdowech D, et al. The Concurrent Validity of a Hand-held versus a Stationary Dynamometer in Testing Isometric Shoulder Strength. J Hand Ther. 2009;22(4):320–7.