original article
RBCDH
Licence Creative Commom
CC
Relationship between running kinematic
changes and time limit at vVO
2max
Relação entre modiicações cinemáticas da corrida e o
tempo limite na vVO
2máxLeonardo De Lucca1
Sebastião Iberes Lopes Melo1
Abstract– Exhaustive running at maximal oxygen uptake velocity (vVO2max) can alter running kinematic parameters and increase energy cost along the time. he aims of the present study were to compare characteristics of ankle and knee kinematics during running at vVO2max and to verify the relationship between changes in kinematic vari-ables and time limit (Tlim). Eleven male volunteers, recreational players of team sports, performed an incremental running test until volitional exhaustion to determine vVO2max and a constant velocity test at vVO2max. Subjects were ilmed continuously from the let sagittal plane at 210 Hz for further kinematic analysis. he maximal plantar lexion during swing (p<0.01) was the only variable that increased signiicantly from beginning to end of the run. Increase in ankle angle at contact was the only variable related to Tlim (r=0.64; p=0.035) and explained 34% of the performance in the test. hese indings suggest that the individuals under study maintained a stable running style at vVO2max and that increase in plantar lexion explained the performance in this test when it was applied in non-runners.
Key words: Kinematics; Running; vVO2max
Resumo– A corrida realizada na velocidade do consumo máximo de oxigênio (vVO2máx)pode ocasionar modiicações nos parâmetros cinemáticos e assim, aumentar o custo energético ao longo do tempo.O objetivo do presente estudo foi analisar características cinemáticas da articulação do tornozelo e joelho durante a corrida na vVO2máx e a relação entre modiicações cinemáticas e o tempo limite na vVO2máx(Tlim). Onze voluntários ativos isicamente foram submetidos a um teste incremental de corrida para determinar a vVO2máx e posteriormente, a um teste de velocidade constante na vVO2máx. As variáveis cinemáticas foram adquiridas através de ilmagem bidimensional a 210Hz no plano sagital esquerdo, no estágio inicial e inal da corrida.De todas as variáveis angulares analisadas, a máxima plantilexão no balanço (p<0.01) foi a única que aumentou signiicativamente entre o início e o inal da corrida. O aumento no ângulo do tornozelo no contato foi correlacionado ao Tlim (r=0,64; p=0,035) e explicou 34% do desempenho no teste. Esses achados sugerem que os sujeitos mantêm um estilo de corrida relativamente estável na vVO2máx e que o aumento da plantilexão no contato
1 Universidade do Estado de Santa Catarina. Centro de Ciências da Saúde e do Esporte. Laboratório de Biomecânica. Florianópolis, SC. Brasil.
INTRODUCTION
Kinematic analysis of exhaustive running (prolonged submaximal running and short and medium-duration running at high intensity) becomes im-portant due to possible changes in stride pattern1. his fact is related to the
continuous increase in blood lactate [La] and to metabolite accumulation in muscle ibers at intensities corresponding to heavy and severe domains2,
which would cause kinematic changes in the stride cycle3.
he lower limbs have the role of absorbing energy by means of eccen-trically controlled dorsilexion4 and knee lexion3 at landing. Elliot and
Ackland5 highlighted the importance of the ankle joint by reporting that
foot biomechanical parameters may have the major inluence on running biomechanical characteristics and on the performance in a 10-km race. Fatigue could cause an imbalance in dorsilexor and plantar lexor muscles, increasing leg impact acceleration and becoming a risk factor for injuries6.
Other authors reported that ankle muscle fatigue caused decreased dor-silexion at foot contact with the ground7 and that changes in ankle angle
explained 67% of the variance in oxygen uptake (VO2) during running performed ater long-duration cycling exercise8. Similarly, the knee joint
would have a key role both in shock absorption3 and running energy cost9.
It is well-known that training sessions to increase VO2max should be performed at velocities close or corresponding (vVO2max) to this physiologi-cal index10. herefore, it is interesting for sport science researchers and for
trainers for some running competitions to understand the physiological and biomechanical mechanisms that may inluence the time during which vVO2max can be sustained. For instance, in running competitions such as 800- and 1500-m races, the required VO2 is close to or above VO2max11;
fur-thermore, Tlim and vVO2max were associated with performance at distances from 1500 meters to Marathon12,13.
In order to study the great variability in Tlim among individuals, Ribeiro et al.14 analyzed cardiorespiratory (VO
2max, vVO2max, running
economy, and ventilatory threshold) and neuromuscular (isotonic strength, velocity at maximal anaerobic running test, and vertical jump) variables and demonstrated that none of these variables could explain such variabil-ity. Gazeau et al.15 investigated biomechanical variables and, based on the
results of their research, stated that runners who maintained more stable running styles were able to increase Tlim. Hayes et al.16 showed strong
negative correlations between local muscle resistance of lexors and exten-sors of the hip and knee and the kinematic changes (∆) in vVO2max that occur between the beginning and the end of the run, which reveals that runners with higher local muscle resistance had less changes in kinematic variables during the run.
are caused by muscle fatigue and that they can inluence running perfor-mance, the aims of the present study were to compare characteristics of ankle and knee kinematics during running at vVO2max and to investigate the relationship between kinematic changes and Tlim.
METHODOLOGY
Subjects
he study included eleven physically active male volunteers, recreational athletes who played team sports such as soccer, indoor soccer, and handball for 12 years, on average, and who had no previous experience in running on a treadmill. Mean and standard deviation for age, body mass, height, and body fat percentage were 23.17 (3.17) years, 71.7 (6.2) kg, 173.9 (5.5) cm, and 9.4 (2.9)% respectively. Before the beginning of the procedures, all volunteers signed a free and informed consent form providing information on the study, which was approved by the Ethics Committee for Research involving Human Beings at Universidade do Estado de Santa Catarina, protocol no. 27/2010.
Determination of vVO
2maxVVO2max was determined by an incremental protocol on a treadmill, with an initial velocity of 8.3 km.h-1 (1% slope) and increments in velocity every
3 minutes (9.3km.h-1; 10.4 km.h-1; 11.6 km.h-1; 12.6 km.h-1; 13.7 km.h-1; 14.7
km.h-1; 15.7 km.h-1;16.8 km.h-1; 17.8 km.h-1) until volitional exhaustion.
VO2max was considered the highest recorded value from means calculated every 15 seconds17. VVO
2max was considered the minimum velocity in
which VO2max was reached and sustained for at least 1 minute. If VO2max was not maintained for 1 minute, the velocity from the preceding stage was considered the vVO2max17.
Determination of Tlim
Ater the incremental test, new visits took place 48 hours ater the irst one, for running tests at 100% of vVO2max. Subjects performed a warm-up consisting of a 5-minute run on the treadmill at 60% of vVO2max17. At the
end of the warm-up, they rested their feet outside the treadmill belt and were verbally informed about the test procedures. Subjects began running at lower velocities until reaching vVO2max, for a period of less than 30 sec-onds on average. he Tlim was considered the time interval between the moment when the treadmill reached vVO2max and the moment when the individual volitionally stopped the test. During both tests, subjects were verbally encouraged by the evaluators until volitional exhaustion.
Acquisition of kinematic data
of 210 Hz was used at 2.30 m of distance from the treadmill and 1.0 m above the ground level. Eight joint relective markers (5th metatarsal, lateral border
of the calcaneus, lateral malleolus, lateral epicondyle of the knee, greater trochanter of the femur, greater tubercle of the humerus, lateral epicondyle of the humerus, and styloid process of the ulna) were ixed at the let side of the body directly onto the skin ater shaving and alcohol cleaning.
For the purpose of comparative analysis, data were collected at two time-points: a) beginning: irst foot contact with the ground 20 seconds ater the subject reached vVO2max; b) inal: the moment when the 5 strides of interest precede 10 seconds to the end of the test. In each of the mo-ments, ive full stride cycles were analyzed. A stride cycle was considered the interval between two successive contacts of the calcaneus of a same foot with the ground.
Studies with a similar design used cycles of 1 stride18, 3 strides16, and
5 strides7. Authors showed that there is great validity (r=0.96) between
strides in relation to temporal and kinematic variables for male runners19
and that, even among not highly trained runners, the reproducibility of kinematic parameters (hip and knee angles) was high20.
To determine ankle angle in neutral position, video imaging of the subject in upright position with no treadmill slope was obtained. We considered the angle formed between the segment feet (deined from 5th metatarsal and lateral malleolus markers) and the segment leg (deined from lateral malleolus and lateral epicondyle of the femur markers). For reference, ankle angle in neutral position was considered to be 0º (angles greater than 0º indicate dorsilexion and angles less than 0º indicates plantar lexion)7.
Knee values were estimated on the basis of Knee Supplementary Angle: 180º minus knee internal angle7.
As for the ilming area, a square-shaped calibrator with 4 m2 was used,
manufactured with white pipes and tubes of polyvinyl chloride (PVC). he vertices of this square were marked with black insulating tape to contrast with the material from the pipes and tubes and to be used as a reference for measuring the sides of the calibrator.
he videos were exported to the Ariel Performance Analysis System (APAS) sotware and then the process of semi-automated digitalization began. A model for digitalizing the 8 marker points was created, followed by the formulation of a two-dimensional calibration model with X and Y coordinates. Ater the formulation of the model and the digitalization, the marker points were transformed by the APAS sotware using the DLT
(Direct Linear Transformation) method and iltered with a 4th order
But-terworth ilter with a cutof frequency of 6 Hz, in an attempt of eliminating any possible noise, instrument failure or digitalization errors.
dur-ing swdur-ing (MPFS), ankle range of motion (ARM), knee range of motion (KRM) – both ranges deined as the diference between the higher and the lower angle recorded during the stride cycle –, knee angle at initial contact (KAC), maximal knee lexion angle during stance (MKFSt), maximal knee lexion angle during swing (MKFSw), knee extension angle at toe-of (KET). he kinematic changes between the beginning and the end of the running exercise were computed as the diference between initial and inal values and expressed in absolute values.
Statistical Treatment
Ater the normal distribution of data (Shapiro-Wilk test) was conirmed, the t-Student test was applied to compare angular variables from the beginning and the end of the run. Cohen’s d efect size was used for a better practical description. Efect size values (d) were classiied as: 0.0 to 0.19 = trivial; 0.20 to 0.59 = small; 0.60 to 1.19 = moderate; 1.20 to 1.99 = large; 2.00 to 4.00 = very large21. he relationship between kinematic changes and Tlim
was tested using the Pearson correlation test. A regression analysis (enter method) was applied to ascertain the contribution of kinematic changes to Tlim. To do so, variables that presented signiicance level for the correla-tion between kinetic changes and Tlim below 0.25 were selected, because this condition can result in variables with high relationship power22. he
signiicance level was set at p<0.05.
RESULTS
Mean results for the group that performed the progressive and continuous tests are shown in table 1.
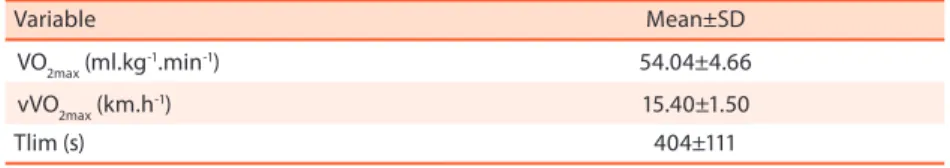
Table 1. Physiological indices derived from incremental and continuous tests.
Variable Mean±SD
VO2max (ml.kg-1.min-1) 54.04±4.66
vVO2max (km.h-1) 15.40±1.50
Tlim (s) 404±111
VO2max: maximal oxygen uptake (VO2max); vVO2max: maximal oxygen uptake velocity; Tlim: time limit at vVO2max.
he comparison of mean values for the kinematic variables between initial (I) and inal (F) running stages at Tlim is shown in table 2.
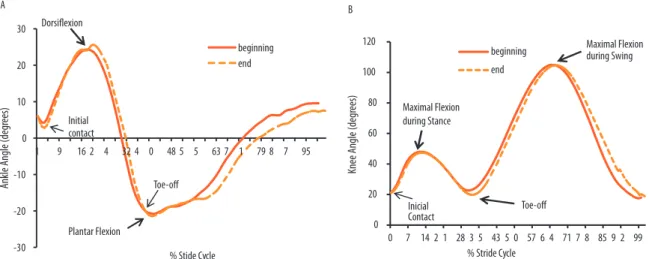
Based on the comparisons presented in table 2, it was possible to ob-serve that maximal plantar lexion during swing was the only variable that increased signiicantly (p<0.01), and that none of the knee angles showed signiicant diference between the beginning and the end of the run. An-gular values (mean for the group) for ankle and knee along the stride cycle are expressed in igure 1A and 1B respectively.
and 100% of the cycle). Knee values were superposed from initial contact to near toe-of (~28% of the cycle), and also at knee extension – propulsion phase – (between 28 and 35% of the cycle), at maximal lexion during swing (between 64 and 71% of the cycle), and during the preparation for the next contact with the ground (71 to 100% of the cycle).
Table 2. Comparison of kinematic variables between the beginning and the end of the run
Variable (Mean±SD) (%) t p d
Ankle angle at initial contact - AAC (o)
I F
5.81±2.07
5.13±4.78 11.7 0.700 0.500
0.32 Small
Ankle angle at toe-of - AAT (o)
I F
-19.23±5.07
-18.95±5.76 1.5 -0.315 0.759
0.05 Trivial
Maximal dorsilexion during stance - MDS (o)
I F
26.23±4.69
26.78±5.64 2.0 -0.649 0.531
0.11 Trivial
Maximal plantar lexion during swing - MPFS (o)
I F
-24.03±7.32
-25.79±7.67 7.1 3.143 0.009*
0.25 Small
Ankle range of motion - AROM (o)
I F
50.81±7.22
52.71±6.45 3.6 -1.796
0.103 0.26
Small
Knee angle at initial contact - KAC (o)
I F
20.40±5.03
20.49±5.04 0.4 -0.064 0.950
0.01 Small
Maximal knee lexion angle of during stance - MKFSt (o)
I F
48.18±6.10
48.60±4.91 0.8 -0.336 0.744
0.06 Trivial
Knee angle at toe-of - KAT (o)
I F
18.09±6.67
17.04±6.86 5.8 1.301 0.222
0.15 Trivial
Maximal knee lexion angle during swing - MKFSw (o)
I F
108.67±9.27
110.73±9.43 1.8 -1.696 0.121
0.22 Small
Knee range of motion - KROM (o)
I F
90.58±11.51
93.68±12.42 3.3 -2.205 0.052
0.26 Small
%: percentage diferences; t: t-Student values; p: signiicance; d: Cohen’s efect size; *p ≤ 0.01; I: initial stage; F: inal stage
A B -30 -20 -10 0 10 20 30
1 9 16 2 4 32 4 0 48 5 5 63 7 1 79 8 7 95
Ankle Angle (degr
ees)
% Stide Cycle
beginning end Plantar Flexion Initial contact 0 20 40 60 80 100 120
0 7 14 2 1 28 3 5 43 5 0 57 6 4 71 7 8 85 9 2 99
Knee Angle (degr
ees)
% Stride Cycle beginning end Maximal Flexion during Stance Maximal Flexion during Swing Inicial Contact
Figure 1. Angular values for ankle (A) and knee (B) along the stride cycle at the beginning and the end of the test.
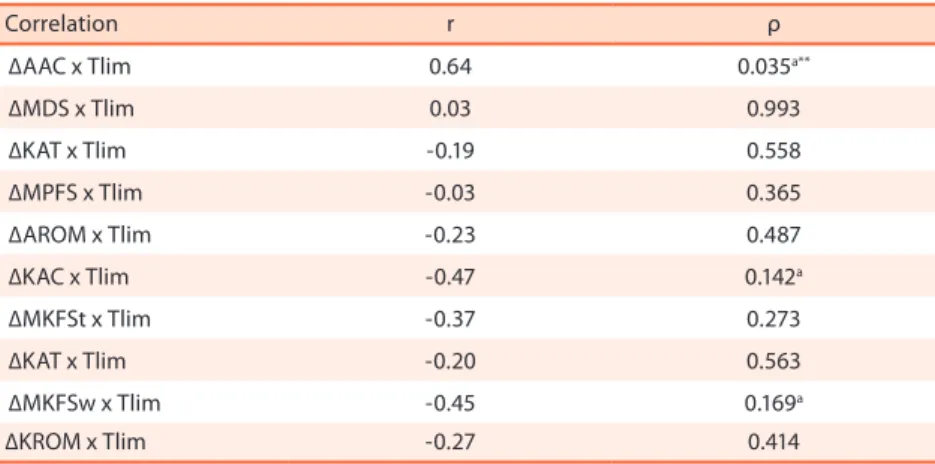
Table 3. Correlation coeicients between kinematic changes (∆) and Tlim.
Correlation r ρ
∆AAC x Tlim 0.64 0.035a**
∆MDS x Tlim 0.03 0.993
∆KAT x Tlim -0.19 0.558
∆MPFS x Tlim -0.03 0.365
∆AROM x Tlim -0.23 0.487
∆KAC x Tlim -0.47 0.142a
∆MKFSt x Tlim -0.37 0.273
∆KAT x Tlim -0.20 0.563
∆MKFSw x Tlim -0.45 0.169a
∆KROM x Tlim -0.27 0.414
Tlim: Time limit at vVO2max; **Signiicant diference p<0.05; a Variables included in multiple regression.
Based on the results for the correlation test presented in table 3, it is noticed that the change in ankle angle at contact was the only variable that showed a signiicant positive correlation with Tlim.
Table 4 presents the variables that had a prediction ability with Tlim. It can be observed that the increase in ankle angle at contact explains 34% of the performance in the test. However, when it was analyzed together with the changes in knee angle at contact and maximal knee lexion during swing, its predictive power was not signiicant.
Table 4. Multiple regression for selected kinematic changes, considering Tlim as the dependent variable.
Independent Variable Adjusted R2 p
∆AAC 0.34 0.035*
Tlim ∆AAC + ∆KAC 0.35 0.074
∆AAC + ∆KAC + ∆MKFSw 0.37 0.107
*p<0.05
DISCUSSION
he aims of present study were to compare kinematic characteristics be-tween the beginning and the end of the run at vVO2max and to investigate the relationship between kinematic changes and Tlim. It was demonstrated that a) maximal plantar lexion during swing was the only variable to increase signiicantly; and b) the increase in ankle angle at contact was related to Tlim and explained 34% of the performance in the test.
he increase in maximal plantar lexion during swing corroborates the indings of Kellis and Liassou7. In fact, dorsilexor and plantar lexor muscles
afect foot position not only at contact but also during toe-of and swing4,22.
Accordingly, an increase in gastrocnemius activity was observed during swing with plantar lexor fatigue7, which may explain the higher plantar
measures the diference between means in terms of standard deviation units (d=0.24), was also considered small. he use of this measuring tool is an attempt of replacing the concept of statistical signiicance with more useful notions of practical signiicance. hus, if we link the results of the present study with those of other authors who consider a diference below two degrees in ankle and knee angles during the run to be insigniicant8,
it can be inferred that these changes are not relevant.
he ankle angle at initial contact, stance and toe-of did not change between the beginning and the end of the run. On the other hand, Christina et al.4 and Kellis and Liassou7 showed that dorsilexion at contact decreased
ater a fatigue protocol of dorsilexor and plantar lexor muscles. Increased dorsilexion during contact reduces energy conversion from translational to rotational, because most of the energy is lost at collision with the ground. herefore, landing with less dorsilexion can improve storage and conver-sion of elastic energy23.
Based on these assumptions, one have an explanation for the fact that the change in ankle angle at contact was the only variable that showed a signiicant positive correlation with Tlim (r=0.64; p<0.05) and explained 34% of Tlim. hus, it is inferred that increasing plantar lexion at foot strike with the ground can improve the performance in the test. Similarly, Bonacci et al.8 showed that changes in ankle angle at contact explained
67% of the variance in VO2 when triathletes performed a submaximal running ater a 45-minute cycling exercise. In fact, plantar lexion posi-tion at initial contact can be more efective, reducing stance time, because rotational energy is transferred more efectively23, whichimproves running
economy8. Although the diference in ankle angle at contact between the
beginning and the end of the run was not signiicant in the present study, it was the variable that showed the highest percentage variation (7%) and the highest efect size (d=0.32).
he knee angle did not show signiicant diferences in any phase of the cycle, which corroborates with Heyes et al.15, who analyzed sub-elite
runners at vVO2max, but is opposed to several studies that investigated the efects of fatigue on knee angle at contact and maximal knee lexion during stance in submaximal running1,7,24, in which subjects increased lexion. he
higher lexion at initial contact reduces the likelihood of injuries due to the lower reaction force of the ground and the better shock absorption18,24.
Moreover, the stretching-shortening cycle has the role of improving the ability of producing force during the inal phase (concentric action). It is inferred that the less economic running is related to a more complacent running style (less vertical stifness), which can be represented by a higher knee lexion and a delay in the transition from stretching to subsequent shortening25. In the fatigue state, changes in the ground reaction force are
associated with diiculties in maintaining angular displacements constant, and the reduction in force ater the impact is probably related to a higher knee lexion26. A consequence of this process would be that, in order to
running velocity, the individual must perform a higher muscle workload during the propulsion phase, causing a higher fatigue progression26.
Valiant9 estimated an increase of 25% in VO
2 for every 5
o of increase in
maximal knee lexion during stance, which leads one to believe that this angle determines the metabolic cost associated with shock attenuation. In this case, as with knee angle at contact, the subjects of the present study may have maintained maximal knee lexion during stance as an attempt to avoid an increase in metabolic cost during the inal stages, even with impaired shock attenuation
he study presented some technical limitations, such as the recruitment of non-runners individuals with no experience in running on a treadmill and the fact that motion analysis was limited to the sagittal plane. In this case, diferences in running economy between treadmill and track seems to exist, due to runner’s inexperience on the treadmill, which could lead to imbalances and changes in running technique and a possible variation in velocity on the treadmill from foot contact with the walking belt27.
Furthermore, the ankle moves in the three planes of motion, and it is well-known that the rotation axis of this joint is not perpendicular to the sagittal plane. hus, it bears stressing that the two-dimensional measure can be limited in comparison with the three-dimensional measure. Foot pronation, dorsilexion and abduction occur in the frontal, sagittal and transverse planes respectively. here is a causal relationship between hy-perpronation and excessive use injuries, because pronation is necessary to attenuate impact forces28. herefore, in situations of muscle fatigue, it
would be interesting to analyze foot pronation angle as well, for a better discussion on motion in the sagittal plane and on the relationship with the performance in the test.
CONCLUSIONS
It can be concluded that, during running at vVO2max, subjects maintain a rel-ative stable running style, because no diference with practical signiicance was observed between the beginning and the end of the run. Increasing ankle plantar lexion at contact during the test might have some beneicial efect on prolonging Tlim and could thus explain the performance in the test among non-runners subjects.
Acknowledgements
We thank CAPES for providing scholarships, which was essential for car-rying out this research.
REFERENCES
1. Mizrahi J, Verbitsky O, Isakov E, Daily D. Efect of fatigue on leg kinematics and impact acceleration in long distance running. Human MovSci 2000;19(2):139-51 2. Smith, CGM, Jones AM. he relationship between critical velocity, maximal
3. Derrick TR, Dereu D, Mclean SP. Impacts and kinematic adjustments during an exhaustive run. Med Sci Sports Exerc 2002;34(6):998-1002.
4. Christina KA, White SC, Gilchrist LA. Efect of localized muscle fatigue on verti-cal ground reaction forces and ankle joint motion during running. Hum Mov Sci 2001;20(3):257-76.
5. Elliot B, Ackland T. Biomechanical efects of fatigue on 10.000 meter running technique. Res Q Exerc Sport 1981;52(2):160-6.
6. Mizrahi J, Verbitsky O, Isakov E. Shock accelerations and attenuation in downhill and level running. Clin Biomech 2000;15(1)15-20.
7. Kellis E, Liassou C. he efects of selective muscle fatigue on Sagittal Lower Limb Kinematics and Muscle Activity during Level Running. J Orth Sports Phys her 2009;39(3):210-20.
8. Bonacci J, Green D, Saunders PU, Blanch P, Franettovich M, Chapman AR, et al. Change in running kinematics ater cycling are related to alterations in running economy in triathletes. J Sci Med Sport 2010;13(4):460-4.
9. Valiant GA. Transmission and attenuation of heelstrike accelerations. In: Biome-chanics of Distance Running, P. R. Cavanagh PR, editor. Champaign, IL: Human Kinetics;1990.p.225-247,
10. Bassett DRJ, Howley ET. Limiting factors for maximum oxygen uptake and de-terminants of endurance performance. Med Sci Sports Exerc 2000;32(1):70-84. 11. Hill DW. Energy systems contributions in middle-distance running events. J Sports
Sci 1999;17(6):477-83.
12. Billat VL, Hill DW, Pinoteau J, Petit B, Koralsztein J. Efect of protocol on determi-nation of velocity at VO2max and on its time to Exhaustion. Arch Physiol Biochem 1996;104(3):313-21.
13. Di Prampero PE, Atchou G, Bruckner JC, Moia C. he energetics of endurance running. Eur J Appl Physiol1986;55(1):259-66.
14. Ribeiro LG, Santos TM, Lima JRP, Novaes JS. Determinantes do Tempo Limite na velocidade correspondente ao VO2máx em indivíduos isicamente ativos. Rev Bras Cineantropom Desempenho Hum 2008;10(1):69-75.
15. Gazeau F, Koralsztein JP, Billat V. Biomechanical Events in the Time to Exhaustion at Maximum Aerobic Speed. Arch Physiol Biochem 1997;105(6):583-90.
16. Hayes PR, Bowen SJ, Davies EJ. he relationships between local muscular endur-ance and kinematic changes during a run to exhaustion at vVO2max. J Strength Cond Res 2004;18(4):898-903.
17. Billat VL, Blondel AN, Berthoin AS. Determination of the velocity associated with the longest time to exhaustion at maximal oxygen uptake. Eur J Appl Physiol 1999;80(2):159-61.
18. Tartaruga LAP, Coertjens M, Black GB, Tartaruga MP, Ribas LR, Kruel LFM. Efeitos da fadiga na cinemática de corredores. Rev Bras Biomec 2003;4(6):39-44. 19. Morgan DW, Martin PE, Krahenbuhl GS, Baldini FD. Variability in running
economy and mechanics among trained male runners. Med Sci Sports Exerc 1991;23(3):378-83.
20. Hershler C, Milner M. Angle-angle diagrams in the assessment of locomotion. Am J Phys Med 1980;59(3):109-125.
21. Hopkins WG, Marshall SW, Batterham AM, Hanin J. Progressive statistics for stud-ies in sports medicine and exercise science. Med Sci Sports Exerc 2009;41(1):3-13. 22. Hosmer DW, Lemeshow S. Applied logistic regression. New York: Wiley, 1989. 23. Lieberman DE, Venkadesan M, Werbel WA, Daoud AI, D’Andrea S, Davis IS, et al.
Foot strike patterns and collision forces in habitually barefoot versus shod runners. Nature 2010;463(7280):531–535.
24. Derrick TR, Dereu D, Mclean, S. P. Impacts and kinematic adjustments during an exhaustive run. Med Sci Sports Exerc 2002;34(6):998-1002.
Corresponding author
Leonardo De Lucca R. Pascoal Simone, 358 Centro de Ciências da Saúde e do Esporte
Universidade do Estado de Santa Catarina
Laboratório de Biomecânica Email: [email protected]
26. Horita T, Komi PV, Nicol C, Kyrolainen H. Efect of exhausting stretch-shortening cycle exercise on the time course of mechanical behaviour in the drop jump: pos-sible role of muscle damage. Eur J Appl Physiol 1999;79(2):160-7.
27. Davies CT. Efects of wind assistance and resistance of the forward motion of a runner. J Appl Physiol 1980;48(4):702-9.