CHAPTER 6
Body fat measurement in adolescent athletes: multicompartment
molecular model comparison
31Analiza M. Silva, Claudia S. Minderico, Pedro J. Teixeira, Angelo Pietrobelli and Luís B. Sardinha
ABSTRACT
The purpose of this study was to assess the accuracy of air displacement (ADP) and DXA percent fat mass (%FM) estimations in comparison with a reference five-compartimental (5C) model used as the reference method. A total of 32 girl (age: 15.1±0.3 years; BMI: 20.2±2.6 kg/m2) and 46 boy (age: 15.3±1.2 years; BMI: 22.0±2.5 kg/m2) athletes were measured. Body volume was assessed by ADP, bone mineral content by DXA, and total body water by deuterium dilution. Statistical analyses included examination of the coefficient of correlation (r), standard error of estimation (SEE), slope, intercept, and pure error (PE) and the agreement between models. For boys and girls, differences between the 5C model and ADP %FM were 0.2 and 1.7% (r=0.86 and 0.98, SEE=2.50 and 1.55%, PE=2.77 and 2.23%),
respectively. Differences between the 5C model and DXA %FM were –1.0 and –3.7% (r=0.85 and 0.91, SEE=2.60 and 2.91%, PE=2.90 and 4.66%), respectively for boys and girls. For girls, regression between ADP and DXA against the reference method did not differ from the line of identity (p>0.05) while for boys differences were found (p<0.05). DXA overestimated %FM, particularly in girls. For both genders, large limits of agreement were found between reference method and both techniques, with the exception of ADP in female athletes. We conclude that the two techniqueswere not precise for individual %FM prediction, though ADP revealed a better agreement for girls. However, considering all performance criteria for mean group, our analysis highlights ADP as an accurate and nonbiased tool in the evaluation of body
composition in adolescent athletes.
“To improve is to change; to be perfect is to change often.” Winston Churchill
INTRODUCTION
Therefore, more recently, a new approach to obtain this component was proposed (22), enabling the use of a 5C molecular model, which divides body mass into fat, water, bone mineral, soft tissue mineral, and protein.
DXA has emerged as one of the most widely accepted methods in the
assessment of body composition in children and adolescents (23-25). This method has advantages over other laboratory techniques as it provides whole-body and regional estimates of body composition into fat, lean tissue mass (LTM), and bone mineral content (BMC). Because DXA does not rely on the assumptions of a 2C model to provide estimates of body composition and because it does not depend on subject performance, DXA is sometimes regarded as a standard against which other methods can be validated (26-29). However, like most other methods for measuring body composition, DXA is also subject to error (30-33). Few studies have been conducted to validate DXA against multicompartment models during growth and maturation (16, 34-38).
In addition, the physiological changes due to the interaction of growing and the training process in athletes may alter the FFM composition, namely the protein and water constituents, and in turn the assumption that FFM hydration and density are constant. Studies on a few small groups of athletes have found systematic differences between estimates from body density (39-41), indicating that FFM density is different from 1.1 g/cm3, whereas studies of other groups have not reached the same conclusion (40, 42-44).
population. As a result, the purpose of the present study was to compare percent body fat estimations using ADP and DXA with the gold standard 5C molecular model in adolescent athletes.
METHODS Subjects
Body composition data were collected in 32 girls (age: 15.1 ± 0.3 y; weight: 56.2 ± 14.2 kg; stature: 1.65 ± 0.13 m; BMI: 20.2 ± 2.6 kg/m2) and 46 boys (age: 15.3 ± 1.2 y; weight: 71.5 ± 12.3 kg; stature: 1.80 ± 0.12 m; BMI: 22.0 ± 2.5 kg/m2) 13 pubescent (8 boys and 5 girls) and 64 post-pubescent (38 boys and 27 girls), who volunteered to participate in this study. Subjects were recruited from five sports clubs in Lisbon (Portugal) and were involved in a variety of professional sports (swimming, basketball, rugby, gymnastic, and judo). All subjects were informed about the
research design and signed a consent form according to the regulations of the Ethical Committee of the Faculty of Human Movement, Technical University of Lisbon. After a 12-hour fast, subjects came to the laboratory where all measurements and testing were carried out, in the same morning.
Maturation
Subjects were grouped by puberty stage, determined by self-assessment according to Tanner stage (45) and adapted by Ross and Marfell-Jones (46). A self-evaluation method, with figures, was used to identify the degree of development of the genital organs, breast, and pubic hair.
Reliability
6.8 yrs) and BMI from 20.8 to 27.9 kg/m2 (mean ± SD: 24.6 ± 2.4 kg/m2) for the following measurements: body volume, bone mineral content, total-body water, and the propagation of measurement error calculation.
Body composition Measurements
Body volume (BV) was assessed by air displacement plethysmograph (BOD
POD , Life Measurement Inc, Concord, CA, USA). Each subject wore a swimming suit and their body mass was measured to the nearest 100 g by an electronic scale connected to the plethysmograph computer. BV was computed based on the initial body volume corrected for thoracic gas volume and a surface area artefact computed automatically. Measured thoracic gas volume was obtained in all subjects. Body density (Bd) was then calculated as body mass divided by BV. Percent body fat (%FMADP) was estimated from body density based on a two-compartment model using the Siri’s equation (2):
%FMADP = [(4.95/B) – 4.50]x100 (1) Also, Lohman’s age-adjusted constants (47) were used to convert body density into %FM (%FMLohman). All measurements were conducted with the BOD POD software version 1.68. The technical error of measurement (TEM) and the coefficient of variation (CV) for BV were 0.17 L and 0.5 %, respectively.
Total body bone mineral was estimated using DXA (QDR-1500, Hologic,
bone mineral (TBBM) by multiplying it by 1.0436 (48). The TEM and CV for BMC in our laboratory were 0.02 kg and 1.6 %, respectively.
Total body water (TBW) was assessed by deuterium dilution technique using
a stable Hydra gas isotope ratio mass spectrometer (PDZ, Europa Scientific, UK). After a completed 12h fast, an initial urine sample was collected and immediately administrated a deuterium oxide solution dose (2H2O) of 0.1g/kg of body weight diluted in 30 mL of water. After a 4 h equilibration period, new urine sample was collected. Abundances of 2H2O in dilutions of the isotope doses were analyzed. Urine and diluted dose samples were prepared for 1H/2H analysis using the equilibration technique of Prosser and Scrimgeour (49). After the tubes were filled they were equilibrated at 20 ± 1ºC overnight for 3 days. The tubes were then introduced sequentially into a helium flow that was dried by magnesium perchlorate, and then analyzed by a Hydra gas isotope ratio mass spectrometer set to detect 1H/2H. The enrichments of equilibrated local water standards were calibrated against SMOW (Standard Mean Ocean Water). Based on delta SMOW, TBW was estimated
including a 4% correction due to the recognized amount corresponding to deuterium dilution in other compartments(50). The TEM and CV for TBW with the stable isotope ratio mass spectrometry in this laboratory were 0.26 L and 1.3 %, respectively.
Total-body Soft Mineral was assessed with the equation, developed by Wang
and colleagues (22):
Five-component model
A multi-compartment model, 5C molecular model, was used to estimate %FM. Rather than a single total mineral component, this 5-component model accounts for both the mineral and soft mineral components (22). However, it is important to note that this model will provide near equivalent results to the more commonly used 4C molecular models (48).
Accordingly, FM was assessed with the following equation:
FM (kg)=2.748×BV - 0.715×TBW + 1.129×Mo + 1.222xMs - 2.051×BM (3) where BV is body volume (L), TBW is total body water (kg), Mo is total-body bone mineral (kg), Ms is total-body soft tissue mineral (kg) and BM is body mass (kg).
Calculation of FFM density
The density (D) of the FFM (DFFM) was estimated from TBW, Mo, Ms, and protein (protein is equal BM minus FM from the 5C model, TBW, Mo, and Ms) contents of the FFM (estimated as BM minus FM from the 5C model) and their respective densities (0.9937 g/cc, 2.982 g/cc, 3.317 g/cc, and 1.34 g/cc, respectively for TBW, Mo, Ms, and Protein) using the following equation:
DFFM= 1 / [(TBW/DTBW) + (Mo/DMo) + (Ms/DMs) + (Protein/Dprotein)] (4)
Propagation of measurement error
In the present study we selected ADP to assess BV, DXA to estimate Mo, and deuterium dilution to estimate TBW. The propagation of measurement errors
associated with the determination of BV, TBW, and Mo can be calculated by assuming that the squared errors (TEM2) are independent and additive (48). Accordingly,
using equation 3,
TEM = [0.732 + 0.262 + 0.042] 0.5 = 0.79 %FM from TEM values The test-retest reliability data collected in the present study thus yields a value of ~1
%FM units.
Statistical analysis
Paired t-tests were used to compare %FM from ADP and DXA with the 5C model, for boys and girls. An independent t-test was used to compare FFM
composition and density between boys and girls. Whenever a normal distribution in body composition variables was found among the sports (by gender), one-way
ANOVA was used to perform comparison of means. Otherwise, a non-parametric test, Kruskal-Wallis, was employed. For each gender, if no more than 2 sports presented a sufficient number of athletes, the comparison of means was performed using a paired-t paired-tespaired-t (when a normal dispaired-tribupaired-tion was found) or paired-the Wilcoxon paired-tespaired-t (when paired-the
the mean value of the duplicate measurements. Also, the pure error (PE) was assessed, as another measure of validation, using the following equation ( (Ÿ-Y)2/n)1/2, where Ÿ is the predicted %FM, Y is the observed %FM and n is the number of subjects (51). Agreement between methods was assessed (52) including the 95% limits of
agreement. Technical error was assessed with the following equation ( d2/2n)1/2, where d stands for the difference between repeated measurements and n is the number of paired repeated measurements. Statistical significance was set at p<0.05.
RESULTS
Sample descriptive characteristics, %FM from ADP, DXA, the reference method (%FM5C), FFM composition and density, and gender differences for all variables are reported in Table 6.1. Although similar ages were found among boys
and girls, height and weight were significantly higher in boys (p<0.001), and girls were significantly fatter than boys were (p<0.001). For boys, %FM obtained from the several methods did not differ among the four representative male sports (Judo, Basketball, swimming, and Rugby) (p>0.05) while gymnastics females were significantly fatter than basketball female players (p<0.001) (data not shown). For girls, FFM density and composition was not significantly different (p>0.05) between basketball players and gymnastic players (data not shown). However, male swimmers presented a significant lower FFM density than male basketball players (p=0.016) but no differences were found with judo and rugby male players (p>0.05). For the male sample, a significant lower mineral fraction of the FFM was found in swimmers compared to basketball players (p=0.002) (data not shown).
%FM5C. However, for girls, %FM from ADP was significantly lower (p<0.001) than %FM5C.
Lohman’s age-adjusted constants were used to convert body density to %FM (%FMLohman). After applying these equations, body fatness was underestimated in both genders, especially in girls (boys: -1.70 %, p<0.001; Girls: -4.04 %, p<0.001). FFM density from the reference method was higher than Lohman’s age-adjusted models and differed (p<0.001) by 0.004 and 0.012 g/cc, in boys and girls, respectively (data not shown).
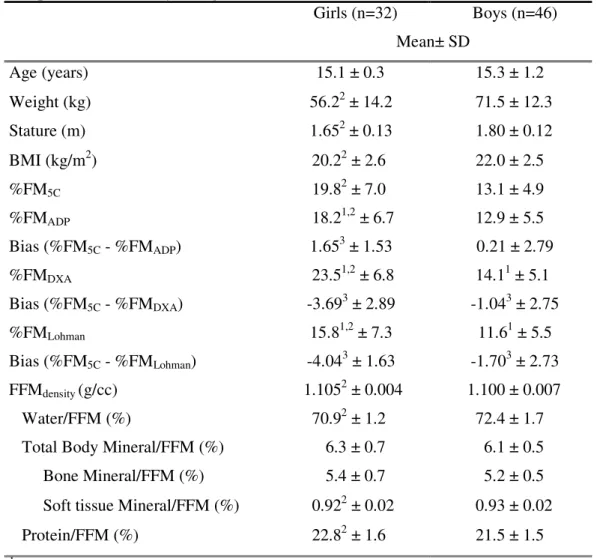
Table 6.1. Physical characteristics, %FM using ADP, DXA, %FM5C, FFM composition and density, and gender differences (Mean ± SD)
Girls (n=32) Boys (n=46) Mean± SD
Age (years) 15.1 ± 0.3 15.3 ± 1.2
Weight (kg) 56.22 ± 14.2 71.5 ± 12.3
Stature (m) 1.652 ± 0.13 1.80 ± 0.12 BMI (kg/m2) 20.22 ± 2.6 22.0 ± 2.5 %FM5C 19.82 ± 7.0 13.1 ± 4.9 %FMADP 18.21,2 ± 6.7 12.9 ± 5.5 Bias (%FM5C - %FMADP) 1.653 ± 1.53 0.21 ± 2.79 %FMDXA 23.51,2 ± 6.8 14.11 ± 5.1 Bias (%FM5C - %FMDXA) -3.693 ± 2.89 -1.043 ± 2.75
%FMLohman 15.81,2 ± 7.3 11.61 ± 5.5
Bias (%FM5C - %FMLohman) -4.043 ± 1.63 -1.703 ± 2.73 FFMdensity (g/cc) 1.1052 ± 0.004 1.100 ± 0.007 Water/FFM (%) 70.92 ± 1.2 72.4 ± 1.7 Total Body Mineral/FFM (%) 6.3 ± 0.7 6.1 ± 0.5 Bone Mineral/FFM (%) 5.4 ± 0.7 5.2 ± 0.5 Soft tissue Mineral/FFM (%) 0.922 ± 0.02 0.93 ± 0.02 Protein/FFM (%) 22.82 ± 1.6 21.5 ± 1.5 1 Significantly different from %FM
5C, p<0.05
2 Significantly different between boys and girls, p<0.05 3 Significantly different from 0, p<0.05
For each method, maturation was tested and did not present a significant contribution to the explained %FM variability from the reference method using ADP %FM (boys: p=0.657; girls: p=0.517) and DXA %FM (boys: p=0.139; girls: p=0.807), as the independent variables. In addition, no significant interactions between
ADP and DXA vs. the 5C model
Group means results
The performance of ADP and DXA as predictor variables of %FM5C is illustrated in Figure 6.1. For boys and girls, ADP explained 74 and 96% respectively,
of the variance of the standard multicompartment model with relatively small SEEs, 2.50 and 1.55 %, respectively.
Using %FM from DXA to predict %FM5C, we found that DXA explained 72 and 83% of the variance, respectively for boys and girls, presenting SEEs higher than those obtained by ADP (Boys: 2.60 %; Girls: 2.91 %).
The pure error for %FM estimates using ADP was smaller than using DXA, ranging from 2.23 to 2.77 % for ADP, and from 2.91 to 4.66 % for DXA. As described above, no differences were found between ADP and the reference method for boys (bias=0.2 %FM, p=0.946). However, %FM was significantly underestimated in girls using ADP (bias=1.7 %FM, p<0.001). DXA overestimated %FM in relation to the reference method (Boys: bias=-1.0 %FM, p=0.015; Girls: bias=-3.7 %FM, p<0.001), particularly in girls.
Slopes and intercepts from the regression between ADP and DXA with %FM5C, did not differ from the line of identity (p>0.05) for the female sample, while for
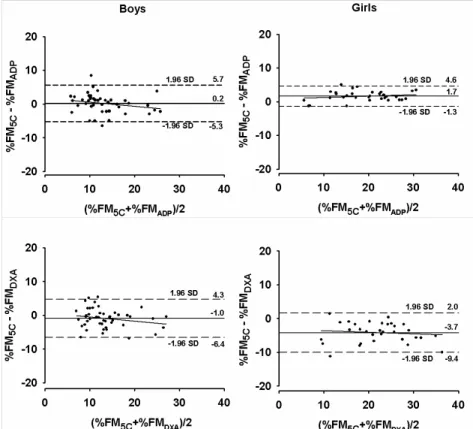
Figure 6.1 – Regression of %FM estimation using the reference method
(%FM5C) by ADP in the left panel and by DXA in the right panel for boys and girls.
Table 6.2. Performance criteria: slope, intercept, coefficient of correlation (r), standard
error of estimation (SEE), pure error (PE), coefficient of variation (CV) and the agreement (bias, limits and trend) between %FM from the reference method and the two techniques: ADP and DXA
Agreement
Slope Intercept r SEE PE CV Bias Limits Trend %FMADP
Girls (n=32) 1.02 1.31 0.98 1.55 2.23 8.5 1.71 4.6, -1.3 0.19 Boys (n=46) 0.762 3.251 0.86 2.50 2.77 19.4 0.2 5.7, -5.3 -0.23 %FMDXA
Girls (n=32) 0.94 -2.27 0.91 2.91 4.66 12.3 -3.71 2.0, -9.4 -0.11 Boys (n=46) 0.812 1.661 0.85 2.60 2.91 18.4 -1.01 4.3, -6.4 -0.22 1 Significantly different from 0, p<0.05
2 Significantly different from 1, p<0.05
Individual results
The agreement between the 5C model with ADP and DXA is illustrated in
Figure 6.2. For boys, no trend line was presented for ADP (r= -0.231; p=0.122) and
found between the differences of the reference method and ADP with the mean of both methods (r=0.194; p=0.288) and smaller limits were obtained (-1.3 to 4.6 %) compared to the male group. For DXA, considerable larger limits of agreement compared to ADP were found, ranging from -6.4 to 4.3% for boys and from -9.4 to 2.0 % for girls. No association was shown between the differences of %FM5C and DXA with the mean of both methods, for boys (r=0.215; p=0.151) and girls (r=0.112; p=0.541).
DISCUSSION
To our knowledge, this is the first study to address the validity of percent body fat estimations using DXA and ADP with a multicompartment molecular model, in male and female adolescent athletes.
Validity of DXA
DXA has been evaluated against an independent criterion method for measuring body fatness in children and adolescents, such as the multicompartment models, but not in adolescent athletes (16, 34-38). In the current study, results from the regression analysis of DXA with the 5C molecular model point out the precision of this technique. The r, SEE, and PE ranged from 0.85 to 0.91, 2.60 to 2.91 %FM, and 2.91 to 4.66 %FM, respectively. These results were similar to the findings reported by other authors in prepubescent and pubescent individuals (16), female adolescents (38), obese children and adolescents (34), and in a large paediatric population (36). All these studies were conducted with a 4C molecular model as reference (53). We found that %FM estimation using DXA was systematically higher in boys and girls, in agreement with previous studies (16, 34, 35, 38). Likewise, in our study, these findings were particularly marked in females. The relatively higher body fatness in females may explain the consistency of these results by possibly
emphasizing errors of the software assumptions for DXA. Conversely, a study
methodological limitations are related with the stability of the lean soft tissue R value which depends, in part, on the constancy of constituent water, protein, and soft tissue mineral proportions (54).
The agreement between DXA and the 5C molecular model showed large limits and a considerable mean bias without a significant trend across different levels of fatness, which also matches with findings reported by other authors (35, 38). The large limits of agreement in our study (Boys: -1.0 ± 5.4 % and Girls: -3.7 ± 5.7 %) could cause an individual %FM value to be underestimated by 4.3 % for boys and 2.0 % for girls, or overestimated by 6.4 % for boys and 9.4 % for girls, though no relation between the differences of the methods and adiposity was present. Using a 4C model, similar findings (bias ± 2SD) were obtained in females (-3.9 ± 6.7 %) (38),
prepubescent and pubescent ranging from -1.13 ± 8.41 % to -3.43 ± 9.09 % (35) in a large pediatric sample -1.0 ± 8.9 % (36), showing that DXA could cause an individual %FM value to be overestimated by ~13 %. To a lesser extent, Gately and colleagues, reported bias (± 2SD) for obese children ranging from - 1.7 ± 3.1 to -2.2 ± 4.4%, respectively for boys and girls (34).
To further understand the relatively higher variability on DXA %FM estimates in relation to the reference method, consideration was given to the association
Sources of potential error have been corrected by the introduction of improved software (26-29). A recent investigation (55) revealed an overestimation of FFM after updating the software. Therefore, concerns are still warranted, as DXA estimates of fat/lean tissue are assumed to be in the same proportion in pixels containing bone as they are in the adjacent non-bone-containing. To overcome the systematic bias in DXA %fat measurement we recommend the development of descriptive calibration models for DXA group mean %FM estimates in adolescent athletes, even though individual %FM estimates cannot be performed. The applicability of this
recommendation to DXA instruments made by other manufacturers or to DXA instruments that use different scans modes and software is not known, though a few studies have shown a lack of interchangeability in DXA systems to assess soft tissue (56-59).
Validity of ADP
Compared with the 5C molecular model, ADP results for mean %FM
estimates using Siri’s equation (2) to convert body density to % FM showed a slightly underestimation in the female group but no difference in boys. However, Lohman’s age-adjusted constants used to convert body density derived from ADP into %FM remarkably underestimated %FM in both genders. Therefore, results obtained from ADP %FM estimates using Siri equation will be discussed throughout this section rather than the use of Lohman age-adjusted models.
For group means, ADP was a precise and valid technique in the determination of body composition in adolescent athletes as indicated by the regression parameters, particularly in the female sample (Table 6.2). The r, SEE, and PE ranged from 0.86 to
obese children and adolescents (34), which used a 4C molecular model as reference (53). However, these authors calculated %FM from ADP by converting body density with Lohman’s age-adjusted constants (47). Considering the regression parameters, ADP was even more precise in our male sample compared with the findings of Fields and Goran (16). Nevertheless, it is important to note that these authors (16) examined precision and accuracy of %FM estimation using ADP in children of both sexes as a whole, and not separately as in the present work.
No bias was found between this technique and the reference method for boys, but larger limits were found, compared to girls, indicating that this method displays higher variability in individual %FM estimation in adolescent males. However, a small but significant underestimation was found for girls. Body fatness was not related with the differences between ADP and the reference method, which emphasizes the use of ADP in a sample of adolescents athletes that present a
recognizable wide range of body fatness (~5 to ~30 %FM). No association with body fatness was also reported by other investigations (16) but a significant mean
underestimation was found in prepubescent and pubescent (16) while for overweight and obese children no mean bias was found (34).
Effect of FFM composition and density
water fractions of the FFM increase and decrease, respectively, during growth and maturation. This effect promotes an increase on FFM density during this period, as total body mineral density is higher than water density (3.038 vs. 0.9937 g/cm3). Based on a few studies (60-62), Lohman proposed the use of age- and gender-specific equations (47), which account for maturation-related changes in the density of the FFM for children and youth. Our subjects showed a smaller water fraction and a higher protein fraction than previous studies (60-62). As a result, FFM density was clearly underestimated (p<0.001) by Lohman’s models (47), due to the lower water and the higher residual/protein fractions, which has an assumed greater density than water (1.34 vs. 0.994 g/cc). For females, FFM density was even higher than the adult value while for males matched it. Therefore, Lohman’s age-adjusted constants for %FM estimation in this specific sample were ineffective. However, it is important to note that 17% and 73% of our subjects were pubescent and postpubescent,
for male swimmers to 1.105 ± 0.004 g/cc for male basketball players and from 1.104 ± 0.005 g/cc for gymnastic females to 1.105 ±.0.003 g/cc for basketball players, which certainly indicates deviations in the composition of the FFM. Thus, our results may indicate that different types of athletic training may have different effects on the density and composition of the FFM.
The 4C and 5C molecular models have obvious advantages over 2C models because the reliance on a constant for the proportions and densities of the fat free mass is eliminated. The 5C molecular model used in this study ameliorates the effects of maturation, hydration, mineralization and protein status of the fat-free mass, in the estimation of body fatness, as the hydration status decreases and bone mineralization increases with age (53). In the present study we have assumed that 5C analysis provides the most accurate estimates of %FM. Heymsfield and colleagues (48) provide further details on the assumptions for multicompartment models
development. Moreover, the use of ADP to estimate body density may be a limiting factor for the use of the 5C model in the present study. It is important to note that there is no true gold standard of body composition analysis. Therefore, body composition studies conducted are a comparison of methods, which are obviously based on some assumptions.
CONCLUSION
and both techniques. However, the techniques were less precise at an individual analysis though ADP revealed a better precision for individual %FM estimation in adolescent females. In addition, we conclude that body density converted to %FM by using Lohman’s age adjusted constants were not useful in this specific population by markedly underestimating body fatness. Moreover, athletes in selected sports may have systematic deviations in DFFM from the value of 1.1 kg/cc assumed in the Siri equation, resulting in-group mean errors for %FM estimation. The cause of these variations is complex and further research is required, especially during growth and maturation.
REFERENCES
1. WANG, Z. M., DEURENBERG, P., GUO, S. S. et al. (1998) Six-compartment body composition model: inter-method comparisons of total body fat measurement, Int J Obes Relat Metab Disord, 22, 329-37.
2. SIRI, W. E. (1961) Body composition from fluid spaces and density: Analysis of method, in: Henschel, I. J. B. A. (Ed.) Techniques for measuring body composition, pp. 223-244 (Washington, D.C., National Academy of Sciences).
3. DEMPSTER, P. & AITKENS, S. (1995) A new air displacement method for the determination of human body composition, Med Sci Sports Exerc, 27,
1692-1697.
4. MCCRORY, M. A., GOMEZ, T. D., BERNAUER, E. M. & MOLÉ, P. A. (1995) Evaluation of a new air displacement plethysmograph for measuring human body composition, Med Sci Sports Exerc, 27, 1686-1691.
5. FIELDS, D. A., GORAN, M. I. & MCCRORY, M. A. (2002) Body-composition assessment via air-displacement plethysmography in adults and children: a review, Am J Clin Nutr, 75, 453-67.
6. BOSY-WESTPHAL, A., MAST, M., EICHHORN, C. et al. (2003) Validation of air-displacement plethysmography for estimation of body fat mass in healthy elderly subjects, Eur J Nutr, 42, 207-16.
7. COLLINS, M. A., MILLARD-STAFFORD, M. L., SPARLING, P. B. et al. (1999) Evaluation of the BOD POD for assessing body fat in collegiate football players, Med Sci Sports Exerc, 31, 1350-6.
9. KODA, M., TSUZUKU, S., ANDO, F., NIINO, N. & SHIMOKATA, H. (2000) Body composition by air displacement plethysmography in middle-aged and elderly Japanese. Comparison with dual-energy X-ray absorptiometry, Ann N Y Acad Sci, 904, 484-8.
10. LEVENHAGEN, D. K., BOREL, M. J., WELCH, D. C. et al. (1999) A comparison of air displacement plethysmography with three other techniques to determine body fat in healthy adults, JPEN J Parenter Enteral Nutr, 23, 293-9.
11. MILLARD-STAFFORD, M. L., COLLINS, M. A., EVANS, E. M. et al. (2001) Use of air displacement plethysmography for estimating body fat in a four-component model, Med Sci Sports Exerc, 33, 1311-7.
12. MIYATAKE, N., NONAKA, K. & FUJII, M. (1999) A new air displacement plethysmograph for the determination of Japanese body composition, Diabetes Obes Metab, 1, 347-51.
13. NUNEZ, C., KOVERA, A. J., PIETROBELLI, A. et al. (1999) Body composition in children and adults by air displacement plethysmography, Eur J Clin Nutr, 53,
382-7.
14. SARDINHA, L. B., LOHMAN, T. G., TEIXEIRA, P. J., GUEDES, D. P. & GOING, S. B. (1998) Comparisons of air displacement plethysmography with dual-energy x-ray absorptiometry and 3 field methods for estimating body composition in middle-aged men, Am J Clin Nutr, 68, 786-793.
15. WAGNER, D. R., HEYWARD, V. H. & GIBSON, A. L. (2000) Validation of air displacement plethysmography for assessing body composition, Med Sci Sports Exerc, 32, 1339-44.
17. GOING, S. B. (1996) Densitometry, in: Roche, A. F., Heymsfield, S.B., and Lohman, T.G. (Ed.) Human body composition, pp. 3-23 (Champaign, IL,
Human Kinetics).
18. PIETROBELLI, A., FORMICA, C., WANG, Z. & HEYMSFIELD, S. B. (1996) Dual-energy X-ray absorptiometry body composition model: review of physical concepts, Am J Physiol, 271, E941-51.
19. PIETROBELLI, A., Gallagher, D., Baumgartner, R., ROSS, R & HEYMSFIELD, S. B. (1998a) Lean R value for DXA two-component soft-tissue model: influence of age and tissue or organ type, Appl Radiat Isot, 49, 743-744.
20. WITHERS, R. T., LAFORGIA, J., HEYMSFIELD, S. B., WANG, Z. & PILLANS, R. K. (1996) Two, three and four-compartment chemical models of body
composition analysis, in: In K, N. T., Olds (Ed.) Antropometrica, pp. 199-231
(Australia: UNSW Press).
21. FULLER, N. J., JEBB, S. A., LASKEY, M. A., COWARD, W. A. & ELIA, M. (1992) Four-component model for the assessment of body composition in humans: comparison with alternative methods, and evaluation of the density and hydration of fat-free mass, Clin Sci (Colch), 82, 687-93.
22. WANG, Z., PI-SUNYER, F. X., KOTLER, D. P. et al. (2002) Multicomponent methods: evaluation of new and traditional soft tissue mineral models by in vivo neutron activation analysis, Am J Clin Nutr, 76, 968-74.
23. ELLIS, K. J. (1997) Body composition of a young, multiethnic, male population, Am J Clin Nutr, 66, 1323-31.
25. ELLIS, K. J., SHYPAILO, R. J. & WONG, W. W. (1999) Measurement of body water by multifrequency bioelectrical impedance spectroscopy in a multiethnic pediatric population, Am J Clin Nutr, 70, 847-53.
26. CLARK, R. R., KUTA, J. M. & SULLIVAN, J. C. (1993) Prediction of percent body fat in adult males using dual energy x-ray absorptiometry, skinfolds, and hydrostatic weighing, Med Sci Sports Exerc, 25, 528-35.
27. GORAN, M. I., DRISCOLL, P., JOHNSON, R., NAGY, T. R. & HUNTER, G. (1996) Cross-calibration of body-composition techniques against dual-energy X-ray absorptiometry in young children, Am J Clin Nutr, 63, 299-305.
28. KOHRT, W. M. (1998) Preliminary evidence that DEXA provides an accurate assessment of body composition, J Appl Physiol, 84, 372-7.
29. NORD, R. H. & PAYNE, R. H. (1995) Body composition by dual-energy X-ray absorptiometry-a review of the technology, Asia Pac J Clin Nutr, 4, 167-71.
30. ROUBENOFF, R., KEHAYIAS, J. J., DAWSON-HUGHES, B. & HEYMSFIELD, S. B. (2000) Use of dual-energy x-ray absorptiometry in body-composition studies: not yet a "gold standard", Am J Clin Nutr, 58, 589-91.
31. JEBB, S. A., GOLDBERG, G. R., JENNINGS, G. & ELIA, M. (1995) Dual-energy x-ray absorptiometry measurements of body composition: Effects of depth and tissue thickness, including comparisons with direct analysis, Clin Sci, 88,
319-324.
32. VAN LOAN, M. D. (1998) Is dual-energy X-ray absorptiometry ready for prime time in the clinical evaluation of body composition? Am J Clin Nutr, 68,
1155-6.
33. TESTOLIN, C. G., GORE, R., RIVKIN, T. et al. (2000) Dual-energy X-ray
34. GATELY, P. J., RADLEY, D., COOKE, C. B. et al. (2003) Comparison of body composition methods in overweight and obese children, J Appl Physiol, 95,
2039-46.
35. ROEMMICH, J. N., CLARK, P. A., WELTMAN, A. & ROGOL, A. D. (1997) Alterations in growth and body composition during puberty. Comparing multicompartment body composition models, J Appl Physiol, 83, 927-935.
36. SOPHER, A. B., THORNTON, J. C., WANG, J. et al. (2004) Measurement of percentage of body fat in 411 children and adolescents: a comparison of dual-energy X-ray absorptiometry with a four-compartment model, Pediatrics, 113,
1285-90.
37. WELLS, J. C., FULLER, N. J., DEWIT, O. et al. (1999) Four-component model of body composition in children: density and hydration of fat-free mass and comparison with simpler models, Am J Clin Nutr, 69, 904-12.
38. WONG, W. W., HERGENROEDER, A. C., STUFF, J. E. et al. (2002) Evaluating body fat in girls and female adolescents: advantages and disadvantages of dual-energy X-ray absorptiometry, Am J Clin Nutr, 76, 384-9.
39. MODLESKY, C. M., CURETON, K. J., LEWIS, R. D. et al. (1996) Density of the fat-free mass and estimates of body composition in male weight trainers, J Appl Physiol, 80, 2085-96.
40. PRIOR, B. M., MODLESKY, C. M., EVANS, E. M. et al. (2001) Muscularity and the density of the fat-free mass in athletes, J Appl Physiol, 90, 1523-31.
42. ARNGRIMSSON, S., EVANS, E. M., SAUNDERS, M. J. et al. (2000) Validation of body composition estimates in male and female distance runners using estimates from a four-component model, Am J Human Biol, 12, 301-314.
43. PENN, I. W., WANG, Z. M., BUHL, K. M. et al. (1994) Body composition and two-compartment model assumptions in male long distance runners, Med Sci Sports Exerc, 26, 392-7.
44. WITHERS, R. T., LAFORGIA, J., PILLANS, R. K. et al. (1998) Comparisons of two-, three-, and four-compartment models of body composition analysis in men and women, J Appl Physiol, 85, 238-45.
45. TANNER, J. M. (1962) Growth and adolescence (Oxford, UK, Blackwell
Scientific).
46. ROSS, W. D. & MARFELL-JONES, M. J. (1991) Kinanthropometry, in:
MacDougall, J. D., Wenger, H. A. & H.J., G. (Eds.) Phsysiological testing of the high-performance athlete, pp. 224-305 (Champaign, IL, Human Kinetics
Publishers).
47. LOHMAN, T. (1989) Assessment of body composition in children, Pediatr. Exerc. Sci., 1, 19-30.
48. HEYMSFIELD, S. B., WANG, Z. & WHITHERS, R. T. (1996) Multicomponent molecular level models of body composition analysis, in: Roche, A. F., Heymsfield, S.B., and Lohman, T.G. (Ed.) Human Body Composition, pp.
129-147 (Champaign, IL, Human Kinetics).
49. PROSSER, S. J. & SCRIMGEOUR, C. M. (1995) High-Precision Determination of 2H/1H in H
2 and H2O by Continuous-Flow Isotope Ratio Mass Spectrometry,
50. SCHOELLER, D. A., VAN SANTEN, E., PETERSON, W. M. et al. (1980) Total body water measurement in humans with 18O and 2H labeled water, Am J Clin Nutr, 33, 2686-2693.
51. GUO, S. S. & CHUMLEA, W. C. (1996) Statistical methods for the development and testing of predictive equations, in: Roche, A. F., Heymsfield, S. B. & Lohman, T. G. (Eds.) Human body composition, pp. 191-202 (Champaign, IL,
Human Kinetics Publishers).
52. BLAND, J. M. & ALTMAN, D. G. (1986) Statistical methods for assessing agreement between two methods of clinical measurement, Lancet, 1, 307-10.
53. LOHMAN, T. G. (1986) Applicability of body composition techniques and constants for children and youths, Exerc Sport Sci Rev, 14, 325-57.
54. PIETROBELLI, A., WANG, Z., FORMICA, C. & HEYMSFIELD, S. B. (1998b) Dual-energy X-ray absorptiometry: fat estimation errors due to variation in soft tissue hydration, Am J Physiol, 274, E808-16.
55. TYLAVSKY, F., LOHMAN, T., BLUNT, B. A. et al. (2003) QDR 4500A DXA overestimates fat-free mass compared with criterion methods, J Appl Physiol,
94, 959-65.
56. ECONOMOS, C. D., NELSON, M. E., FIATARONE, M. A. et al. (1997) A multi-center comparison of dual energy X-ray absorptiometers: in vivo and in vitro soft tissue measurement, Eur J Clin Nutr, 51, 312-7.
57. PATON, N. I., MACALLAN, D. C., JEBB, S. A., PAZIANAS, M. & GRIFFIN, G. E. (1995) Dual-energy X-ray absorptiometry results differ between machines,
Lancet, 346, 899-900.
scanners used for measuring total body bone and soft tissue, Ann N Y Acad Sci, 904, 63-71.
59. TOTHILL, P., LASKEY, M. A., ORPHANIDOU, C. I. & VAN WIJK, M. (1999) Anomalies in dual energy X-ray absorptiometry measurements of total-body bone mineral during weight change using Lunar, Hologic and Norland instruments, Br J Radiol, 72, 661-9.
60. FOMOM, S. J., HASCHKE, F., ZIEGLER, E. E. & NELSON, S. E. (1982) Body composition of reference children from birth to age 10 years, Am J Clin Nutr,
35, 1169-75.
61. HASCHKE, F. (1983) Body composition of adolescent males. Part I. Total body water in normal adolescent males. Part II. Body composition of the male reference adolescent, Acta Paediatr Scand Suppl, 307, 1-23.