M
ASTER
A
CTUARIAL
S
CIENCE
M
ASTER
’
S
F
INAL
W
ORK
I
NTERNSHIP
R
EPORT
A
NALYSING
D
ATA FROM
P
ENSION
S
CHEMES
:
D
ATA
Q
UALITY AND
R
ELEVANCE FOR
A
CTUARIAL
V
ALUATIONS
M
ARIA DA
G
RAÇA DE
T
AVARES E
T
ÁVORA
P
EREIRA
C
OUTINHO
M
ASTER
A
CTUARIAL
S
CIENCE
M
ASTER
’
S
F
INAL
W
ORK
I
NTERNSHIP
R
EPORT
A
NALYSING
D
ATA FROM
P
ENSION
S
CHEMES
:
D
ATA
Q
UALITY AND
R
ELEVANCE FOR
A
CTUARIAL
V
ALUATIONS
M
ARIA DA
G
RAÇA DE
T
AVARES E
T
ÁVORA
P
EREIRA
C
OUTINHO
S
UPERVISORSE
LIZABETHM
ETCALFEO
NOFREA
LVESS
IMÕESII
Abstract
Data is the object of an actuarial analysis. Reviewing the data is the first step of a valuation, along with setting up assumptions and having the knowledge about the actuarial theory – these components together will enable the actuary to perform the necessary calculations and interpret its results.
Having this in mind, data quality is something worthy to give a thought about and that’s what this work will be for.
After an internship at Willis Towers Watson Lisbon office, I realised data was a subject of high importance and the one I dealt with on a daily basis.
Here, I will give some background knowledge about pension schemes, mainly United Kingdom pension schemes as they were my main focus. A case study about data issues and their impact on a valuation will be presented to give the reader real numbers and the real impact some minor data issues can have.
For this study, a training client was used and the problems described were based on my work-experience – all inaccuracies present in Chapter 5 were found (and corrected) in real clients during my internship.
Key words: Pension fund, Actuarial Assumptions, Defined Benefit Plan, Data and Data Quality, Surplus,
III
Resumo
Os dados são o objeto de uma análise atuarial. O primeiro passo de uma avaliação é a revisão dos dados, juntamente com a definição dos pressupostos necessários e tendo conhecimento da teoria atuarial – estas componentes juntas permitirão ao atuário realizar os cálculos necessários e interpretar os resultados obtidos.
Tendo isto em consideração, a qualidade dos dados sobressaiu como um elemento fundamental, tendo sido o tema escolhido para este trabalho.
Depois de um estágio no escritório de Lisboa da Willis Towers Watson, percebi que os dados são um campo bastante importante, tendo sido algo com que lidei diariamente. Neste trabalho, darei um conhecimento inicial sobre fundos de pensões, especialmente fundos de pensões do Reino Unido, uma vez que foram o meu foco durante o estágio. Apresentarei ainda um caso de estudo sobre dificuldades nos dados e o seu impacto numa avaliação, de forma a fornecer uma ilustração com números reais e o impacto que pequenos problemas podem causar.
Para este estudo, um cliente de treino foi usado e os problemas apresentados foram baseados na minha experiência no trabalho diário – todas as incoerências apresentadas no Capítulo 5 foram encontradas (e corrigidas) em clientes reais nos quais trabalhei durante o estágio.
Palavras-chave: Fundo de Pensões, Pressupostos Atuariais, Plano de Benefício Definido, Dados e
IV
Acknowledgements
The first big thank you goes to my parents. They incentivised me to finish this work and gave me all the chances to do so.
To my sister and my brother, thank you for all your support and hints along this paper. All my closest friends, who were always there supporting me and pushing me to finish this.
To Liz Metcalfe, my supervisor from Willis Towers Watson, for all the good tips and advices. Thanks for all the meetings where you always had something to teach me and all the patience and time to read and re-read these lines over and over for more than a year.
To Professor Onofre Simões, my supervisor from ISEG, for pushing me to finish this work and for always trying to make me give the better of myself.
I can’t leave aside Joana Pereira and Pedro Cruz for giving me the opportunity to do the internship at Willis Towers Watson and start my professional career with the best environment someone can ask for.
Last but definitely not least, a big thank you to Patricia Oliveira and Paulo Simões. Patricia was my mate in this journey and I like to think we pushed each other out when we didn’t have the motivation to do this work. Paulo is the one that, after me, read this more times than anyone else – a big thank you for always being available to help, to give your inputs and thoughts about everything and for helping me being better.
V
Contents
1. Introduction _______________________________________________________ 1 2. UK Pension Schemes_________________________________________________ 3 2.1. Defined Benefits vs Defined Contributions ____________________________ 3 2.2. Funding in Pension Schemes _______________________________________ 4 2.3. Members ______________________________________________________6 2.4. Intervaluation pension increases ___________________________________ 7 2.5. UK Guaranteed Minimum Pension __________________________________ 7 3. UK Valuations _____________________________________________________ 10 3.1. Data _________________________________________________________ 10 3.2. Liabilities _____________________________________________________ 11 4. Data quality and relevance ___________________________________________ 13 4.1. Data quality ___________________________________________________ 13 4.2. The importance of data __________________________________________ 15
4.2.1 Data extracts ____________________________________________ 15 4.2.2 Assumptions ____________________________________________ 17 4.2.3 Calculations _____________________________________________ 18 4.2.4 Data importance and consequences _________________________ 20
5. Numbers speak ____________________________________________________ 22 5.1 Initial considerations ____________________________________________ 22 5.2 Results________________________________________________________ 24
5.2.1 Missing category codes ____________________________________ 24 5.2.2 Missing date of birth ______________________________________ 27 5.2.3 GMP amounts switched ____________________________________ 28 5.2.4 Decimal places ___________________________________________ 29 5.2.5 Spouse fraction __________________________________________ 30 5.3 Overall considerations ___________________________________________ 32 6. Conclusion________________________________________________________ 35 References __________________________________________________________ 37
VI
List of figures
Figure 1. The AoS process 5
Figure 2. Cash flows in and cash flows out in pension schemes 6 Figure 3. Illustration of the pension tranches of a member 9 Figure 4. Historical rates and assumptions 17 Figure 5. Timing adjustments timeline 1 19 Figure 6. Timing adjustments timeline 2 19 Figure 7. Category codes and membership associated to each category 25 Figure 8. Executive members’ long term increases in payment 25 Figure 9. Staff members’ long term increases in payment 25 Figure 10. Expected liability of 28 Retirees valued as Executive members 26 Figure 11. Expected liability of 28 Retirees valued as Staff members 26 Figure 12. Expected liability of one member calculated with incorrect DOB 27 Figure 13. Expected liability of one member calculated with correct DOB 28 Figure 14. Expected liab of one member calculated with correct spouse fraction 31 Figure 15. Expected liab of one member calculated with incorrect spouse fraction 32 Figure 16. Correct vs. incorrect liability in each case studied 33 Figure 17. Surplus/deficit for each case studied 33 Figure 18. Funding level for each case studied 34
List of tables
Table 1. Membership and liability of the client used in the case study 22 Table 2. Economic assumptions used for the valuation 23 Table 3. Pension amounts by tranche of the retirees used in the case study 24 Table 4. Member’s date of birth correct and incorrect and respective ages 27 Table 5. Impact of valuing the incorrect DOB for one member 28 Table 6. Pension amounts by tranche and respective Liability 29 Table 7. Impact of valuing incorrect pension for one member 29 Table 8. Commuted pensions and respective spouse fraction 31 Table 9. Total liability for each case studied and difference 32
VII
Acronyms
AoS Analysis of Surplus BSP Basic State Pension
CARE Career Average Revalued Earnings CATCODE Category code
CO Client Office
CPI Consumer Price Index DB Defined Benefit plan DC Defined Contribution plan DOB Date of Birth
DOL Date of Leaving
DPSC Date Pensionable Service Commenced EPV Expected Present Value
GMP Guaranteed Minimum Pension GPA GMP Payment Age
GPD GMP Payment Date LSC Lisbon Service Centre LVDATE Last Valuation date LVD Last valuation date
NI National Insurance number NICs National Insurance Contributions RPI Retail Price Index
S2P State Second Pension
SERPS State Earnings Related Pension Scheme SPA State Pension Age
TVD This valuation date UK United Kingdom VDATE Valuation Date WTW Willis Towers Watson
1
1. Introduction
This work is a result of my curricular internship at Willis Towers Watson (WTW). The internship was five months long and the purpose was to work mainly on actuarial valuations of United Kingdom (UK) pension plans.
The internship took place in the Lisbon Service Centre (LSC), one of the WTW offices in Lisbon, and my main focus was set to analyse and correct the data provided by the Trustees and Administrators for live valuations. The valuations I worked on were related to Defined Benefit pension plans and so I had to understand the plan rules of the clients allocated to me in order to know the benefits to value, how to value them and the calculations needed for the valuation to achieve the final results to be presented to the client by the Client Office (CO) team. To make sure the results are correct, some checks along the different stages of the process are needed.
Checks on valuation data are performed to reconcile the current data with known past experiences and the administrators’ guidance. If necessary, after these checks, corrections are made to the data. Actual versus expected analysis is also helpful along the whole process and reasonableness checks on the liability results are required. During my internship, and to perform all the essential pieces of work, I used WTW and LSC specific tools, templates and softwares. In the LSC, the valuation process is composed of three main workstages: data checks, Last Valuation Basis and New Bases, which will be explained later in more detail. In short:
Data checks – Ensure that the data received is of sufficient quality for use in the valuation and that we have everything we need to perform the valuation; Last valuation basis – The purpose of this workstage is to pick up the final liability
calculations from the previous valuation (the one that was presented to the client), and calculate the liability with this time’s data and the last valuation’s assumptions;
New bases workstage – Derive liabilities based on the current data and current assumptions. Sensitivity analyses are also performed in order to get the more sensible results with the assumptions for the current market conditions.
2
All pieces of client work produced by the Lisbon office have to be seen by, at least, three people: the Doer, who picks up the work first (which was my role during the Internship); the Checker, who checks the work done by the doer and looks for technical accuracy making sure that no trivial mistakes are made and all details are being considered; and the Reviewer, who reviews all the work and guarantees that the results tie up according with what was expected. In some cases, essentially when the client’s liability is very high or the scheme benefits are especially complex and/or non-standard, there is also the need to have a fourth person looking at the results, and this person will do the peer review of all the work.
In the next two chapters, I will explain what a pension fund is, some particularities of UK pension funds, what is a valuation and why do actuaries perform formal valuations on pension schemes. This way, the reader will get more into the subject and into the reason why companies like Willis Towers Watson are hired to perform these valuations. In the fourth chapter, the focus will shift towards the data, which is normally provided to the Client Office (CO) teams by the client’s administrators, who send them to the LSC. I will also answer the question ‘why is data important’ and try to explain the relevance of data in the valuations. Furthermore, I will speak about the quality of data and why proper data is desirable to perform a good work and obtain reliable results.
In Chapter 5, there are some examples that show the importance of accurate data by looking at different scenarios and results variations performed in an anonymous client. For this client, known data problems were assumed to be occurring in the initial data and then corrected to what was known as the most accurate data. A comparison between results before and after the corrections will be shown and explained in further detail. This is mainly to have a ‘real life example’ that can help us understand why data quality is so fundamental in the valuations.
The conclusion is a summary of all the chapters, including some final thoughts about data and my internship.
3
2. UK Pension Schemes
We never know what the future has in store for us. For this reason, “it makes sense to put some money away for when you’re older and that’s what pension schemes help you do” (Pensions Advisory Service 2019).
A pension is a regular payment made to someone until his/her death. Note that at members’ death a dependant pension (spouse and/or children) might enter in payment, depending on the scheme rules and whether the member is married and/or has children.
A pension scheme is a long term savings plan, meaning people can save money during their working life by transferring it into a fund in order to get an income later once they retire. (Pensions Advisory Service 2019)
One of the actuaries’ main focus are occupational pension schemes, which are established by companies to provide pensions and other benefits to their employees and sometimes to their dependents. The cost of providing these benefits is met by normal contributions paid to the scheme by both the employer and the employee (if they are defined as contributory plans) or just by the employer (if they are defined as non-contributory). In either case, the normal contributions made correspond to a percentage of the salaries paid or received, respectively.
2.1 Defined Benefits vs Defined Contributions
There are two different approaches to retirement provision: defined benefit and defined contribution.
In a defined contribution (DC) plan, contributions are defined for each individual and paid into a fund that is credited with investment returns and used at retirement to buy a pension that is chosen by the member. The pension at retirement is entirely dependent on market returns and there is no guarantee – both the absolute and relative to final salary.
In a defined benefit (DB) plan, the pension is set at the start as a formula of the member’s final salary or career average revalued earnings (CARE) and service years. The
4
employee cost is known but the employer has some flexibility in terms of changing and/or choosing the contribution rates.
Summing up, in DC schemes members know the level of contributions paid into the fund but the amount they will receive will depend on investment returns and annuity rates at the time of retirement, while in DB schemes members have a guaranteed benefit on retirement that is calculated depending on each member’s final salary and the years of service. (WTW Internal documents 2001)
In this work, the focus will be in DB schemes. Thus, it is helpful to know the formula by which the members’ pensions are commonly calculated:
𝑷𝒆𝒏𝒔𝒊𝒐𝒏 = 𝑺𝒂𝒍𝒂𝒓𝒚 ∗ 𝒀𝒆𝒂𝒓𝒔 𝒐𝒇 𝒔𝒆𝒓𝒗𝒊𝒄𝒆 ∗ 𝑨𝒄𝒄𝒓𝒖𝒂𝒍 𝒓𝒂𝒕𝒆 (1)
If the approach set in the scheme rules to calculate the pension is based on the member’s final salary, then in equation (1) where it is written ‘Salary’ we would have instead ‘Final Pensionable Salary’ of the member at the time of calculation, which can either be the last year salary or an average of the last three or five years’ salaries. If it is defined by the CARE approach, then the ‘Salary’ will correspond to the entire member’s working time average salaries, which will already take into account the sum of years of service. Therefore, the ‘Years of service’ in the formula above would be set as equal to one in the CARE approach.
These schemes are managed by Trustees according to the rules set for each scheme and they have the legal obligation to make sure that the funds have enough assets to cover the liabilities.
2.2 Funding in Pension Schemes
The DB pension schemes are funded, meaning that the money from contributions is paid to the fund and then used to pay the necessary benefits. The money in this fund can be invested in stocks, shares and property, namely assets that will produce additional income for the fund and help to provide the required money for benefits, reducing the contributions needed from both the employer and the employee.
An actuarial valuation is an assessment to the assets versus liabilities of each pension fund, in which a set of assumptions is used to determine the funded status of the
5
pension plan (this will be explained later in more detail). The plan is in surplus when it has assets enough to cover all the liabilities and is in deficit otherwise, cf. equation (2). If the plan is in deficit, other than the normal contributions are required to make sure the plan keeps having the necessary funds – those will be deficit contributions.
𝑺𝒖𝒓𝒑𝒍𝒖𝒔 (𝑫𝒆𝒇𝒊𝒄𝒊𝒕) = 𝑨𝒔𝒔𝒆𝒕𝒔 − 𝑳𝒊𝒂𝒃𝒊𝒍𝒊𝒕𝒆𝒔 (2)
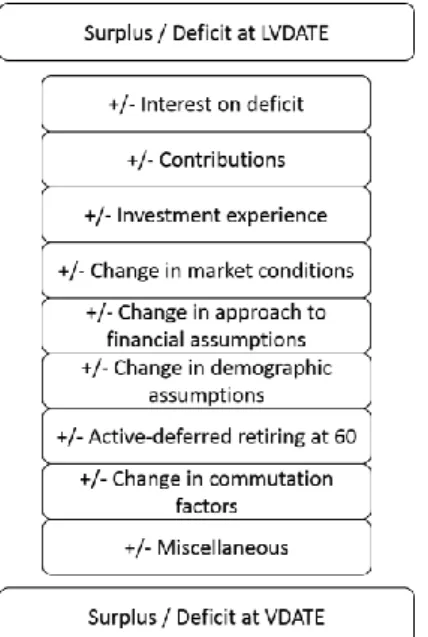
The funding position of each scheme, cf. equation (3), is analysed at every formal valuation to be possible to know how the scheme is evolving. Thus, an analysis of surplus (AoS) is made, i.e., starting with the surplus/deficit from the last valuation and comparing it against the surplus/deficit at this valuation.
𝑭𝒖𝒏𝒅𝒊𝒏𝒈 𝑳𝒆𝒗𝒆𝒍 = 𝑳𝒊𝒂𝒃𝒊𝒍𝒊𝒕𝒊𝒆𝒔𝑨𝒔𝒔𝒆𝒕𝒔 (3)
From this end point of last valuation (let’s say point A) and starting point of current valuation (point B), an analysis of the incomes and outcomes during the intervaluation period is made, in order to ‘show the entire picture’ of the changes that completely explain how we got from point A to point B. A draft AoS is performed at LSC and covers different items from contributions up to mortality experience, as shown by the image below (note that LVDATE stands for last valuation date and VDATE for this valuation date).
Figure 1. The AoS process Source: WTW Training Materials
6
Figure 2. Cash flows in and cash flows out in pension schemes Source: WTW Training Materials
Investment returns and contributions will be paid into the scheme and increase the value of assets, which will be used to pay the necessary benefits of the pension scheme. However, the two big questions here are how fast does the scheme need contributions to get in and what level of assets are needed today to ensure the fund will have sufficient money to pay benefits in the future.
This is one of the main reasons to perform valuations – it is important to know the benefits that will be paid and make sure the scheme has enough resources to keep going.
2.3 Members
The members of a scheme can be divided into Actives (the ones that are still working in the company and accruing benefits in the scheme) and Non-Actives (members that are no longer working for the company but retain entitlement to benefits accrued during their company service).
The Non-Actives are then subdivided into Pensioners and Deferreds. The Deferreds are prior employees that have not yet reached retirement (they changed company but are still working), and are entitled to receive a pension from the scheme at retirement. As such, the pension obligation needs to be valued. The Pensioners are the ones who are already receiving their pensions, i.e., members for whom the pensions are already in payment. These can be divided into Dependants and Retirees – Retirees are the
7
members who have worked for the company and are already retired, and so the pensions are already being paid; Dependants are Spouses or Children from members that worked in the company and have died, and are entitled to receive a percentage of the member’s pension – this percentage will differ according to scheme rules and is set
at priori.
2.4 Intervaluation pension increases
The actuarial valuations occur in a formal way every three years. As mentioned above, the current year of valuation is called as ‘this time’s valuation date – VDATE’ and the previous year of valuation (normally three years before VDATE) is called ‘last time’s valuation date – LVDATE’.
“Once a pension is in payment, the pension fund will wish to increase it regularly so that the pensioner does not have the standard of living eaten away with inflation” (WTW – LSC Retirement 2017).
The purpose would be to increase the pension amount in line with the annual rate of inflation. And this is what happens in reality but with some tweaks – sometimes inflation can be too high and the fund would not be able to afford such increases. When this happens, the scheme rules will set floors (a certain value that will be set as the minimum) and caps (set as the maximum) to the rates in order to make them more bearable, but still in line with the annual inflation. All this is already accounted as part of the actuary work at the moment of plan rules creation, having always in mind that there are some legal minimum rates to apply to the increases, and if the legal minimum rates change then the rules will change as well.
2.5 UK Guaranteed Minimum Pension
The benefits of a pension scheme can be made up of several elements. These elements will have different treatments including different intervaluation increases and/or different rates. The UK pensions have two main components, the GMP and the non-GMP or excess over non-GMP. non-GMP stands for Guaranteed Minimum Pension and is a specific feature of UK pension schemes.
8
The UK State pension comprises two elements for employees, the basic State pension (BSP) and the State second pension (S2P) (between 2002 and 2016, as before April 2002 this was called State earnings related pension scheme (SERPS) and after April 2016 the S2P was replaced by the single-tier state pension). Both BSP and S2P are payable from State pension age (SPA) – this age is equal to 65 for males, 60 for females born before 6 April 1950 and 65 for females born after 6 April 1955, with a transitional scale for females born in between. This SPA is also expected to rise in future. (WTW – LSC Retirement 2017)
A proportion of the National Insurance Contributions (NICs) funds the State pensions and as explained above both employer and employee pay NICs as a percentage of the salaries – these rates are announced in the government’s budget.
The GMPs are a feature of those pension schemes which were contracted out of the State earnings related pension schemes between 6 April 1978 and 5 April 1997. Contracting out would mean no S2P and reduced NICs and was allowed by the government but only if the schemes met some specific conditions designed to ensure that the members’ benefits would not be less than the pension the member would have from S2P if they had not been contracted out. One of these conditions is that from 1978 to 1997 schemes had to provide a minimum level of pension – the GMP. (WTW Training Materials 2016)
In summary, the GMP is the minimum pension which a pension scheme must provide as one of the conditions of contracting out. The State benefits payable in respect of a contracted out employee are reduced by the amount of the guaranteed minimum pension.
It is also important to know that GMP is payable from age 65 for males and 60 for females, referring to these ages as GMP payment age (GPA).
Between 1978 and 1997, there is also another relevant date for the GMP, which is the 6 April 1988, since the GMP data will always be split into Pre and Post 88 amounts because of the increases applied. The increases differ in the Pre and Post 1988 GMP due to the different coverage of the State in how to ensure the payment of such increases. For Pre 88 GMP the State insures all increases whilst for Post 88 GMP the State only insures the
9
payment of the increases above 3% per annum (pa). Thus, referring to statutory increases from the scheme perspective, would mean that the Pre 88 GMP is assumed to be non-increasing (State assumes payment of the increasing portion of the benefit) and Post 88 GMP is considered to increase in line with Consumer Price Index (CPI) rates with a cap of 3% pa.
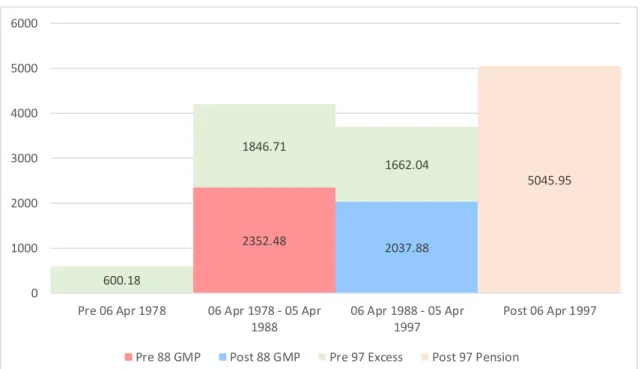
Figure 3 below illustrates a member’s pension tranches. This member started his pensionable service on 2 January 1975 and left active status on 26 March 2004. He has, therefore, Pre 1978 pension, Pre 88 GMP, Post 88 GMP, Pre 97 excess and Post 97 pension, being a good example to reflect what was explained above.
Figure 3. Illustration of the pension tranches of a member Source: WTW Data
Note that the figures were obtained in the client used for the case study of this work. The pension amounts and splits are provided by the administrator – pensions are calculated according to equation (1) above but the administrator only provides us the pension amounts once the members are retired and therefore we have no way to calculate it ourselves. The only thing we can do is, according to the member’s years of service, make sure the tranches make sense, meaning that if the member left active status, let’s say in 1997, then he would not have Post 97 pension.
2352.48 2037.88 600.18 1846.71 1662.04 5045.95 0 1000 2000 3000 4000 5000 6000
Pre 06 Apr 1978 06 Apr 1978 - 05 Apr 1988
06 Apr 1988 - 05 Apr 1997
Post 06 Apr 1997 Pre 88 GMP Post 88 GMP Pre 97 Excess Post 97 Pension
10
3. UK Valuations
As mentioned in the Introduction, I will now provide an in depth explanation on the three different workstages performed during the valuations. In Section 3.1, we will cover the data checks workstage in greater detail, including the reasons for this stage and its importance. Section 3.2 will look into the last valuation basis and the new basis workstages.
3.1 Data
The data extract is the file provided to the LSC which contains all the members’ information required to perform the valuation calculations – these files include all members currently in the scheme and for each member it is provided the pension amounts, sections, sex, dates, and so on (see next chapter for further details).
The starting point in any valuation is opening the data extract provided by the client administrator’s team and confirm all fields needed to perform the valuation are present – this data is what will allow to accurately calculate the liability of each member. Most people whose benefits are being valued are not aware the valuation is going on. However, the administrators and the Trustees have a legal responsibility to protect the members’ personal data.
Thus, data privacy is really important and only the essential information about each pension scheme member is requested for the LSC to be able to perform valuations. This way, and since names, surnames or national insurance numbers (NI) are not necessary in order to calculate the pension liability, they should not be provided and must be removed from the data extract. However, a way to identify the members is necessary, and this is done through a reference number – each member in the scheme has a reference number, which is provided by the administrators. This number provides a way of identifying the members, allowing the administrator to link this reference number to all member’s details, such as name, NI, and other personal information that might be needed.
In the data checks workstage, after taking a first look at the data, a few member reports are examined in order to check that all the necessary fields are present. A mapping
11
between this and last time’s data is done in order to see current fields against previous fields used in the valuation. Individual spot checks are executed to guarantee data quality and to check the reasonableness of the amounts provided.
Once these quick and high level checks are done, the data is imported to the software (this is a WTW internal software), checks for each one of the status separately are performed and the changes that might affect the results with material impact are identified. This is done by comparing the data from one valuation to the other, taking into account the intervaluation period increases and the relevant dates.
Once these checks are completed and the material differences are spotted, queries on unexpected items are sent to the administrators.
After receiving the administrator’s answers to the queries, data corrections are made according to the answers. Here, a point where the LSC and CO teams are both comfortable with the data and its reasonableness for the valuation is supposed to be reached. Note that our goal is to reach this point, but we do not always get there. Sometimes there is no way to get the exact data we need and some assumptions may be needed in order to proceed.
3.2 Liabilities
For this section it is important to start knowing what an assumption is. In this pension scheme’s world, an assumption is set as something we predict for future. As we are trying to calculate each member’s liability up to his/her death, we need to have a way to ‘know’ the future inflation rates and ‘when’ the member is going to die. Given this is quite impossible to predict, assumptions are used, i.e., based on studies, it is possible to estimate when a person is more probable to die, using mortality tables that are calculated knowing the past mortality per age, sex, health condition and so on. The same happens for inflation. Knowing the past years’ inflation rates predictive studies on how the economy will evolve in the coming years are made and with that long term future rates from today onwards are provided. Given we are trying to predict a future event, all these mortality tables and economic rates are called assumptions.
In the Last Valuation Basis workstage we take the data from this valuation (after all the corrections), and we use the new data to perform liability calculations based on the last
12
valuation assumptions to get the funding level, i.e., the ratio between the actuarial value of assets and the actuarial liability (cf. equation (3)). Within this workstage, to check the consistency of the liability results with the previous known results and the assumptions set, the LSC completes reasonableness checks. At this stage, there are two main checks produced. The first is to confirm that the current results are reasonable based on the current data and the assumptions used. The second is to compare these same results against the ones provided at last valuation with the same set of demographic and economic assumptions.
The final workstage is the New Bases, where a different set of assumptions is applied to the data to find the ones that best suit the current market conditions and the current membership and data in order to get the final liability to present to the client (these assumptions are set by CO teams).
13
4. Data quality and relevance
4.1 Data quality
The importance of data quality is often underestimated. However, it is on the quality of data that the actuary’s work is reflected. “The actuaries are provided with guidelines when selecting data, relying on data supplied by others, reviewing and using data, which advise the working party to review data for reasonableness and consistency.” (Campbell, Francis, Prevosto, Rothwell and Sheaf).
In WTW, after the data is received, there are guidelines regarding how to check the data to assess its quality. The data comes with definitions and clear names, in order to know what it refers to (when this is not the case, it is necessary to clarify the fields we are not sure about; also, a comparison between the data provided now and the one provided in the prior valuation is done). “A good way of reviewing data is calculating totals from the data underlying the analysis and trying to find some obvious errors, such as negative amounts for pensions or salaries, or birth dates after the valuation date.” (Campbell, Francis, Prevosto, Rothwell and Sheaf).
Throughout the data checks workstage, it is also necessary to use some judgment to see if the data is adequate for analysis, or if it requires some corrections, or even if it is inadequate to perform the valuation. If inconsistencies and/or the reasonableness of the pension amounts/salaries are in question, it is crucial to formulate queries which are then sent to the pension administrator who confirms the reasons behind the unexpected changes.
Before the queries are formulated it is indispensable to assess whether the issue in question is material towards the valuation. For example, one wrong date of birth for a member with £100 of pension in a population of three thousand members and more than one million pounds of pension overall, is not material as it will not have a big impact. Thus, the materiality limits are usually set around 1% of the total pension for the current status. Once we are provided with the answers by the pension administrator, we can make the required amends to the data, which is then closed once it is considered to be fit for valuation purposes.
14
Good quality data means accurate data and data that we can rely on to perform the calculations.
As an overview for the reader and as an insight to this subject, the main points to look at in a data extract to assess if the quality is as expected are the following:
Membership – by checking the number of members in the scheme at VDATE, we are trying to make sure that we include all members who have a right to receive benefits under the scheme. For that we use the known number of members from the last valuation, the scheme rules and the accounts as supplementary information to support our checks and make sure the number of members we have now is consistent with what would be expected. So, if the plan is closed to new entrants, we do not expect new members to have entered in the scheme, unless they change from one status to another. If it is open, it is necessary to assess if the new entrants are reasonable with the ones that should be expected and the members already present.
Birth dates, dates of leaving active status, dates of entry in the current status or retirement dates for each member should not change from one valuation to the other – if they do, it needs to be queried. All these dates are crucial to the valuation, as with the birthday date we calculate the member’s age that will be used in the calculations, dates of leaving active status or dates of entry are useful to help in the membership check as well as in the service calculations, if needed. Dates that seem odd, namely members that are not born yet (yes, sometimes this happens) or members that get into one status after the VDATE, should also be queried.
Negative amounts – it is clear that it can’t be correct, so it is immediately queried. Pension amounts or salaries that decreased since last valuation – this is not expected, unless they are at a different date. So, if the amounts are at valuation date and decrease from one valuation to another, then they should be queried. If the pensions are provided at date of leaving from active status, for example, then since this date doesn’t change for each member, the amount should not change as well, so in this case the amounts are queried if they do change (increase or decrease).
15
Pension amounts or salaries that do not increase according to the expected intervaluation increases (from LVDATE to VDATE) and lead to a difference in the total current status amounts higher than 1% will be queried. Here, the person who is looking at the data also needs to have some sensibility to assess whether or not the issue is material and should or should not be queried.
According to ‘Report of the Data Quality Working Party’, “in many customer databases, 2% of records per month become obsolete because of deaths and address changes. In addition to this, data entry, merging data from different systems, etc. contribute many additional errors. (…)” (Campbell, Francis, Prevosto, Rothwell and Sheaf).
It is believed that the time spent on data quality issues is not enough, since the work is always done against the clock. This leads to a very high percentage of projects being affected by data quality issues, which will mean poor quality overall in work.
This will then lead to the data importance, which will be detailed in the next section.
4.2 The importance of data 4.2.1 Data extracts
The centrepiece of all actuarial valuations are the data extracts. For different statuses there are different data items needed. However, information such as date of birth and pension amounts (or salaries and years of service for actives) are needed for all statuses and the valuation cannot be performed without them.
The specific data fields needed for each scheme valuation will vary from scheme to scheme and from status to status, since each scheme has its own particularities, its own benefits and its own way of valuing members. However, there are some data fields we can list for each status that will be needed in almost all cases.
For all statuses:
Reference number – unique identifier of each member; Date of birth (DOB);
Sex;
Total pension and relevant pension split amounts and the date at which they are provided.
16
Dependants:
A way of knowing if it is a spouse or a child; Children’s pension end age.
Retirees:
Retirement age or normal retirement date;
Type of retirement, i.e., if the member is retired early, is retired due to ill health, normal retired, and so;
Date pensionable service commenced (DPSC); Date of leaving Active status (DOL).
Deferreds: DOL. Actives Part-time information; Service years; Contributions; Salary history; Accrual rates.
As explained in the last chapter, if it is noticed that some relevant data is missing, it is necessary to request all the missing information from the administrators, and this is the first step of every valuation – guarantee all fields necessary to perform the calculations are available.
The remaining question – why is this information necessary for the valuations? Well, this data is what allows the actuarial team to perform the calculations needed to get the final projected liability for each member and for the whole scheme, and thus to get the funding level of the company.
17
4.2.2 Assumptions
To calculate the scheme liability, it is necessary to start by setting a number of assumptions.
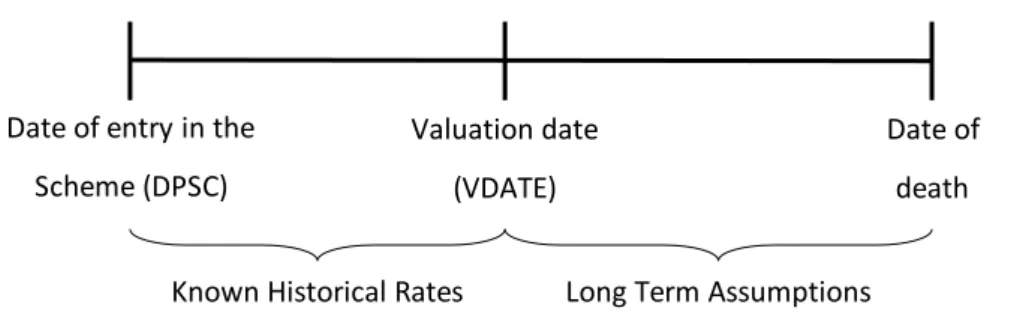
Assumptions are required as the liability calculation can be split into two key periods of time: before valuation date and after valuation date. Before VDATE, the calculations are performed with historical data and historical known rates. For instance, if we want to bring forward an amount for a member that left the company somewhere in the past up to the current date, we are able to do so using past inflation rates. After VDATE, these rates are not known as we are dealing with future events and therefore long term assumptions are necessary. To calculate a liability these assumptions will be essential as we need to predict what will happen from the valuation date to the member’s death (the member’s death is in fact an assumption, as it will be predicted based on past experience as life expectancy and other factors).
Figure 4. Historical rates and assumptions
The assumptions needed are economic ones, such as discount rates, salary increases, pension increases and all other rates necessary to value the members’ benefits and demographic ones, such as mortality tables, proportion married to use for the scheme, age difference for married people and scheme normal retirement age.
For clarity, proportion married is a percentage that is assumed as the members that are married, meaning that if we set the proportion married to be 80%, then 80% of the population is assumed to be married and 20% unmarried. This percentage is set by the CO team in line with Trustees’ indications and based on previous experience. The age difference for married people is an assumption used to set the difference between member and spouse to acquire the age of the spouse of each married member in an
Date of entry in the Scheme (DPSC)
Valuation date (VDATE)
Date of death
18
approximate way. These assumptions are important as they will guide the spouse’s liability calculation for each member.
4.2.3 Calculations
After having set the assumptions, the annuities will be calculated. The formula used to calculate the Expected Present Value (EPV) of the relevant annuities is the standard one (see, for instance Dickson, Hardy and Waters 2013).
𝒂 ̅ 𝒙 = ∫𝟏𝟐𝟎−𝒙𝒆−𝜹𝒕 𝟎 𝒕𝒑𝒙𝒅𝒕, (4) where 𝒂 ̅ 𝒙 = 𝐄𝐏𝐕 𝐨𝐟 𝐚 𝐬𝐭𝐚𝐧𝐝𝐚𝐫𝐝 𝐜𝐨𝐧𝐭𝐢𝐧𝐮𝐨𝐮𝐬 𝐚𝐧𝐧𝐮𝐢𝐭𝐲 𝐩𝐚𝐲𝐚𝐛𝐥𝐞 𝐭𝐨 𝐚 𝐥𝐢𝐟𝐞 𝐚𝐠𝐞𝐝 𝒙; 𝟏𝟐𝟎 𝒊𝒔 𝒕𝒉𝒆 𝒍𝒊𝒎𝒊𝒕 𝒂𝒈𝒆 𝒊𝒏 𝒕𝒉𝒆 𝒍𝒊𝒇𝒆 𝒕𝒂𝒃𝒍𝒆; 𝒆−𝜹𝒕= 𝒅𝒊𝒔𝒄𝒐𝒖𝒏𝒕 𝒇𝒂𝒄𝒕𝒐𝒓 𝒃𝒆𝒕𝒘𝒆𝒆𝒏 𝒕𝒊𝒎𝒆 𝟎 𝒂𝒏𝒅 𝒕𝒊𝒎𝒆 𝒕; 𝒑𝒙 𝒕 = 𝒑𝒓𝒐𝒃𝒂𝒃𝒊𝒍𝒊𝒕𝒚 𝒐𝒇 𝒕𝒉𝒆 𝒑𝒂𝒚𝒎𝒆𝒏𝒕 𝒃𝒆𝒊𝒏𝒈 𝒎𝒂𝒅𝒆 𝒂𝒕 𝒕𝒊𝒎𝒆 𝒕.
After the EPV of the annuities have been calculated, we can then compute the expected liability of each member using equation (5).
𝑳𝒊𝒂𝒃𝒊𝒍𝒊𝒕𝒚 = 𝑷𝒆𝒏𝒔𝒊𝒐𝒏 𝒂𝒕 𝑻𝑽𝑫 ∗ 𝒂̅ 𝒙∗ 𝑻𝒊𝒎𝒊𝒏𝒈 𝒂𝒅𝒋𝒖𝒔𝒕𝒎𝒆𝒏𝒕𝒔 (5)
We have the pension at this valuation date (TVD) but the increase date normally is not the same as the valuation date (although it can be). To calculate the EPV of a continuous annuity, which is the one used by LSC software, it is assumed that the next increase occurs in six months. However, this may not be the case and therefore adjustments to either bring forward or take backward the value are necessary to reflect the actual increase date.
19
For example, valuation date is 1 March and increase date is 1 April, as in the timeline shown in Figure 5 below.
Figure 5. Timing adjustments timeline 1 (6-1=5 months adjusted)
The liability would be calculated assuming the increase would be six months after 1 March, but in fact it is just one month after and therefore an adjustment of 5 months would be necessary.
𝑨𝒅𝒋𝒖𝒔𝒕𝒎𝒆𝒏𝒕 𝒓𝒆𝒒𝒖𝒊𝒓𝒆𝒅 = (𝟏 + 𝑷𝒆𝒏𝒔𝒊𝒐𝒏 𝒊𝒏𝒄𝒓𝒆𝒂𝒔𝒆𝒔)𝟓/𝟏𝟐 (6)
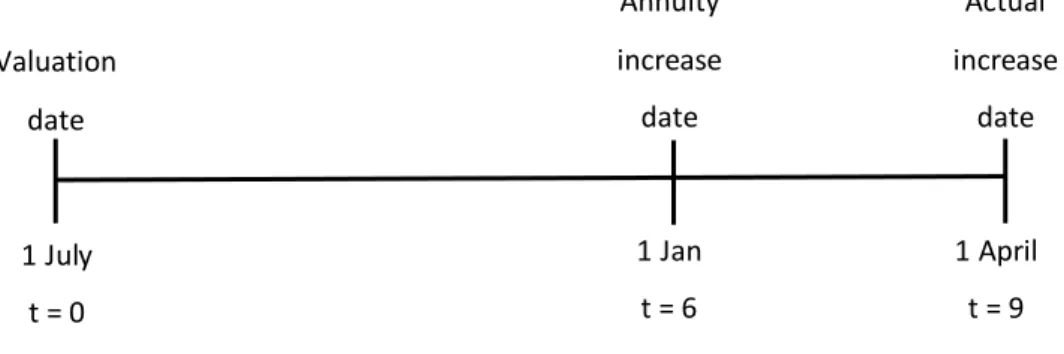
On the contrary, if the valuation date was 1 July and increase date 1 April, as shown in Figure 6 below.
Figure 6. Timing adjustments timeline 2 (6-9 = -3 months adjusted)
Then the assumed increase date in the calculations would be 6 months after 1 July, whilst in fact it is 9 months after, and so the valued would need to be adjusted by 3 months.
𝑨𝒅𝒋𝒖𝒔𝒕𝒎𝒆𝒏𝒕 𝒓𝒆𝒒𝒖𝒊𝒓𝒆𝒅 = (𝟏 + 𝑷𝒆𝒏𝒔𝒊𝒐𝒏 𝒊𝒏𝒄𝒓𝒆𝒂𝒔𝒆𝒔)−𝟑/𝟏𝟐 (7) 1 March t = 0 1 April t = 1 Valuation date 1 September t = 6 Actual increase date Annuity increase date 1 July t = 0 Valuation date 1 Jan t = 6 Actual increase date Annuity increase date 1 April t = 9
20
4.2.4 Data importance and consequences
If the data used to calculate the annuities and the liability is not completely accurate, then the calculations performed will not provide the actuary with the correct information, which will mean that the reports presented to the client with the scheme’s funding level will not be accurate.
An inaccurate funding level can lead to one of two problems, depending on whether the calculated liability is higher or lower than the true value. In any case, depending on the inaccuracy, it can lead to concerns.
Assuming that the liability derived with the ‘wrong’ data is lower than the true liability. The true liability is higher than the assets and the wrong one is lower. The report will show that the scheme is in surplus, when in reality it is in deficit. This way, the Trustees of the scheme will believe the scheme to be in surplus and can keep going as it is, when in reality it is not the case. This would lead to further problems and may cause the client or its stakeholders to make inappropriate decisions.
If a scheme is in deficit, meaning the assets are not enough to cover the liabilities, the company will need supplementary contributions (normally defined as deficit contributions) to inject extra money into the fund. This is done through a long term contribution strategy usually described as ‘Schedule of Contributions’. This consists in defining a contribution plan for a given period of time with the intention of placing the company in a break-even or surplus scenario by the end of that period.
We could also think of another possible scenario. We have a deficit in a specific valuation and the value needed to cover the liability calculated is say 25 million pounds. The client accepts our conclusions and because the company is in a strong financial position it decides to do a one-off contribution to the plan of £25m. In the next valuation, it is spotted that due to the inconsistencies of the previous valuation data against the current valuation data, there were some errors in the last time that leaded to the previous liability to be overstated by £30m. This would mean that the fund was in fact with a surplus all along and the one-off contribution was never necessary. Since the company is not able to, under normal circumstances, have the money contributed to the scheme back, they couldn’t get the £25m back. The only possibility for the scheme
21
to have the money returned is once every member of the scheme and all of their dependants have left, either transferred out, been bought out or died).
In either case, bad data may cause the client to make a decision that later turns out to have been inappropriate.
If the scheme is in surplus but the Trustees and sponsor, due to bad data, believed it to be in deficit, the scheme sponsor could be forced to make additional contributions to the scheme rather than using the money to invest in his own business. This could ultimately compromise the company business, as the money could otherwise serve to improve or expand other areas of the business and improve its long-term profitability. If the scheme is in deficit when it was believed to be in surplus, then money will need to be injected into the scheme, possibly at short notice, and in the worst case scenario the company could go insolvent if there is not enough money to cover the deficit.
So, it is important to have the most accurate results possible, to make appropriate plans for funding the scheme and manage any surplus or deficits.
22
5. Numbers speak
Believing that the discussion of practical cases is a good way to gain a deeper understanding of the reasons why data and its quality is so important, this chapter will be all about numbers and concrete problems. A sample data set will be used and changes to it will be made so as to replicate some common data problems. Then a comparison between the actual result and the results obtained with some inaccuracies in the data will be shown. The purpose of these comparisons is to see the real impact that some common data issues can have.
Note that all these are real problems that often occur throughout the valuation process and in the data provided (as a matter of fact, more times than would be expected). Also, issues such as the ones we will discuss below would typically be spotted and corrected in the data checks workstage, but for the purpose of this work, results were obtained with the wrong data to get a better understanding of the impact of such small details. It is possible to get results with inaccurate data because WTW softwares perform all the calculations in an automatic way, and thus it won’t notice if something seems unreasonable. In this way, even things that look like obvious mistakes will fall through. The specific data issues we will examine are listed below with each example’s impact. A table comparing the results is presented to show the overall conclusions of this case study.
5.1 Initial considerations
The sample client used to acquire the results below has 618 members in the scheme and they are split across all statuses according to the following table:
Status Nr of members Actual Liability (£)
Children and Spouse 2 + 16 2,321,992
Retirees 255 52,739,748
Deferreds 284 25,305,070
Actives 61 17,941,528
TOTAL 618 100,308,338
Table 1. Membership and liability of the client used in the case study Source: WTW Data with its software calculations
23
These were the values assumed as correct and thus all the comparisons were prepared against these values.
Note that a valuation date of 30 June 2016 was used to achieve the results in this case study. The pension increase date is 01 April.
Below, in each case study, the same calculation can have two different liabilities, as they were reached using two different methods. In the ones where calculations are shown and done by hand, the method used was the annuity method shown in formulas (4) and (5) above, whilst the liabilities taken from the WTW euVal Liabilities software uses the Cashflow method (it will calculate the discounted Cashflow for each year and then sum them to get the final liability). Nevertheless, the liabilities will be really close to each other but not exactly the same value.
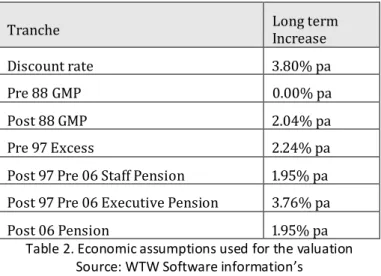
The long term economic assumptions that were provided by the CO team and used for these calculations were the following:
Tranche Long term Increase
Discount rate 3.80% pa
Pre 88 GMP 0.00% pa
Post 88 GMP 2.04% pa
Pre 97 Excess 2.24% pa
Post 97 Pre 06 Staff Pension 1.95% pa Post 97 Pre 06 Executive Pension 3.76% pa
Post 06 Pension 1.95% pa
Table 2. Economic assumptions used for the valuation Source: WTW Software information’s
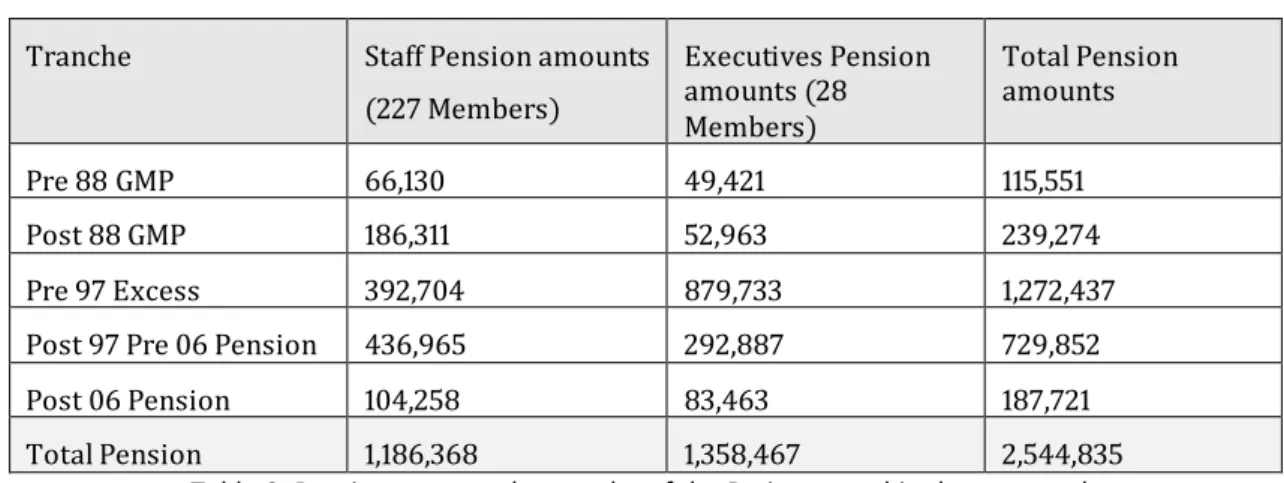
Last thing to notice is that for easier calculations and given the goal of this exercise, all examples were done using retired members, although in the final considerations an analysis for the whole scheme is made. Hence, the total pension for Retirees split according pension tranches and category codes is stated in table 3 below.
24
Tranche Staff Pension amounts
(227 Members) Executives Pension amounts (28 Members) Total Pension amounts Pre 88 GMP 66,130 49,421 115,551 Post 88 GMP 186,311 52,963 239,274 Pre 97 Excess 392,704 879,733 1,272,437
Post 97 Pre 06 Pension 436,965 292,887 729,852
Post 06 Pension 104,258 83,463 187,721
Total Pension 1,186,368 1,358,467 2,544,835
Table 3. Pension amounts by tranche of the Retirees used in the case study Source: WTW Data
5.2 Results
5.2.1 Missing category codes
In some schemes, the benefits are different according to the members’ category. For example, if a scheme differentiates the benefits of Executive and Staff members, then they would be valued separately and in a different way. Assuming we have two members exactly with the same accrual rate and the same years of service, but one was Staff and the other one was an Executive. Typically, executive members have higher salaries than Staff members. Thus, the Executive member would usually be expected to have a higher pension than the Staff one, as the salary would be higher.
Aside from any potential differences in pension amounts, Executive members tend to have better benefits than Staff members, which, for example, could mean higher pension increases compared with Staff members. To value the members in the correct category, there is a need to have a data field provided by the administrators in the raw data where we can identify the category of the member.
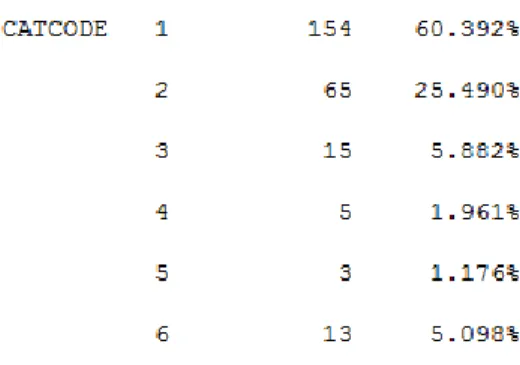
For this client, members should be split into Executives and Staff. In Figure 7 below, the reader can see the category code data field (CATCODE), the values it has (from 1 to 6) and how many retirees should be in each category (with the percentage over the total number of retirees). The administrator has also confirmed that members with CATCODE equal to 3 or 6 are Executive and all the others should be valued as Staff members.
25
Figure 7. Category codes and membership associated to each category Source: WTW euVal Data Software
Sometimes it happens that this field is not provided or it is equal for all members. For the purpose of this example, we will assume that all members have this field but it is equal for everyone and thus all members would be valued as Staff in the valuation. As such, following the Figure 7 above, the CATCODE field would be equal to 1 for all members. This way, we would be undervaluing 15 members with CATCODE 3 and 13 with CATCODE 6 (28 Executive members in total) as we would value their correct pension amount, but the benefits and assumptions used would be the ones from Staff which would return a lower liability than if they were valued as Executives.
In this client, one of the differences between Staff and Executives is the increase in payment for pension linked to the service between Post 1997 Pre 2006, which leads to different long term increases as shown in the figures below.
Figure 8. Executive members’ long term increases in payment Source: WTW euVal Liabilities Software
Figure 9. Staff members’ long term increases in payment Source: WTW euVal Liabilities Software
For Executives, the increase is higher than for Staff as Staff members have a cap of 2.5% in the Post 97 Pre 06 tranche whilst executive members have a floor of 3% and a cap of 5% in the exact same tranche (and in this valuation they have 3.75% and 1.95% in the long term increase). Thus valuing all retirees as Staff would mean undervaluing the Executive members.
26
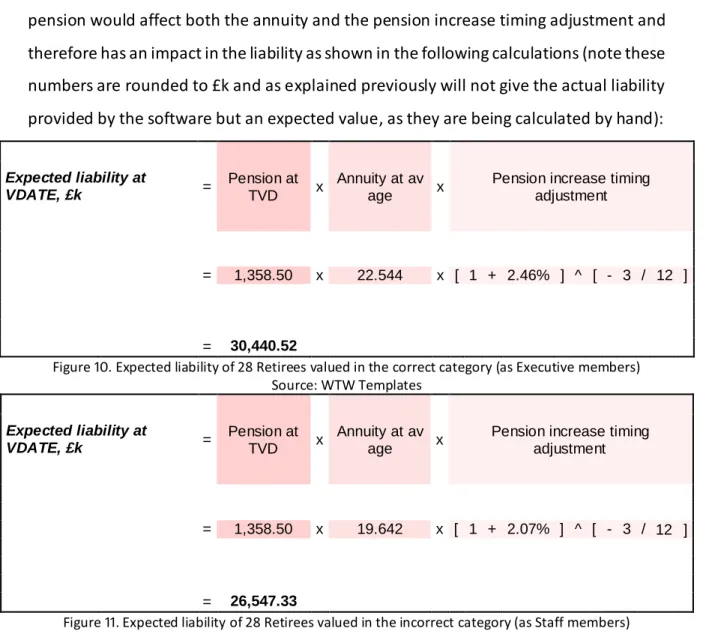
As previously discussed, the liability output is derived by three main components – pension in payment, annuity and timing adjustments. This change in payment increase pension would affect both the annuity and the pension increase timing adjustment and therefore has an impact in the liability as shown in the following calculations (note these numbers are rounded to £k and as explained previously will not give the actual liability provided by the software but an expected value, as they are being calculated by hand):
Expected liability at VDATE, £k = Pension at TVD x Annuity at av age x
Pension increase timing adjustment = 1,358.50 x 22.544 x [ 1 + 2.46% ] ^ [ - 3 / 12 ] = 30,440.52
Figure 10. Expected liability of 28 Retirees valued in the correct category (as Executive members) Source: WTW Templates Expected liability at VDATE, £k = Pension at TVD x Annuity at av age x
Pension increase timing adjustment = 1,358.50 x 19.642 x [ 1 + 2.07% ] ^ [ - 3 / 12 ] = 26,547.33
Figure 11. Expected liability of 28 Retirees valued in the incorrect category (as Staff members) Source: WTW Templates
The liability would be undervalued by around 4 million pounds, which would represent a percentage in the 255 retirees’ total liability of
𝑫𝒊𝒇𝒇𝒆𝒓𝒆𝒏𝒄𝒆 =£ 𝟒𝟖,𝟔𝟔𝟕,𝟑𝟑𝟕£ 𝟓𝟐,𝟕𝟑𝟗,𝟕𝟒𝟖− 𝟏 = −𝟕. 𝟕𝟐%
Undervaluing this liability could mean that the scheme would run out of money and couldn’t be able to pay all the pensions it is supposed to pay, as they are being valued with a lower number than in reality they would cost and the scheme would not take into account the necessary money.
27
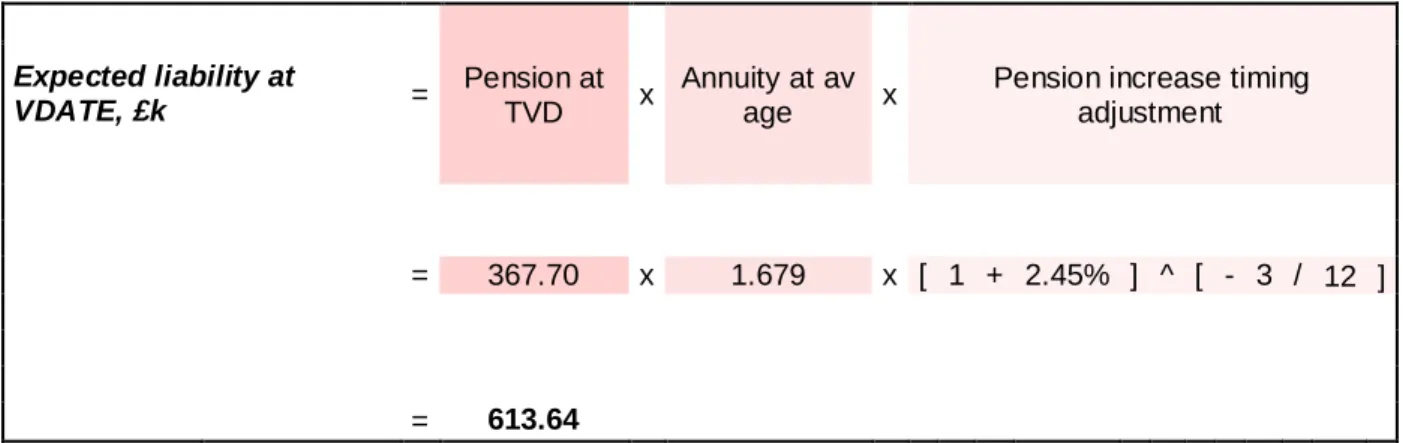
5.2.2 Missing Date of Birth
As explained before, DOB is fundamental to determine the liabilities, firstly since it is the main determinant of how many future years of payment are expected, and also, at a second-order level, because the mortality assumptions will depend on the members’ age. A very common mistake that is found is in the dates, that sometimes come as blank and excel will turn it into a default date equal to 01/01/1900, which will be the date used by the software.
In this example, we will see the impact of having the incorrect date for just one member, and the following table shows this member’s dates.
DOB Age
Correct data 02/07/1948 68 Incorrect data 01/01/1900 116
Table 4. Member’s date of birth correct and incorrect and respective ages Source: WTW Data
The liability for this member would be calculated using two very different annuities (note these numbers are rounded to £k and as explained previously will not give the actual liability provided by the software but an expected value):
Expected liability at VDATE, £k = Pension at TVD x Annuity at av age x
Pension increase timing adjustment = 367.70 x 1.679 x [ 1 + 2.45% ] ^ [ - 3 / 12 ] = 613.64
Figure 12. Expected liability of one member calculated with incorrect DOB Source: WTW Templates
28 Expected liability at VDATE, £k = Pension at TVD x Annuity at av age x
Pension increase timing adjustment = 367.70 x 23.058 x [ 1 + 2.45% ] ^ [ - 3 / 12 ] = 8,427.28
Figure 13. Expected liability of one member calculated with correct DOB Source: WTW Templates
This change in the age would decrease the EPV of this member’s annuity, as he is being valued as much older than he is in reality: fewer payments are expected with much lower probabilities. The liability is obviously lower if the member is 116 years old than if he is 68 years old.
In the table below it is shown the impact of this mistake in the retirees’ liability.
WTW Software Liabilities
255 Retirees 1 Retiree
Correct data (£) 52,739,748 8,467,677
Incorrect data (£) 44,866,233 594,162
-14.93%
Table 5. Impact of valuing the incorrect DOB for one member Source: WTW euVal Liabilities Software
5.2.3 GMP amounts switched
As explained above, the UK pensions have the GMP particularity. This guaranteed minimum pension is split in Pre and Post 1988, according to each member’s service. This amount and the respective split is provided by the administrator, but it can happen that it is switched, which means that the Pre 88 amounts were in fact the Post 88 ones and the opposite.
As shown in the assumptions above, the Pre 88 GMP does not increase, whilst the Post 88 GMP is expected to increase at a rate of 2.04% pa in the long term.
Looking at the table 6 below, it is possible to see a comparison between the amounts and the liabilities obtained when valuing the GMP correctly and when valuing it switched. Note that this is related to retirees only.
29
(k£) Correct data Switched amounts Amount Liability Amount Liability Pre 88 GMP 115.60 1,809.35 239.30 3,463.70 Post 88 GMP 239.30 4,608.90 115.60 2,537.78 Non GMP 2,190.00 46,321.50 2,190.00 46,362.62 Total 2,544.90 52,739.75 2,544.90 52,364.10
Table 6. Pension amounts by tranche and respective Liability with correct data and with GMP amounts switched
Source: WTW Data and Cashflow Viewer Software
According to table 6, it is possible to see that with the switch, the Pre 88 GMP would be overvalued (as it would increase the amount) and the Post 88 GMP would be undervalued. The Non GMP is broadly the same (the difference is due to some adjustments and savings applied by the software). Overall, we would be undervaluing the amounts and hence this switch would decrease the total liability. In this example, we got a decrease in the total retirees’ liability, which represents around half million pounds that would not be taken into account in the valuation.
𝑫𝒊𝒇𝒇 =𝑳𝒊𝒂𝒃 𝒗𝒂𝒍𝒖𝒊𝒏𝒈 𝑮𝑴𝑷 𝒔𝒘𝒊𝒕𝒄𝒉𝒆𝒅 𝑨𝒄𝒕𝒖𝒂𝒍 𝒕𝒐𝒕𝒂𝒍 𝒍𝒊𝒂𝒃𝒊𝒍𝒊𝒕𝒚 =
£ 𝟓𝟐, 𝟑𝟔𝟒, 𝟏𝟎𝟑
£ 𝟓𝟐, 𝟕𝟑𝟗, 𝟕𝟒𝟖− 𝟏 = −𝟎. 𝟕𝟏%
5.2.4 Decimal places
Another common error that is found has to do with decimal places. The amounts come from the administrator with the decimal places in the wrong place.
In this case, suppose that the administrator sent the amounts for one retiree member all divided by 100, i.e., the decimal places moved two houses left – instead of a total pension equal to £367,724.28, the member would be valued with a pension of £3,677.24. Dividing all the amounts by 100 would mean dividing the member’s liability by 100 as well, and therefore the liability would be only 1% of the actual one.
In this case, the member’s difference in liability would be:
WTW Software Liabilities
255 Retirees 1 Retiree
Correct data (£) 52,739,748 8,467,677
Incorrect data (£) 44,356,748 84,677
-15.90%
Table 7. Impact of valuing the incorrect pension for one member Source: WTW euVal Liabilities Software
30
If this is happening to members with low pensions and there are just one or two cases, the impact will be minimal, but if this happens to a whole section of members or to members with high pension amounts, it can have a huge impact on the calculated liability. In this case the impact is big as the member shown is the one with highest pension amount and is an Executive member.
5.2.5 Spouse fraction
In Pension Schemes members can choose to give up some or all of the pension they are entitled to receive from retirement and receive it immediately. Giving up part or all of the pension in exchange for a cash lump sum equal to its value is called commutation. (Julian Mainwood 2014).
This will generate two different amounts, a pension amount before the member commutes the pension – called pre commuted pension at retirement – and an amount after commutation – called post commuted pension at retirement. The pre commuted amount is observably higher than (or equal to) the post commuted amount.
Retirees, deferreds and actives can be married, which leads to them having a dependant after their death. Due to this, when calculating their value, it is necessary to calculate both liabilities, member and spouse. The calculations for a spouse liability are the same as for a member (see equation (5)). However, we often are not provided with marital status nor spouse date of birth, thus why proportion married and age difference assumptions are used. Also, it is common for the administrators not provide us the spouse pension of each married member and for that reason an assumption is used as well. Hence the spouse pension is not provided and needs to be calculated. To calculate the spouse pension, we pick up the member pension and apply a percentage to it. This percentage is stated in the scheme rules.
There are three possible ways to find the spouse pension amount:
It is given directly in the raw data fields and therefore it will be checked upon the data checks workstage as any other field;
It is a percentage of the member’s post commuted pension (the accrued pension of the member that is being used to calculate the member’s liability);
31
It is a percentage of the member’s pre commuted pension.
For the last two options, the percentage to be used is stated in the scheme rules and a spouse fraction is calculated to be applied to the member’s accrued pension at valuation date. For the first option, the spouse amount is used directly.
In this sample client, according to the scheme rules and the data received, the spouse pension is based on a percentage of the member’s pre commuted amount and therefore the spouse fraction to be applied to the member’s accrued pension is calculated in the following way:
𝑺𝒑𝒐𝒖𝒔𝒆 𝒇𝒓𝒂𝒄𝒕𝒊𝒐𝒏 =𝑴𝒆𝒎𝒃𝒆𝒓𝑴𝒆𝒎𝒃𝒆𝒓′′𝒔 𝑷𝒓𝒆 𝑪𝒐𝒎𝒎𝒎𝒖𝒕𝒆𝒅 𝒑𝒆𝒏𝒔𝒊𝒐𝒏𝒔 𝑷𝒐𝒔𝒕 𝑪𝒐𝒎𝒎𝒖𝒕𝒆𝒅 𝒑𝒆𝒏𝒔𝒊𝒐𝒏∗ 𝑷𝒆𝒓𝒄𝒆𝒏𝒕𝒂𝒈𝒆. (8)
Here, if the member’s commuted amounts are not accurate, it will lead to a spouse pension that is not reasonable and consequently to a spouse liability that is not correct. In this example, we got a member for whom the pre commuted pension was very high and therefore the spouse pension was much higher than the member’s accrued pension, which would increase the total liability as the spouse’s liability would be higher than expected.
Member’s Pre
Comm Pension Member’s Post Comm Pension Percentage Spouse fraction
Correct data 116,224.13 87,947.4 60% 79%
Incorrect data 1,162,244.13 87,947.4 60% 793%
Table 8. Commuted pensions and respective spouse fraction Source: WTW Data
The spouse’s pension here was more than 100% of the member’s pension, and so the spouse’s liability we got was higher than the member’s liability, increasing total liability.
Expected liability at VDATE, £k = Member Pension at TVD x Member Annuity at av age + Spouse Pension at TVD x Spouse Annuity at av age
x Pension increase timing adjustment = [ 60.59 x 18.054 + 48.04 x 5.160 ] x [ 1 + 2.20% ] ^ [ - 3 / 12 ] = 1,334.50
Figure 14. Expected liability of one member calculated with correct spouse fraction Source: WTW Templates