Analysis, design, and evaluation of a
contextual information system for older
adults
Inês Alexandra dos Santos Carneiro
Mestrado Integrado em Engenharia Informática e Computação Supervisor: Miguel Pimenta Monteiro
Second Supervisor: Ana Vasconcelos
information system for older adults
Inês Alexandra dos Santos Carneiro
Mestrado Integrado em Engenharia Informática e Computação
Nowadays, population is consuming more technology than ever before. The internet has revo-lutionized our ability to create, store and recover information in a moment. It has become an essential part of our society.
On an average day, a person is in contact with thousands of information items from various sources. There is more information available than we can comfortably process and because this information is so varied, it brings many issues such as how to represent it in a more useful manner so the user can use it efficiently. Also, such vast quantities of information lead to a large number of choices and possible confusion which can result in decision paralysis. With this project, we aim to study an application developed at Fraunhofer Portugal AICOS, the SmartCompanion, and show how we can create meaningful information for the user and how best to present it. A constant challenge for this project is also to discover something we did not know about the users before, and how technology fits into their lives.
Smart Companion (SC) is an Android launcher that was created to address senior’s goals and needs. It aims to be a permanently available companion, bringing seniors closer to their caregivers at all times by being remotely connected (in and outdoors), allowing caregivers to be aware and prevent risky situations (such as the risk of isolation, fall risk calculation, activity monitoring and fall detection) and consequently improving seniors’ self-confidence and sense of protection. This Android launcher collects different data on the usage that the elderly make of smartphones, such as communications, locations, and activity, among others. This information is spread over several applications and is made available to the user without any cross-linking of data from different sources. So the goal of this project is to understand how we can process this information so that it has the maximum meaning to the user.
To achieve these goals, a User-Centered Design methodology was followed, to focus on older adults’ specificities and therefore to create an adequate product that is easy to use by them. The final result was a contextual information system prototype that shows the information available in SC in a way that is more relevant to the user, and which has been co-designed and tested by them.
Atualmente, a população está em contato com tecnologia mais do que nunca. A internet rev-olucionou a nossa capacidade de criar, armazenar e recuperar informação. Tornou-se uma parte essencial da nossa sociedade.
Num dia normal, uma pessoa está em contato com informação de diversas fontes. Há mais informação disponível do que a que conseguimos processar e uma vez que essa informação é tão variada, acaba por levantar algumas questões, como, por exemplo, qual a melhor forma de representação para que o utilizador possa utilizar a informação de forma mais eficiente. Adi-cionalmente, esta quantidade de informação cria a uma grande quantidade de escolhas e possíveis confusões que podem resultar numa paralisia na tomada de decisão. Com este projeto, procuramos estudar uma aplicação desenvolvida na Fraunhofer Portugal AICOS, o SmartCompanion e mostrar como podemos criar informação significativas para os utilizadores e a qual a melhor maneira de a representar.
O Smart Companion (SC) é uma aplicação Android que foi criada para satisfazer os obje-tivos e necessidades dos idosos. Esta aplicação pretende ser um companheiro permanentemente disponível, aproximando os idosos dos seus cuidadores em todos os momentos permitindo que os cuidadores conheçam e possam evitar situações de risco (como o risco de isolamento, cálculo de risco de queda, monitorização de atividades e detecção de quedas) e, consequentemente, melhorar a autoconfiança dos idosos e a sua sensação de proteção. Esta aplicação Android recolhe diversos dados sobre o uso que os idosos fazem dos smartphones, tais como: comunicações, localizações, atividades, entre outros. Esta informação encontra-se espalhada por diversas funcionalidades e é disponibilizada ao utilizador sem qualquer cruzamento de informação de diferentes fontes. Por-tanto, o objetivo deste projeto foi entender como processar a informação de diferentes fontes para que tenha significado máximo para o utilizador.
Para alcançar estes objetivos, será seguida uma metodologia de design centrado no utilizador, para que se possa criar um produto adequado e fácil de usar para os seus utilizadores. O resultado final é um sistema contextual que mostra a informação disponível no SC, de uma maneira mais relevante para o utilizador e que foi projetada e testada por ele.
First, I would like to thank my supervisors, Miguel Pimenta Monteiro and Ana Vasconcelos, for all the knowledge and support given throughout all stages of this thesis. For their support and insightful feedback that was very important for the successful completion of this research.
I would also like to express my sincere appreciation to all the seniors that I had the pleasure to interview for my dissertation and all their valuable and honest help in the evaluation tests, and also for all the laughs and funny stories shared.
Many thanks to everybody at Fraunhofer Portugal AICOS for providing a fantastic environ-ment for this project to succeed on. It was a great experience working with such cheerful group of people. Thank you for all the great conversations that we shared.
And on a personal note, I would like to everybody that I had the chance to meet during my passage in MIEIC for always being there for me when needed. It was, without a doubt a great experience sharing this past five years with all of you. Thank you for all the great moments that we shared.
Last, but certainly not least, I want to thank my dear family, and my most beloved friend Diogo for always standing by my side during my academic journey and personal life. I know that it was not easy. For still believing and trusting in me and enable me to pursue my dreams. There are not enough words that can express my gratitude, and I hope that what the future holds only deepens our bonds even further.
Thank You!
1 Introduction 1
1.1 Contextualization . . . 1
1.2 Motivation and Objectives . . . 2
1.3 Document Structure . . . 3
2 Background and State of the Art 5 2.1 Age-related changes . . . 5
2.1.1 Cognitive Changes . . . 6
2.1.2 Perceptual Changes . . . 7
2.1.3 Psychosocial Changes . . . 7
2.1.4 Interaction with Technology . . . 7
2.2 Mobile information visualization . . . 9
2.3 Mobile personal assistants, dashboards and trackers . . . 11
2.4 Related projects . . . 11
2.4.1 For the mainstream audience . . . 13
2.4.2 For seniors . . . 13
3 Methodology 15 3.1 User-Centered Design . . . 16
3.2 Specifying the Context of Use . . . 19
3.2.1 Questionnaires . . . 19
3.2.2 Interviews . . . 19
3.2.3 User Profiles . . . 20
3.2.4 Personas . . . 20
3.3 Specifying the User Requirements . . . 21
3.3.1 User observations . . . 21
3.3.2 Focus groups . . . 21
3.3.3 Scenarios . . . 21
3.4 Iterative and Incremental Prototyping . . . 22
3.4.1 Card Sorting . . . 22
3.4.2 WireFrames . . . 23
3.4.3 Mockups . . . 23
3.5 Evaluating the Design . . . 23
3.5.1 Wizard of Oz . . . 24
4 Solution development 25
4.1 Smart Companion: an overview . . . 25
4.2 Requirements definition . . . 26
4.2.1 Interview analysis . . . 26
4.2.2 Card sorting . . . 30
4.3 Solution proposal - prototyping . . . 38
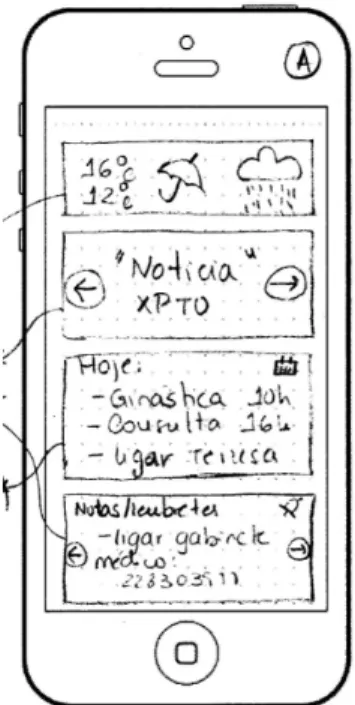
4.3.1 Paper Prototypes . . . 39
4.3.2 Medium-fidelity prototype - Medical Context Prototype . . . 44
4.4 Conclusion . . . 47
5 Evaluation and Discussion of results 49 5.1 Final Validation . . . 49 5.1.1 Paper prototypes . . . 50 5.1.2 Medium-fidelity prototype . . . 55 5.1.3 Conclusion . . . 57 5.2 Discussion . . . 57 5.2.1 Expected results . . . 57
5.2.2 Working with older adults . . . 58
5.2.3 Lessons Learned . . . 59
6 Conclusion and future work 61 References 63 A Script 69 A.1 Objective . . . 69
A.2 Purpose of Interview . . . 69
A.3 Questions . . . 69
B Personas 71 C Card sorting Protocol 77 C.1 Users . . . 77
C.2 Context of product use . . . 77
C.2.1 Facility . . . 77
C.2.2 Participant’s computing environment . . . 77
C.2.3 Display devices . . . 77
C.3 Test procedure . . . 78
C.3.1 Scenarios to be tested . . . 78
C.3.2 Participant general instructions . . . 78
C.3.3 Participant task instructions . . . 78
D Usability Test Protocol 81 D.1 Users . . . 81
D.2 Context of product use in the test . . . 81
D.2.1 Test Facility . . . 81
D.2.2 Participant’s computing environment . . . 81
D.2.3 Display devices . . . 81
D.3 Test procedure . . . 82
D.3.2 Participant general instructions . . . 82
D.3.3 Participant task instructions . . . 82
E Questions for cards 85 E.1 Meteorology card . . . 85
E.2 News card . . . 85
E.3 Events/Calendar card . . . 85
E.4 Notes/Reminders card . . . 85
E.5 Routes and transportation card . . . 85
E.6 Activity card . . . 86
E.7 How are you card . . . 86
E.8 List of objects to not forget card . . . 86
E.9 Suggestions card . . . 86
3.1 ISO 9241-210:2010 for User-centered design methodology . . . 18
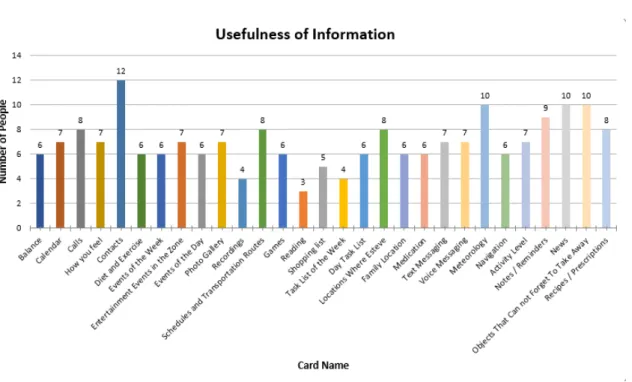
4.1 Chart with the most useful information for the user . . . 31
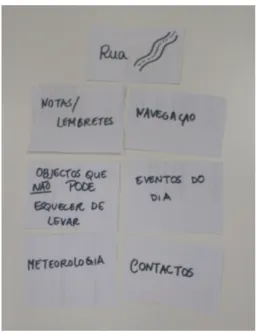
4.2 Example of response for useful Information . . . 31
4.3 Example of response for Morning . . . 32
4.4 Example of response for Afternoon . . . 32
4.5 Example of response for Night . . . 32
4.6 Example of response for Home . . . 33
4.7 Example of response for Outside . . . 33
4.8 Example of response for doctor . . . 33
4.9 Chart with the most useful information in the morning for the user . . . 34
4.10 Chart with the most useful information in the afternoon for the user . . . 35
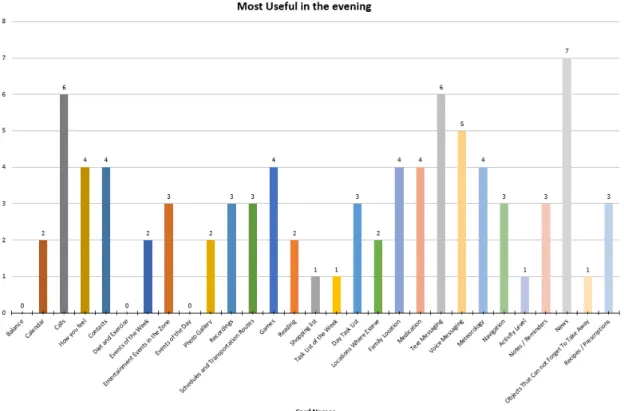
4.11 Chart with the most useful information at night for the user . . . 36
4.12 Chart with the most useful information when the user is at home . . . 37
4.13 Chart with the most useful information during a doctors appointment for the user 37 4.14 Chart with the most useful information when the user is outside . . . 38
4.15 morning prototype . . . 40 4.16 afternoon prototype . . . 41 4.17 night prototype . . . 42 4.18 house prototype . . . 43 4.19 Outside prototype . . . 44 4.20 Medical prototype . . . 45
4.21 Medical history prototype . . . 46
4.22 Prescriptions prototype . . . 47
4.23 Two examples of the card with suggestions . . . 48
5.1 Initial phase of the test . . . 50
5.2 First version of routes and schedules of the transportations card . . . 51
5.3 Second version of routes and schedules of the transportations card . . . 51
5.4 Final version of routes and schedules of the transportations card . . . 51
5.5 Two versions for the meteorology card with different layouts . . . 52
5.6 Two versions for the news card with different layouts . . . 52
5.7 Activity card layout . . . 53
5.8 Two versions for the calendar card with different layouts . . . 53
5.9 Two versions for the list of objects to not forget card with different layouts . . . . 54
5.10 Four versions for the notes/reminders card with different layouts . . . 55
HCI Human Computer Interaction PA Personal Assistant
SC Smart Companion UCD User-Centered Design
Introduction
As time goes by more and more information is generated from various sources with various types and formats. It has become an essential part of human life, which can bring new ways to think and evolve. As an individual on an average day, we can go through thousands of information from emails, to chats, to schedules, news, etc. [KSFN08] Since this information is so versatile, it brings many issues in how to represent it in the most useful manner so the user can efficiently use it.
With population aging being more and more a reality worldwide, this brings one to think in what is the best way to represent this massive data for the user to understand and extract knowledge from it, without never forgetting the needs of these users.
1.1
Contextualization
Technology has brought many benefits to our society. Studies estimate that by the year of 2020 smartphones with internet access will increase in number, from two to six billion, resulting in two-to-three times more smartphones in use than PCs, along with an explosion of related applications [staa,stab].
Over the last few decades, computing and the internet have revolutionized the ability to create, store and recover information in an instant. A global economy and instant communication have created an explosion in the amounts of data to which we are exposed. Still, this quantity of data leads to a large number of choices and possible confusion which can result in decision paralysis. There’s more data available than we can comfortably process. So there is also the need to make sense of it all. Information visualization is the art of representing data in a way that it is easy to understand and to manipulate. It is used to make sense of information and thus make it useful in our lives [OB08]. Information and communication technologies can bring numerous benefits to seniors enabling them and their caregivers to improve their quality of life.
Despite the great advantages of such applications, their adoption and acceptance are dependent on the skill for handling and understanding digital media. Devices such as smartphones are incor-porated with touchscreens that provide a more natural and intuitive method of interaction with the user interface [Muf17], which may ultimately enable a more natural and intuitive interaction.
This project is part an existing project at Fraunhofer AICOS named Smart Companion (SC), which consists of an Android launcher that was specially designed to address seniors’ goals and needs [Sma]. Its main goal is to ease the use of a smartphone by reducing its complexity. It includes a set of applications that range from simple calls and messages to more complex ones, such as activity monitoring and fall detection. It seeks to support older adults in areas such as prevention of isolation, promotion of autonomy and quality of life, and improvement of health conditions.
This work is the result of an opportunity for improvement in the Smart Companions launcher. It is within the area of information visualization, concerning information visualization in smart-phones. The development will be made at Fraunhofer Portugal Research Centre for Assistive In-formation and Communication Solutions (AICOS). This research center concentrates its activity in the area of information and communication solutions, working to improve end-user experience and the usability of its applications [Fra].
1.2
Motivation and Objectives
All the applications developed for SC gather a suitable amount of data. This creates the opportu-nity to analyse how can this data play an important role for their user. Therefore, the main goals for this work are:
• To study what information is relevant to the user • Understand the context of this information
• Show the data in a simple and meaningful way, centered around the user
• Study and understand how and when we can show the information so that it has the maxi-mum meaning for the user
To accomplish these goals the project followed a User-Centered Design methodology where we studied the best way to show the information to the users. The users were involved at all times from requirements gathering to prototyping and finally testing the implemented solutions.
The outcome of this project was a prototype of an Android application which will allow the user to get the most critical information at a glance depending on their context. By simplifying their decision making process we expect to identify an improvement in the way seniors rely on technology in their day-to-day life.
1.3
Document Structure
This document is structured in 6 chapters. Chapter 1 introduces the context of this research, as well as its background, goals and contribution, and this section outlining the structure of the document.
Chapter 2 presents the literature review, showing some of the older adult’s problems such as the age-related changes. Then it also presents the challenges of designing to seniors. We also discuss potential formats of displaying information and some examples are presented and discussed.
Chapter 3 presents the methodology used in the development of this project to design an application suitable for the older adults; and a review of the novel devices concerning HCI.
The fourth chapter (4) contains the solution proposal and all the steps that lead to the conclu-sion of this project. Chapter 5presents the final validation conducted with the users and discusses the overall research process. Furthermore, it presents some lessons learned from working with seniors as well as some lessons learned throughout this thesis development.
Lastly, chapter 6reflects on the conclusions of our work identifying some improvements that can be object of future research.
Background and State of the Art
With aging, many changes start to appear. Some are visible, such as changes at the physical level but others are not such as the decrease at the cognitive level. Moreover, all of these changes will ultimately affect senior ’s self-esteem and ability to be independent in performing essential activities. This chapter is intended to give an overview of the changes that are related to aging. It is also given an overview of the topic of mobile information visualization and the challenges related to senior designing. Additionally, this chapter presents some examples of design projects of three different ways to processed and present information to the user so he can take more informed decisions such as personal assistants (PA), dashboards, and trackers for the mainstream audience and in specific for seniors. After understanding of what this three main at-a-glance views of information consist of we will decide which is more appropriate for the context of this application.
2.1
Age-related changes
Older adults in most developed countries are defined as people of 65 or more years old. However, there is no general agreement on the age at which a person becomes classified as old [WHO16]. In high-resource countries, older age is defined in relation to retirement from paid employment, at 60 or 65 years. As people grow older, many changes start to appear. Society’s view of “old age” has not always been accurate with the truth. There are many myths surrounding aging, however often these myths are incorrect. One common belief is that an old person cannot learn a new skill later in life, but the reality is that, even though it might take longer than younger adults, everyone is always capable of learning new skills regardless of age. Another common belief is that mental diseases such as depression and dementia are a normal part of aging. However, most older adults are found to have lower rates of diagnosable depression compared with younger adults, and successfully adjust to the challenges of aging, living happy and productive lives. This can be explained by the fact that as people age they tend to concentrate on the most satisfying and humanly rich relationships striving for an emotional balance (managing their affective states and
avoiding sadness or anxiety) [Cou06]. Nevertheless, the majority of older adults do experience regular, age-related changes which may affect their lifestyle. These changes can be divided into three categories: cognitive, perceptual and psychosocial.
2.1.1 Cognitive Changes
Just as age-related changes in general, cognitive changes are not uniform across all cognitive domains or all older individuals. The most affected cognitive changes are attention and memory, with evidence suggesting that even though some aspects of attention and memory are maintained with aging others show a significant decline. Higher-level cognitive functions such as language processing and decision making may also be affected by age. [oM15] The greatest declines with age are in the domain of attention, working memory (also known as short-term memory), long-term Memory, speech and language, and lastly decision making and executive control [Gli07].
Some form of attention is involved in virtually all these cognitive domains. Declines in atten-tion make the execuatten-tion of tasks that are not regular or automatic, such as learning and making a decision, a lot more complicated[MRM+10]. The working memory can be defined as the ability to store, focus attention on, and manipulating information for a relatively short period of time. With aging the process of encoding, storing and retrieving information, tends to get slower, which ends up affecting the ability to learn new information, and ultimately the power to perform everyday tasks [EVL+16]. Furthermore, with aging signs losses in long-term memory start to appear in something called the episodic memory, which is the ability to remember specific events or experi-ences that happened in the past. Even though most older adults believe they have a better capacity to remember remote events than recent ones, the reality is that they end up only retaining the core information about the event but lacking the details, the spatial and temporal context. This affects their capacity to remember the context or source of information: where and when something was heard or read, or even whether something happened or was just thought about (what is called “re-ality monitoring”) [MRM+10]. Regarding perception, most older adults face a decrease in their sensory and perceptual abilities, causing essential implications in their everyday lives.
Sometimes when connections between ideas are not made explicit, older adults can have dif-ficulties understanding words and images [Rid07]. So, complex interfaces that require the user to find buttons or other elements in the display became a hazardous activity. So, interfaces, where they are faced with the need to find buttons or other elements in the display, became a hazardous activity. Older adults also have difficulties distinguishing essential from non-important informa-tion, and increasing the number of distraction will only cause them to get more confused and overwhelmed. Speech and language processing is mostly intact in older adults under normal con-ditions, although processing time may be somewhat slower than in young adults. Older adults also show a more extensive vocabulary [Rid07]. When making decisions seniors tend to rely on prior knowledge about the domain in question and less on new information, contrary to younger people [MRM+10]. They also tend to rely on experts’ opinions more than young adults, possibly because of working memory limitations.
2.1.2 Perceptual Changes
At the perceptual level, according to the American Phycological Association [Ame17], most of the physical changes that appear in older adults are related to vision, earing, physical abilities and reactions that tend to get slower.
The leading visual changes among aging adults result in difficulties such as slower reading speed and reading the small print and in dim light, as well as difficulty while driving at night. [Ows11] According to the American Psychological Association [Ame17], hearing impairment among older adults is widespread. However, it is often mild or moderate. Regarding physical and reaction abilities most older adults have slower reactions needing more time to respond to alterations in the environment once those are detected. [Ame17]. So, it is crucial to implement interfaces that give the user enough time to slowly and clearly understand what should be done and in what manner small targets and moving interface elements are challenging for older people and should be avoided [WNDP07].
2.1.3 Psychosocial Changes
The American Psychological Association [Ame17] mentioned that one in four older adults ex-perience some kind of mental health problem. It points on dementia as an essential psychosocial change that affects 5% of individuals between 71 and 79, and 37% of the population above the age of 90. People with dementia are also prone to suffer from other mental diseases such as depression, anxiety, and paranoia, leading to impairment in social function. The APA defines de-pression as a collective and severe medical illness that negatively affects how one feels, the way one thinks and acts. It is identified by feelings of sadness, sense of loss, burden, and helplessness. In older people, but not only, causes are mainly the loss of their loved ones or their new limitations [Ame17,BEVh+14]. When depressed, older adults tend to avoid mingling with their relatives and friends, isolating themselves in their own houses. For many people, regular exercise helps create a positive feeling and improve mood. Getting enough quality sleep on a regular basis, eating a healthy diet and talking to other people can help reduce symptoms of depression [Ame17]. So, when designing a product these factors should be considered.
2.1.4 Interaction with Technology
It is a common belief that older adults do not know how to use ICTs, have a disinterest in them and don’t want to learn about them [GASZ15]. However, this is nothing but a myth, according to the APA, older adults are capable of learning new skills, though they will take longer to learn them [Ame17]. Older adults have quite a considerable interest in learning about and using new ICTs (especially mobile phones), but the very little adaption of these technologies to their needs and the high prices are considerable barriers for broader use. [GFL+10] According to Rice and Katz [Hoc03] and Castells et al., [SR07] the use of ICTs among seniors varies based on different social factors, such as social class, education, gender, country of origin, belonging to subcultural groups, and place of residence. It might have a direct or indirect influence on people’s manner to use ITCs
and their experiences using mobile ITCs. Gascón et al. [GASZ15] conducted a research with the aim to understand whether and how age influences the abilities to use, the uses and perceptions of, and the experiences with newest applications (ICTs) and what are their needs regarding these tech-nologies. Richard Ling [Lin08] and also Ling and Thrane [LT02] have proved that the difference in the way older adults perceive technology has to do with the social meaning of different forms of communication. For example: while “younger elderly have a much more familiar relationship to the mobile telephone” [Lin08] and may use short messaging as a means to communicate, older elders avoid it. An explanation may lay in the fact that they do not understand the need to use a limited written format to communicate when there is an option to call. With the increased usage of computers, this social group could significantly benefit from these high-tech products, and their social interaction, healthcare and education could potentially be enhanced. However, such devices are far from being designed to their needs. In the hardware domain, most devices (e.g., keyboards, printers, speakers, smartphones, etc.) have tiny buttons making it difficult to see and manipulate by seniors. Furthermore, software applications usually demand a steep learning curve making it challenging to learn for an older person compared to a younger one. Wagner and Hassanein point out reasons, as to why older adults are not interested in using computers or the internet [WHH10]:
• The costs of technology
• Barriers due to physical limitations • Lack of knowledge
• Lack of interest or motivation • Lack of understanding the benefits
Seniors’ emotions towards applications can influence their perception of its usefulness and their evaluation of it. Negative emotions regarding an application could make the user feel inca-pable, ashamed, or angry and that might create a more negative attitude to similar technologies [GASZ15]. Declines in working memory may make it difficult for seniors to understand new concepts or recall complex procedures. Declines in attention may also complicate tasks where a constant change in focus between several displays of information is needed. In a study conducted by Gregor and Dickinson [GD07], they noted that, in an accessible and commonly used e-mail client program, Microsoft Outlook, there are 250 possible operations and five panels on the first page! Such large amounts of options can make the user feel overwhelmed when using it, even for advanced users. In this study, 50% of a group of beginner seniors failed to complete basic e-mail tasks. These findings can be seen as a clear call for a better adaption of apps to elders’ special needs at the physical level, such as larger font size; clear, non-ambiguous symbols, at the content level, being adapted to their everyday life needs. By eliminating these complexities, we can open the access, both to seniors and younger people alike, to technology. However, available studies [GASZ15] indicate that seniors are in fact receptive and interested in using computers and, as they become more experienced, their attitude and motivation also increase [CL07]. In a study, they
concluded that elders learned from and with each other and that they felt less ashamed when other elders were teaching them. Nevertheless, their past experiences, and their support when learning new technologies can be determinant factors for their receptivity.
2.2
Mobile information visualization
By the year of 2019, there will be one billion more mobile phone users worldwide than in the year of 2017, and this number is expected to grow even more in the future [staa,stab]. However, mobile phones still have many constraints such as limited screen size, limited input capabilities (e.g., small keyboard), constraints in the physical environment (e.g., noisy location, awkward position of use), and these are not only constraints for users but for developers too.
Nowadays, information visualization technology evolved from an advanced research topic to general acceptance for both commercial and personal use.
The primary purpose of this technology is to efficiently give to the user the mental models of the information [AEYN11] on the domain he is analyzing, as easier as possible. It can be defined as a mental image or visual representation of an object or scene that is similar to visual perception. This powerful tool can be used for different cognitive processes such as explore, analyze, discover and communicate information in a well understandable form, with a significant insight into the information. Many visualization techniques are available to use in different situations to deliver different levels of understanding to the user [Spe14] to interpret vast and complex amounts of information.
When designing a product, visualization of information will depend on many factors, such as what kind of information, its representation in a specific information space, and the specific task or goal of a user. According to Chittaro [Chi06], there are six different steps to follow to aim for precise and error-free design:
• Mapping — which is related to how to visualize and encode information in a visual way. A good mapping produces an exact visual representation. It can be achieved when there is an accurate relationship between data objects and visual objects. It is only possible with a well-defined algorithm.
• Selection — It is associated with the process of selecting the data needed for the given task or job. Selection is one of the most crucial tasks because the wrong selecting of data can mislead the user in important decisions and create negative consequences and losses (financial, time). The inclusion of unnecessary data should be avoided at all costs.
• Presentation — it is the process of managing and organizing the information in the space available in an efficient way.
• Interactivity — It relates to the abilities to organize, explore and rearrange the visualization. Good interactivity enables the user to explore and understand the information in the best way.
• Usability — It involves adaptation and accessibility factors making the visualization easy to use by the end users but also by people with special needs.
• Evaluation — Evaluation is also an important step when creating a visualization interface. It will allow determining if the goals were achieved or not and how effective is the visual-ization interface.
However, creating the perfect visualization method is a significant challenge to fulfill all the user requirements. The most critical issues for visualization is usability that is defined by how easy it is to use the product and how efficient it can be. It is also necessary to understand the user and his perceptual, cognitive tasks, and have prior knowledge about the methods and how to operate with it. Information visualization itself is much more difficult than scientific visualization and includes many unsolved problems [TC09]. There is no accepted answer to which visual representation is more suitable for the kind of information under consideration for a specific goal. In addition, one of the most significant problems with mobile devices is their screen since it is much smaller than a computer. Moreover, making insight of data visually appealing to the user is essential. The aesthetics are very difficult to maintain and a big challenge for visualization engineers since aesthetic is defined as a philosophical theory that deals with the beauty and taste, which are very subjective.
In this project, the chosen methodology is a more general model of software creation where we will start by identifying the characteristics of the users’ life to understand what aspects of the design are more likely to be barriers for the users – such as using too much text or having too many movements. Afterward, we will look at the goal of the system to improve the user experience and be creative about how SC can improve seniors’ lives. So we can understand which is the best way for users to interact with our system, meaning which is the best modality or combinations of modalities to be adopted in SC.
In the context of human-computer interaction, modality is a particular mode in which some-thing is experienced, on a sensory level. Modality is an approach where communication and representation are more than about language. It is the input/output between a computer and a human. [KASA08] And a system can be unimodal if only has one modality or multimodal if it has more than one modality implemented. Multimodalities tend to be used to provide more intu-itive ways of integration between the system and the user. Multimodalities are divided between modalities computer-human and human-computer depending if they are used to send information from the machine to the user or the other way around. When designing for seniors, their char-acteristics play an enormous role when deciding which are the more suitable modalities to use [HM06,MS17,TC09].
According to Pak and McLaughlin [CL07] there are some general guidelines that we can follow to attend some of these users needs such as: allowing for sufficient time in inputs, guiding or limiting movement for users with motor control deficiencies, simplifying features, by reducing the number of features, renaming features so they can meet their function, not the companies
name. An example of this is "Microsoft Excel" that can be confusing when the users search for the product on their computer.
Another thing to be aware is to preferably use words compared to images and icons since these can be confusing for the user, and increasing the target size and providing accurate targeting devices. Moreover, offering feedback (through audio, vision or touch) or combinations of them, preferably matching their intensity to the environment of the user. Combinations of multimodal-ities, such as visual and audible displays of information, can be used to complement each other and help the users with sensory limitations. For users with some problems of cognitive attention, multiple modalities can help them to switch between different tasks. For example: when a user is typing a list of groceries and can say something like "remind me to call daughter" the software will create a reminder to call her daughter, and when she is finished creating the groceries list it will notify the user [HM06,MS17].
An application that can change from a graphical and audible display to speech displays can be beneficial to users with perception deficiencies. For users with motor limitations, a display with fewer movements and more clicks on the screen can be beneficial. Some users may also have difficulties when articulating words which can be a problem for systems that depend on speech to work, so making them speech free can improve this users interaction with the system. Lastly, systems that can provide the user with easy access to chats and reminders to call their loved one are also necessary [HM06,MS17].
Some of the formats in which the information can be organized and presented to the user and also some examples of applications are treated in the next sections.
2.3
Mobile personal assistants, dashboards and trackers
With this project, we aim to create a system that will complement the application already on the market. The idea behind the system is to use the information SC already has about the usage that the elderly make of their smartphones and show it to the user and to assist him with difficulties that he might have throughout the day. Since this project aims at the same time to assist the user, by providing him with the best information available in different contexts. One of the most used ways to display information is through the use of dashboards. Trackers are also valuable when our main goal is to record information about the user. A last method that is being widely used is through personal assistants. In the next section we will explain what these methods are, and what we can learn from them.
2.4
Related projects
Over the years many applications have been built using different multimodalities available in mo-bile devices. These applications can vary in the way they present the information to the user, such as Personal Assistants, Dashboards, and Trackers.
Personal assistants are software agents used to perform tasks or services for the users. They are sometimes, also referred to as chatbots and are very useful for treating information to be shown to the user. Personal Assistants make use of different modalities such as Text, Voice or Image. They interpreted the information the users want to access to, perform the activities related to such tasks and show it to the user in the best way possible, taking control of the interface. An example of this is when the user asks the device for the next events in his calendar, and the PA understands this request, searches the calendar and then replies to the user with a list of scheduled events [PMPN11]. A survey conducted in May of 2017 showed that the biggest used personal assistants are Apple’s Siri with 34% of users followed by Google Assistant with 19% of users in the US [Gra17].
Despite all the apparent benefits of using personal assistants, according to a study [Dis] made in the United States in 2017 the most significant dangers of the increasing popularity of virtual as-sistants are the difficulty in increasing human contact and our everyday life becoming less private. This leaves one thinking that when developing a contextually based system, we should always promote human contact and security above all.
Another useful way to deliver information to users is by using Dashboards. They are gener-ically a visual display of the most critical information that the users need to fulfill his goals. It is arranged to show on a single screen all the information that can be monitored at a glance. Be-cause the available information can be so different from each other, before they are shown to the user they are treated, meaning that they are abbreviated to summaries and exceptions. So the user can quickly see which information needs attention and may require some action. To get the full information dashboards to make use of navigational models. They assemble concise, clear and intuitive display mechanisms. They are usually customizable and when information is of extreme importance they can alert the user so he can take actions as fast as possible. Making dashboards so valuable nowadays. There is no longer needed to seek and examine the data so exhaustively because all the information is gathered in only one screen [Few06]. By making use of dashboards we would be able to recreate scenarios of use that the elderly make of their smartphones and learn from it. To help them achieve their goals. Dashboards, when presented to the users, could help them feel more motivated throughout their day, identify patterns and help them end them, for ex-ample: showing the user that the longer he stays at home, the sadder he will feel and less motivated to do something, and suggesting him to go outside for a change.
Another method to deliver information to users is trackers. These systems are used to log the users’ information, such as the locations he has been. They only display the information to the users [WMY08,trc]. This method of displaying information could help the user remembering old trips he has been to, or help them navigate and prevent them from getting lost.
By combining these three methods, we could create a system that would assist older adults in their everyday life. We can track and monitor users information (such as locations, heart rate, messages, events, etc.), treat this information and making use of it to assist older adults in their everyday life and help them delay the effects of aging. Also, lastly, create dashboards with the aggregated information that could be used by them and by their caregiver in the future.
2.4.1 For the mainstream audience
Personal Assistants have become widely available commercially, especially in mobile form, with recent reports of increased market interest in their adoption by older adults. Most commercially available personal assistants are limited in their multimodal capabilities, typically offering a com-bination of touch and speech input [HM06,MS17]. The most significant examples for the general audience are Siri, developed by Apple Inc., Echo, developed by Amazon Inc. and lastly Google Now, developed by Google Inc.
As for dashboards some of the applications available in the market are Morning for iPad, an application that gives the user easy access to information such as upcoming events, weather forecasts, to-dos for the day and it is customizable. For Android, the most significant example is Google Now that gives the user quick access to all the information available on his Google account.
For tracking of information some examples are the fitness applications available such as Google Fit, that also has integration with some wearables to track the heart rate. In addiction, Google Maps that tracks the location of the device at all times.
Smart Companion in a way does some of this functionalities. However, it could take advantage of even more information and cross-link them together to assist users and predict what information they will need at different times of day and different locations.
2.4.2 For seniors
For seniors, some examples of applications are the iCare that is a mobile health monitoring system. It makes use of the mobile device and body sensors to track the users. It also monitors emergency situations that in this case, they alert preassigned people of what is happening. It also offers medical guidance to the elders. This application is part of the domain of health-care that according to Rodriguez et al. [RGI05] is divided into three groups: applications that record signals and take action off-line, apps that make remote time processing and lastly apps that provide local real-time processing and take into account the levels of mobility. iCare also plays a role as a living assistant, by including activities such as regular reminders, quick alarms, etc. This application is mostly based on a touch interface.
As a different example of a project developed for seniors, there is Brian. An assistive interac-tive robot that assists adults in their daily tasks. It has a multisensor system with a speech-based interface, and it also shows some emotions through gestures, which induces the user to engage more in the interaction. As examples of personal assistants, there are some applications such as vAssist a European research project funded by the Ambient Assisted Living Joint Program. It is a multilingual voice controlled service for seniors with chronic diseases. Its interface is mostly based on speech interaction.
As a final example that aims to provide a sense of connection between the elders and their loved one, there is InTouch. It provides real-time video communication and photo and text messaging. The curious fact about this application is that it is entirely text free. Making use of only icons,
swipe gestures, and voice message input. Which is beneficial for seniors that don’t feel very comfortable using smartphones since the interface and methods to communicate will not be so confusing to them.
Methodology
Sharp, Rogers, and Preece in their book [SRP07] define HCI as the job of designing interactive products to support people in their every day and working lives. Interaction is in everything that surrounds us, from the most basic thing as using our tv to the most complicated ones such as mobile phones. However, when some of these products are being developed, they are developed from an engineering perspective where the most important aspect is if the product works or not. One significant example of this perspective of development was the error message that was shown to the users when they tried to run too many programs at the same time on Windows, where the message merely said: “Ran out of memory while trying to allocate 0 bytes”. An incomprehensible message for a typical user. With the evolution of technology, its complexity is also growing, making it “worthless unless they can be used properly by men,” as Karray et al. said [KASA08]. As developers, we must talk to the actual users that will use the product at the end of the day.
When designing a product, we should take into account two terms: functionality and usability [TCZ05]. Being the functionality of a system the features of the system, what it can do. Usability is defined as the degree in which a system is efficiently and accurately used by a user to complete a specific task. It is crucial to understand that when designing a product, a golden rule must be followed: the users must be involved in the design process [DFAB03]. It is no longer enough that products have a rich amount of functionality. It is also fundamental that users will be able to efficiently use it. To create an adequate product that meets the characteristics of the users, a Human-Computer Interaction (HCI) methodology was followed. HCI is defined as the ¨discipline concerned with the design, evaluation, and implementation of interactive computing systems for human use and with the study of major phenomena surrounding them [SIG,HBC+92].
HCI should not be seen as equivalent to testing, to check whether people can use the system and fixing problems, but rather a field that allows us to make sure they can use it from the begin-ning. In HCI it is necessary to consider several aspects such as the user requirements and their characteristics when using the system, recognizing the importance of functionality and usability in
the system [DFAB03]. When interacting with a system the levels of activities involved between the user and the machine can be divided into three [KASA08] different aspects:
1. The physical aspect is related to the mechanics of interaction between human and computer, 2. The cognitive aspect is associated with the way users can understand the system and interact
with it and
3. The affective aspect tries to make the interaction a pleasurable experience for the user and change the attitude of the user in a way that he will continue to use the system.
Also, this should be thoroughly thought when developing a system [KASA08]. By considering these aspects, we intend to build a product that has in consideration senior’s characteristics and provide them an app to improve their daily lives.
3.1
User-Centered Design
The main approaches of HCI in the software development are Usability Engineering (UE), Partic-ipatory Design (PD) and User-Centered Design (UCD) [GLB99,MNAA12].
The UE methodology has as a central concern the evaluation of the usability of the software. Faulkner [FC00] defines it, as being an approach that involves the users from the start, in the development of software systems, and guarantees the efficacy of the product with a set of usability specification and metrics. There are three types of usability evaluation depending on the evalua-tion itself. The first, name exploratory evaluaevalua-tion is done before the interface development. It is followed by the formative evaluation during the development of the interface and lastly, the sum-mative evaluation after the interface development is finished. These concepts are associated with the definition given by Seffah and Metzker [SM08] that the UE method is a software development method prioritizing the usability of the system developed.
Participatory Design (PD), initially co-operative design, now often co-design, is a method that attempts to actively involve all stakeholders in the design process to help ensure that the result meets their needs. It is important because most of the knowledge of the application area is only accessible to the end users. The concept of PD is embracing the users in the development process so the requirements and needs of the user can be achieved without discussions about the system characteristics, using prototypes to simulate and test the system [Kyn91].
In this project, the design methodology chosen to be followed was a combination of User-Centered Design (also known as Human-User-Centered Design) with Participatory Design. UCD was first introduced in a book by Norman and Draper [ND86]. Contrary to PD, in UCD methodology the product is developed considering the user, however, he is not a member of the designer team. This methodology emphasizes the user’s needs by including him in as many steps of the design and evaluation process as possible, from the requirements gathering in the development phase, to the final use of the system.
Norman and Draper define UCD as an ideology based on the needs and interests of the users, which will make use of the system, making it usable and understandable. In this methodology, a lot of information and analysis is conducted to understand the characteristics, needs and different types of interaction of the users that will influence the system’s design [HRRS08].
According to the ISO 13407 a UCD project involves four essential activities:
• Requirements gathering — To understand and specify the context for use
• Requirements specification — To specify the user and organizational requirements
• Design —Where we produce designs and prototypes
• Evaluation — Where we evaluate the designs against requirements
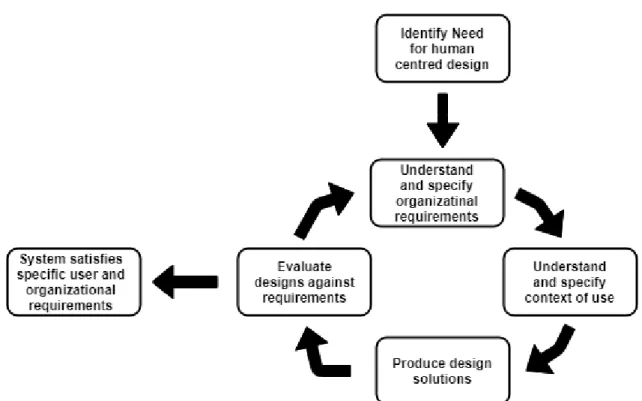
These steps should be planned and executed to incorporate usability requirements into the development process. In this approach the users should always be present, focusing intensely on understanding their characteristics and needs, context and goals to deliver a solution that meets every requirement. This project followed the UCD method phases and, as a first step, user research about older adults was made. This was followed by an informal interview with the target audience of this project. As a second stage, a transcription of the interviews was made followed by card sorting sessions with users. Based on the results of these two phases, a prototype was created with the help of the users. This is where the PD method was incorporated with the UCD, since users helped and co-designed the system. Also, as a final step, the created prototypes were tested and changed according to user feedback. The next diagram describes how these phases were planned to happen.
Figure 3.1: ISO 9241-210:2010 for User-centered design methodology
1. Identification for the need of a human centred design –– The characteristics of this social group and research made in this topic are sufficient to understand the need for this method-ology
2. Understand and specify organizational requirements –– The requirements were defined with the users
3. Understand and specify the context of use –– Analysing the results from the previous phase, helped to assess which informations are most important to show depending on re-quirements.
4. Produce design solutions –– In this phase, in collaboration with the participants in this project, a prototype for the design was created to the target audience to have a positive impact in their life.
5. Evaluation of design against requirements –– Prototypes for the designed android appli-cation were co-designed and tested with the users to ensure the project is considering the needs and characteristics of the end-users.
6. Final Evaluation –– One final evaluation was made to the prototypes making sure all their functionalities and proposed goals are guaranteed.
3.2
Specifying the Context of Use
The first step of an UCD process is to understand the user, its characteristics, their problems with the system, the tasks that they will perform and the environment in which users will use it [SRP07]. It is also essential to understand their level of experience, needs that are not being met by the current system and which are their frequent or desired tasks. For this initial stage, we started by making user research, based on literature analysis, and informal interviews with users and caretakers. Some information was also gathered from other sources, that did not involve the user directly, such as reports from public sources and books specialized in these types of users. With data collected from these methods, we were able to reveal patterns and trends to create new ideas, to incrementally improve the product experience for the users and to measure success with users. The output of these steps of the UCD method is a description of the user with rich detail to allow the designer or evaluator to understand the user’s capabilities and limitations better. The two traditional ways to do structure this information is through user profiles and personas. In the following section, an explanation is given on some of the techniques that could have been used and some that were used in the specification of the context of use.
3.2.1 Questionnaires
One approach we could have used was to ask the users a predefined set of written or oral questions. Questionnaires can have multiple choice questions or open text questions where users can add their personal comment. It is generally used to understand users needs but also to test the services in the end. Questionnaires have the benefit [Adv,MD95] of being cost and time efficient since the candidates can respond at their one time. Anonymity is also a big plus for this method since it allows responses to maintain their anonymity and the users can be more comfortable answering certain questions. There is also the likelihood of a high return rate since they can be sent to multiple users and lastly, all topics are covered. However, it has some disadvantages too, such as dishonesty, different understanding and interpretation, with all emotions (facial expressions and overall body language) and reactions lost. Some questions can be difficult to understand and analyse. In the case of this project, the biggest downside is accessibility so the methodology ended up by not being used.
3.2.2 Interviews
Another approach to understand the user in order to specify the context in which the application will be used can be through a conversation with a purpose talking with the users one at a time, with the help of an interviewer. A set of questions and tasks with different levels of technology experience were prepared for the user, allowing us to get to know in detail the users’ point of view and to understand their everyday life, their activities, what kind of conversations they usually have and with whom, and their main problems. Interviews can be broadly classified as structured, unstructured or semistructured [SRP07] depending on how strict the interviewer is to stick to the
prepared set of questions. In this project we will use semistructured interviews, that allow for the interviewer to ignore the set of questions when the topic that the interviewed is talking is of inter-est but was not on the set of quinter-estions prepared. Another advantage of semi-structured interviews is that they provide with both quantitative and qualitative data. [BCC15] Interviews compared to Focus Groups have the benefit of allowing to collect more detail about the individual experience, marking different questions as follow-ups depending on the answers and pairing them with obser-vations of the task. Even though this method as a drawback since it takes some additional time to analyze. Following the interviews some time was taken to do the transcript of the meeting and to examine which information could be taken from it. After balancing the advantages and disadvan-tages of this method we opted to follow it since we were looking for a more individual insight into the users life.
3.2.3 User Profiles
Are presented in a tabular form and serve to remind the design and evaluation team of the the users specific needs. It illustrates their capabilities, limitations, needs, and motivations. Accord-ing to Kuniavsky [GKM12] some of the categories that should be present are: demographics (age, gender, etc.), level and type of experience, environment in which they typically use the system, lifestyle, roles (responsibility), goals regarding the product (long and short term), needs and wants, and lastly the tasks (main low-level tasks the users accomplishes with the product). User Profiles are specially important when recruiting new participants for usability testing sessions and inter-views.
3.2.4 Personas
Personas are a fictional characterization of a user and help to make the users seem more real in through the design process. They are similar to a profile on a social media platform where the "user" has a name, an image, a background associated with her and their information. It represents a user in a group of users and is created based on complex user data. They put a name, face, and characteristics on users to keep the users in the forefront of design decisions. They are represented in a format that is meaningful and creates empathy among the development team. They range from a paragraph to a full page with specific information (characteristics, demographics, and experience levels) from a user profile. Further information in personas is personal details such as behaviors, attitudes, motivations, and goals [FCR+09]. This helps designers and evaluators to have realistic ideas of users through the design process, from meetings, cognitive walk-throughs, storyboarding, role-playing to other user research activities. They also help new team members to quickly understand the end user. However, when creating a persona, there are a few risks one should be aware of [BCC15]. Firstly while generalizing data about the users to create a persona some information is lost, we can miss out the exception cases that can be important. When recruiting based on personas some valid users can end-up by being excluded. Thirdly they must be updated at all times to reflect the changes that users needs might face over time. Lastly
they should never replace ongoing user research. Personas were used in this project as inspiration for the development process.
3.3
Specifying the User Requirements
Following the context of use, the user requirements were gathered. Preece et al. [SRP07] define a requirement as a statement that specifies what an intended product should do and how it should work, which is remarkable given the fact that we need to know how the application could have a positive impact on the seniors’ lives. In this section, we will present some methods, their primary goals and how we could use them to gather information to establish the user requirements. 3.3.1 User observations
User Observation consist of literally observing how users act in the environment where the appli-cation will be used. It is essential to spend time with users without disturbing them to keep the context as natural as possible. The results collected by this method can contribute to the initial de-sign specifications, reducing the iterations required for the last dede-sign evaluation. As benefits, this method can contribute considerably to initial design specifications and usually reduce the number of iterations required for usability testing. This method was not followed since, considering the objectives of the project (presented in section1.2it would make sense to use it.
3.3.2 Focus groups
In this methodology we encourage a group of older adults to share their thoughts, feelings, atti-tudes, and ideas about the application. The results gathered using this method can be used later in usability tests [RCC+02]. The value of this method is the depth of the discussions that can come from it. Generally, when people hear others responses to questions they start discussing the topic among themselves. In this structured interviews, the users should not know each other well and a list of topics to cover should be present. The group should have as much diversity as possible. When applying this methodology with seniors some drawbacks can be encountered. By its nature, focus group research is not fully confidential or anonymous, since the information is shared among others in the group. Since some of the elders used in this study their privacy has already been com-promised by living in a group setting, sharing some of their opinions could result in loss of respect among their peers. And from what was observed during the interviews, where seniors would ask for opinion in their responses, a big disadvantage would be that the participants’ responses could not be independent of one another which could lead to the generalization of results.
3.3.3 Scenarios
According to Baxter, Courage and Caine [BCC15] scenarios are a story that describes how a persona completes a task or behaves in a given situation. It helps to bring the users to life and to test the product to see if it meets the requirements and lastly it helps to create tasks that can
be used for usability tests. In order to create a scenario there are some things that are necessary to define, such as who is the individual user (or persona), the task itself, what is the desired outcome for the task, procedure and task flow, a time interval and lastly which are the envisioned features/functionalities that the user will need in the future.
3.4
Iterative and Incremental Prototyping
After collecting all the user’s requirements, it was time to start designing the prototypes for the application. The first prototypes should meet the user’s requirements and were later tested by the users to check if all requirements were met. A prototype is the materialization of an idea in a simple model, to be discussed between designers and stakeholders and developed if approved. Prototypes are good for early validations and validation of ideas between designer. They should be created using simple materials like paper, soaps, and cards [SIG]. Prototyping also helps the designer to identify the problems, to improve in future versions and also encourages them to reflect about the product. It relies on a collaboration between researcher and users, and on thoughtful conversations and close observation.
There are two main types of prototypes:
• Low-fidelity prototypes: used for quick and early design. They usually are sketches, mock-ups, PowerPoint presentations, storyboards, etc. They have a little or none interactive func-tionality. The most crucial purpose of low-fidelity prototypes is to verify and test function-ality rather. The visual appearance of the product is refined later [Mur18].
• High-fidelity prototypes: are more elaborative and take longer to be built and changed. However, they provide a look and feel of the final product and can be static HTML, flash prototypes, switchable photo gallery, etc.
In this project, we will opted to create low-fidelity prototypes using paper, and software pro-totypes. They were a way to obtain quick feedback about how a users engages with an interface during the execution of a task.
Prototypes can be implemented in several ways and following we will present the methods used:
3.4.1 Card Sorting
Cardsorting is a method for suggesting intuitive concepts. It is a quick, inexpensive, and reliable method, which serves as input into your information design process. There are two types of card sorting [BCC15] close and open card sorting, depending of the level of freedom given to the users in the cards and categories of information. For the purpose of this project we opt for the closed card sorting since it is more appropriate when we are trying to improve the structural design of shared information of an existing product. A user is presented with an unsorted pack of index cards with information to sort into categories that make sense to them [Sti]. The participant was
asked to sort these cards into groups. The results of multiple individual sorts were then combined and analyzed statistically. All cards used were physical so no other barrier is added for the users. In this project, this method was used to decide some of the interface content according to older adults’ preferences.
3.4.2 WireFrames
WireFrames are a visual guide that represents the skeletal framework of a user interface, like a web page, a screen or dialog box. It provides the general layout of the controls, graphics, and text of the user interface and some provide a description of the task flow of the application [usa].
This method was used to complement the paper prototypes so the users could understand some prototypes more easily. The clickable wireframe was created using the tool Quant-UX [qua]. With this tool ideas are transformed easily into dynamic prototypes, where the user can click and navigate between screens.
3.4.3 Mockups
Mockups are used so designers can collect feedback about the design or ideas in the early stages of the design process. Made of cardboard, soap or other low-fidelity materials. It relies on the user’s imagination that the product works so he can provide with valuable feedback on functionality, usability, and understandability of the basic idea of the product. It has many benefits such as inciting criticism from users given their low-cost. Given their informal materials, the user and designer can collectively improve the design using familiar tools. It also helps the discussion among team members. It enables usability testing at the beginning of the development process [moc]. Lastly it focuses on content and functionality and ignores details of graphic design. For all these reasons we opted to create paper prototypes that were later validated by the user.
3.5
Evaluating the Design
After each development iteration, there is a need to evaluate the designed solution. In this process, the participants performed one usability tests, where they completed specific tasks with the product while being watched by one observer. In this phase of the process some measure could be taken on their time-to-learn a specific function, time-on-task, success rate, how much information they retain over time, their errors and subjective opinion of satisfaction [FRC+09]. However, since the project is in an initial state no measures were taken. According to the International Organization for Standardization (ISO9241-11) the definition for usability testing consists on: “ The extent to which a product can be used by specified users to achieve specified goals with effectiveness, efficiency, and satisfaction in a specified context of use. ”
Effectiveness, efficiency and satisfaction are the three critical measures of usability .Effective-ness and efficiency are related with he value-added part of usability in which the product adds
value to the user meaning it allows the user to achieve his goals faster, easily and most of all bet-ter than the existing products. Lack of efficiency may cause the user to reject a product/feature because he doesn’t see the value in it. Satisfaction is only related with the user’s perception with satisfaction with the product.
Usability evaluations are divided into two groups: formative and summative. [BCC15] For-mative evaluations are done early in the development lifecycle. They are used to give insights and shape the design direction taken, and consist of a set of usability inspection methods or usability tests with low-fidelity prototypes. On the other hand, summative evaluations are typically done at the end of the development life-cycle, and, consist in comparing high-fidelity prototypes or the final product itself against a set of metrics such as time-on-task, success rate, etc.
The techniques to be followed to evaluate the design will be the Wizard of Oz and the Think Aloud Protocol.
3.5.1 Wizard of Oz
The name of this method is based on the famous story of "The Wonderful Wizard of Oz", where an ordinary man hides behind a curtain and pretends to be a powerful wizard (The Wizard of Oz) using sound effects to do so [Mol04]. In this technique, designers simulate reactions of the system with users to study their expectations and specifications [usa]. This method was applied to find out the kinds of obstacles people had with the devices. They can be technical, linguistic or visual. [usa]. This method allied with the paper prototypes was very useful to understand the main problems with the interface.
3.5.2 Think Aloud Protocol
In this second protocol, a test participant thinks aloud while interacting with the product. It can be used to evaluate systems by making use of the paper prototypes [FRC+09]. This approach was used to understand what the older adults thought about each functionality and their reasoning while navigating through the system.
Solution development
After the literature review and methodology definition, there is a need to specify the users’ require-ments and design solutions. This chapter presents an overview of the Smart Companion project, the results from the conducted user research, followed by a detailed presentation of the proposed solution including the iterative design process of the user interfaces. In the end, a comprehensive overview of the final evaluation using high-fidelity prototype is made.
4.1
Smart Companion: an overview
As mentioned before this project is associated with a project developed at Fraunhofer Portugal called Smart Companion (SC).
Smart Companion is an Android customization that was specially designed to address seniors’ requirements and empower older adults to live their lives to the fullest. It replaces the default An-droid Launcher and it tries to be a permanently available companion to support them in their daily activities using numerous tools, from messaging to medication reminder applications. It was de-signed for two users: the seniors and their informal caregivers (children, family, friends). Thanks to its easy interface Smart Companion allows inexperienced users to master general mobile phone features, such as making calls and sending voice and text messages. Other important features are the ability to receive medication reminders and to call the emergency line from the home screen in just one click. However, the most important feature to remark is the fact that SC allows se-niors to have a better experience by allowing them to have a personalized experience by using a customized unlocker, home screen, and settings. It is composed of many applications, such as:
• How are you — application that allows the user to monitor their mental health by enabling them to check in their emotions.
• Questionnaires — application to answer questionnaires related to their physical conditions, feeding habits, a scale of fear of falls and sleeping habits.