Luís Carlos Guimarães Lourenço
Licenciado em Ciências da Engenharia Eletrotécnica e de Computadores
Big data analytics
for intra-logistics process planning
in the automotive sector
Dissertação para obtenção do Grau de Mestre em Engenharia Eletrotécnica e de Computadores
Orientador: Ricardo Luís Rosa Jardim Gonçalves, Professor
Ca-tedrático, Universidade Nova de Lisboa
Co-orientador: Ruben Costa, Professor Auxiliar Convidado,
Universi-dade Nova de Lisboa
Júri
Presidente: Doutor Arnaldo Manuel Guimarães Batista - FCT/UNL
Arguentes: Doutor André Dionísio Bettencourt da Silva Rocha - FCT/UNL
Big data analytics for intra-logistics process planning in the automotive sector
Copyright © Luís Carlos Guimarães Lourenço, Faculty of Sciences and Technology, NOVA University Lisbon.
The Faculty of Sciences and Technology and the NOVA University Lisbon have the right, perpetual and without geographical boundaries, to file and publish this dissertation through printed copies reproduced on paper or on digital form, or by any other means known or that may be invented, and to disseminate through scientific repositories and admit its copying and distribution for non-commercial, educational or research purposes, as long as credit is given to the author and editor.
Este documento foi gerado utilizando o processador (pdf)LATEX, com base no template “novathesis” [1] desenvolvido no Dep. Informática da FCT-NOVA [2]. [1]https://github.com/joaomlourenco/novathesis [2]http://www.di.fct.unl.pt
Ac k n o w l e d g e m e n t s
The conclusion of this project represents the end of a very important chapter of my life and many people deserve to be mentioned.
I would like to thank Professor Ricardo Gonçalves for giving me the opportunity to work on this project.
I would like to thank Professor Ruben Costa for all the guidance provided throughout this dissertation.
The remaining members of the research centre also deserve credit for all the work and insights provided.
A special thanks to Diogo Graça for his mentorship during my internship, and to the entire logistics department in VWAE for all the help provided.
To all my friends and colleagues’ thanks for making this journey easier and happier. Last but not least a very special thanks to my family for all the love and support.
A b s t r a c t
The manufacturing sector is facing an important stage with Industry 4.0. This paradigm shift impulses companies to embrace innovative technologies and to pursuit near-zero fault, near real-time reactivity, better traceability, and more predictability, while working to achieve cheaper product customization.
The scenario presented addresses multiple intra-logistic processes of the automotive fac-tory Volkswagen Autoeuropa, where different situations need to be addressed. The main obstacle is the absence of harmonized and integrated data flows between all stages of the intra-logistic process which leads to inefficiencies. The existence of data silos is heavily contributing to this situation, which makes the planning of intra-logistics processes a challenge.
The objective of the work presented here, is to integrate big data and machine learn-ing technologies over data generated by the several manufacturlearn-ing systems present, and thus support the management and optimisation of warehouse, parts transportation, se-quencing and point-of-fit areas. This will support the creation of a digital twin of the intra-logistics processes. Still, the end goal is to employ deep learning techniques to achieve predictive capabilities, all together with simulation, in order to optimize pro-cesses planning and equipment efficiency.
The work presented on this thesis, is aligned with the European project BOOST 4.0, with the objective to drive big data technologies in manufacturing domain, focusing on the automotive use-case.
R e s u m o
O setor de manufatura enfrenta uma etapa importante com a Indústria 4.0. Esta mu-dança de paradigma impele as empresas a adotar tecnologias inovadoras para atingir falhas quase nulas, reatividade em tempo real, melhor rastreabilidade e previsibilidade, enquanto trabalham para obter uma customização mais barata do produto.
O cenário em estudo aborda vários processos intra-logísticos da fábrica automóvel Volkswa-gen Autoeuropa, onde diferentes situações necessitam melhoramentos. O principal obs-táculo é a ausência de fluxos de dados e integração entre todas as etapas do processo intra-logístico, o que leva a ineficiências. A existência de silos de dados contribui forte-mente para estas situações, o que torna o planeamento de processos um desafio.
O objetivo do trabalho apresentado aqui é integrar tecnologias de big data e machine le-arning nos dados gerados pelos diversos sistemas de produção presentes e, assim, apoiar o gerenciamento e a otimização das áreas de armazém, transporte de peças, sequencia-mento e pontos de aplicação. Esta dissertação apoiará também a criação de um gêmeo digital dos processos intra-logísticos, ainda assim, o objetivo final é empregar técnicas de deep learning para obter capacidades preditivas e juntamente com a simulação otimizar o planeamento de processos e a eficiência de equipamentos.
O trabalho apresentado neste documento está embebido no projeto europeu BOOST 4.0, com o objetivo de impulsionar tecnologias de big data no domínio da manufatura, com foco no setor automóvel.
C o n t e n t s
1 Introduction 1
1.1 Problem Description . . . 3
1.2 Research question and hypothesis . . . 6
1.3 Proposed solution . . . 6
1.4 Methodology . . . 7
1.5 BOOST 4.0 Contributions . . . 9
1.6 Thesis outline . . . 13
2 State of the Art 15 2.1 Machine Learning . . . 15
2.1.1 Predictive techniques . . . 17
2.1.2 LSTM . . . 18
2.2 Big Data Analytics. . . 19
2.2.1 Existing Big Data Technologies . . . 21
2.3 Inventory Management . . . 22
3 Intralogistics Data Analysis 25 3.1 External Transports Data . . . 25
3.2 Receiving Data . . . 26 3.3 Warehousing Data . . . 26 3.4 Transport to Sequencing . . . 27 3.5 Sequencing Data . . . 28 3.6 Transport to POF . . . 28 3.7 POF Data . . . 29
3.8 Inventory Data Analysis . . . 30
4 Architecture 35 4.1 Extract Transform Load layer . . . 35
4.2 Storage layer . . . 37
4.3 Machine learning layer . . . 38
4.4 Processing layer . . . 40
C O N T E N T S
5 Results 45
6 Conclusions and Future work 53
6.1 Conclusions . . . 53
6.2 Future work . . . 54
L i s t o f F i g u r e s
1.1 Industrial revolutions . . . 1
1.2 current operations of the logistics processes . . . 3
1.3 Receiving and warehousing at VWAE . . . 4
1.4 Bahnhof area at VWAE . . . 5
1.5 sequencing and batteries POF at VWAE . . . 5
1.6 Phases of CRISP-DM model . . . 8
1.7 RAMI 4.0 Reference Architecture . . . 10
1.8 Boost 4.0 Architecture . . . 11
1.9 Pilot structure and phases . . . 11
1.10 phase 1 . . . 12
1.11 phase 2 . . . 12
1.12 phase 3 . . . 13
1.13 phase 4 . . . 13
2.1 Structuring of machine learning techniques and algorithms [6] . . . 16
3.1 Daily production first 100 days of 2018 . . . 29
3.2 Inventory levels September 2018 1S0915105A . . . 33
3.3 Inventory levels September 2018 5TA915105B . . . 33
4.1 Architecture overview . . . 36
4.2 DB diagram . . . 38
4.3 Digital Twin connection . . . 41
4.4 receiving dashboard . . . 42 4.5 warehousing dashboard . . . 43 5.1 Error model I1 . . . 46 5.2 Predictions model I . . . 46 5.3 Error model II . . . 47 5.4 Predictions model II. . . 47
5.5 Error model III . . . 48
5.6 Predictions model III . . . 49
L i s t o f F i g u r e s
5.8 Predictions model IV . . . 50
L i s t o f Ta b l e s
3.1 External transport data sample . . . 26
3.2 Receiving data sample . . . 26
3.3 Stock data sample . . . 27
3.4 Internal transport data sample . . . 27
3.5 Sequencing data sample . . . 28
3.6 POF data sample. . . 30
3.7 Inventory analysis VWAE 2018 . . . 32
Ac r o n y m s
ACID Atomicity, Consistency, Isolation, Durability AGV Automated Guided Vehicle
ANN Artificial Neural Network
API Application Programming Interface ARMA Autoregressive Moving Average
BPNN Back-Propagation Neural Network
CPS CyberPhysical System CPU Central Processing Unit
EFNN Enhanced Fuzzy Neural Network ETL Extract, Transform, Load
IDC International Data Corporation IoT Internet of Things
JSON JavaScript Object Notation
KPI Key Performance Indicator
LSTM Long Short-Term Memory
ML Machine Learning MLP Multilayer Perceptron MSE Mean Squared Error
AC R O N Y M S
RDBMS Relational Database Management System RDD Resilient Distributed Dataset
RFID Radio Frequency Identification RNN Recurrent Neural Network
SLA Service-Level Agreement SVM Support Vector Machines
VWAE Volkswagen Autoeuropa
C
h
a
p
t
e
r
1
I n t r o d u c t i o n
We live in times of innovation in all fields, and thanks to constant technological de-velopments, globalization, increasing customer expectations and aggressive markets all through the world, companies, business’s and academics are working to apply these revo-lutionary innovations in our advantage.
In the last few years major advances in technologies like internet of things, big data, cloud computing, artificial intelligence and many others are fuelling a new Industrial revolution and in result of that smart manufacturing is becoming the focus of the global manufacturing transformation.
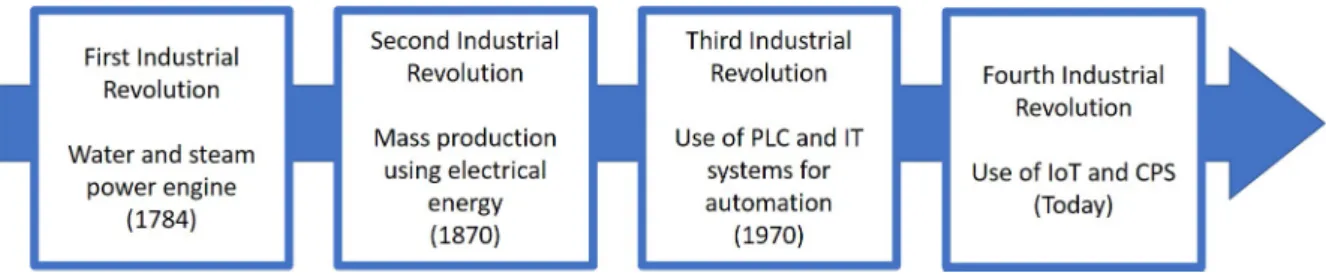
This new revolution is called Industry 4.0 and like in the previous industrial revolutions, technology changed the paradigm, the first one created the mechanization of processes with the steam engine, the second introduced mass production thanks to electricity and the third offered automation due to the introduction of electronic devices. The industrial revolutions and it’s driving technologies are represented in figure 1.1 .
Figure 1.1: Industrial revolutions
Today manufacturing industries are changing from the mass production of the past to customized production to meet the growing customer expectations [1].
C H A P T E R 1 . I N T R O D U C T I O N
past few years, a study by IDC (International Data Corporation) titled “data age 2025” predicts that worldwide data creation will grow to an enormous 163 zettabytes by 2025, that is ten times more than 2017.[2]
This paradigm shift brings a huge amount of data associated that needs to be properly processed in order to achieve the desired outcomes. Integrated analysis for the manufac-turing big data is beneficial to all aspects of manufacmanufac-turing.[3] But not just manufacturing can benefit from data all organizations whether large or small, with a data-dependent business model or not can benefit from a better understanding of its data [4]. Big data analytics is a trending subject that companies from all fields are working into their busi-nesses, and with the value and quantity of data rapidly growing every year, we can expect the trend to continue for multiple years making big data an important field to research nowadays.
In the subject of industry 4.0 a technology that also benefits from data growth is Digital-Twin and is likely to become more relevant over the next decade [5]. Digital twin is a live model useful to gather business insights that can be implemented for a specific asset, for an entire facility or even for an individual product.
The concept of machine learning has been around for decades and now it is more relevant than ever because there is an increasing availability of data and computing power, with fast paced developments in the area of algorithms the applications for machine learning in manufacturing will increase [6].
The combination of machine learning and digital-twin can amplify both technologies benefits, where as digital twin can test the accuracy of the machine learning models and different scenarios suggested by the machine learning layers.
The logistics sector does not escape the trends and some major changes are predicted, in fact, logistics represents an appropriate application area for industry 4.0 and its technolo-gies [7]. Logistics has always been a data driven area of business and now more than ever, with the perspectives of real-time tracking of material and product flows[8], improved transport handling, risk management and other features companies need to prepare their logistics departments for the incoming growth of data. “In fact, one could argue that industry 4.0 in its pure vision can only become reality if logistics is capable of providing production systems with the needed input factors . . . ”[7].
This dissertation is embedded in the VWAE (Volkswagen Autoeuropa) pilot of the biggest European initiative in Big Data for Industry 4.0 called BOOST 4.0. This project is funded by the European union and pretends to lead the construction of the industrial European data space and provide the industrial sector with the necessary tools to obtain the maxi-mum benefit from Big Data.
1 . 1 . P R O B L E M D E S C R I P T I O N
1.1
Problem Description
As previously stated, this dissertation is embedded in the VWAE pilot that deals with im-proving efficiency on intralogistics operations using new digital technologies, developed under the Industry 4.0 paradigm.
To acquire the necessary knowledge about the business, logistics process and general work of the factory an internship for the duration of the work was seen by both parts as a positive measure and the most fruitful way to proceed.
Intralogistics is the process responsible for components flow since the moment they arrive at the factory to the moment they are applied on the final product. The logistics of deliver-ing parts to the assembly line plays a major role in the success of a car manufacturer and consequently, optimizations to the logistics environment reduce substantially production costs.
Within this project, we started by focusing on a single component, in this case car batter-ies because this component goes into every car produced, it is reasonably valuable and easy to track. This process is illustrated by figure 1.2.
Figure 1.2: current operations of the logistics processes
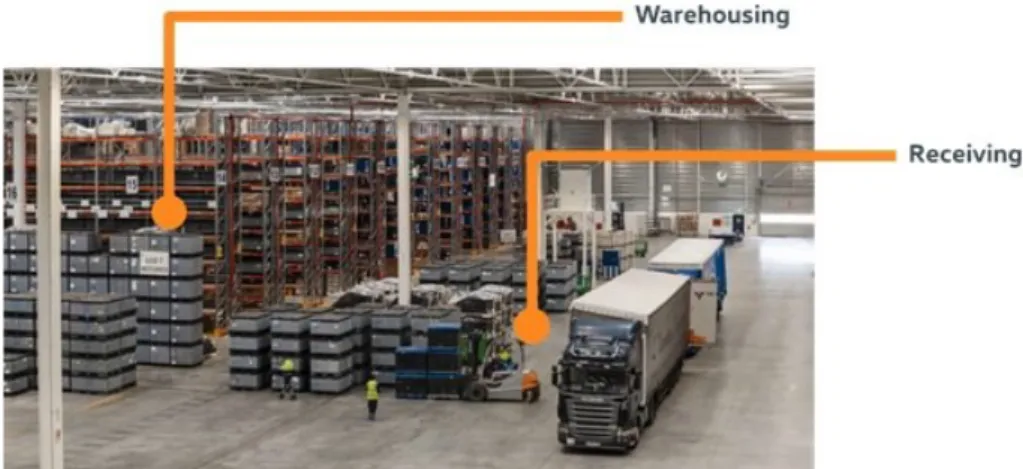
The processes within intra-logistics on VWAE are the following and they are repre-sented in figures 1.3,1.4 and 1.5 [9]:
• Receiving – On the receiving area trucks are traditionally unloaded by a manually forklift operation, and then the unit loads are transported to the warehouse where they will be stored.
• Warehousing – On the warehouse parts are stored either in shelve or block storage concept. System wise there is one database to control the parts coming from each truck and then a separate database, which registers the unloading, transportation and storing of the material in the warehouse.
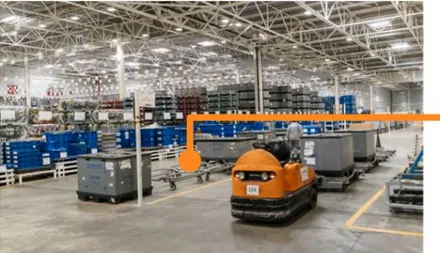
• Transport (to sequencing) - An automatic line feeding system based on real vehicle demands generates parts call offs after interacting with real time stock data to re-plenish the points of use at commissioning areas called SUMA’s, or directly at the
C H A P T E R 1 . I N T R O D U C T I O N
assembly line, for parts that do not require sequencing, using a pull methodology/-concept. The transport is then made by tow trucks, and the record of these internal transports is stored in a different database. In this process there is an area called Bahnof where parts are placed by the warehouse forklifts to wait for transport to the production line or sequencing.
• Sequencing - The next step will be the picking process for the correct sequencing in the SUMA. Here, the operator follows system electronic picking of parts according to the vehicle sequence on the production line. These operations are executed under the principles of the lean production system[10] [11].
• Transport (to point of fit) – The transport from the sequencing areas to the point of application is made either by AGV’s (Automated Guided Vehicles) or again tow trucks. AGV’s have data stored in different databases depending on its manufac-turer.
• point of fit - Finally, the parts are manually delivery at the point of fit by the line-feeding operator.
Figure 1.3: Receiving and warehousing at VWAE
Throughout the years, VWAE has done numerous optimizations in its logistics pro-cess, namely, with the introduction of AGV’s and with the implementation of auxiliary sequencing tools. Having this said, there are still some constraints.
The main issue regarding logistic processes is that there is an absence of a “Big picture”, all of the different parts of the process are disconnected on data and on knowledge, there is not an integrated data source nor a single entity with a deep understanding of the whole process.
The lack of communication and integration between the different systems create data silos which makes managing process flows throughout the different steps a challenging task, and the multiple generations of technologies found aggravate this issue since recent systems are prepared for the 4.0 revolution and older ones require multiple steps to even
1 . 1 . P R O B L E M D E S C R I P T I O N
Figure 1.4: Bahnhof area at VWAE
Figure 1.5: sequencing and batteries POF at VWAE
gather data. The complexity of the logistics process on a plant of this size and the multi-source, multi-structured, high volume, variety and veracity nature of the data make it very hard to handle, analyse and correlate.
Most of the organizations have huge volumes of structured data housed in different data sources such as mainframes and databases, and also unstructured data sets. Providing integrated data from such a variety of sources is prerequisite for effective business intelli-gence[12].
Gathering data from heterogenous sources and manipulating them to prepare for big data analysis processes is still a big problem[13]. The logistics department at VWAE suffers
from the absence of any predictive and adaptive functionalities and that force logistics planners to use conventional methods, relying on past experience and trial and error for every decision they make. This reduces the ability of optimizing the system because it
C H A P T E R 1 . I N T R O D U C T I O N
takes considerable time, effort and, until deployment, there is no way of validating these changes or to predict their outcomes with an acceptable degree of confidence.
Data errors are present with some regularity, due to lack of both data validation and awareness of the importance of data validity. This problem reduces the confidence of both the decision makers and planners at VWAE in the data available which leads to its lack of use and value.
One important aspect of logistics in manufacturing is warehouse management. Managing a warehouse is very complex because of the multiple variables to consider like physical space, internal transport times, inventory costs, security and material quality to name a few. The warehousing management is also constantly under pressure to feed the produc-tion line because stoppages can be very expensive.
Warehouse management at VWAE is no different and must account for all these vari-ables for a few thousand different parts with very different characteristics and processes associated. For our selected part, car batteries, inventory management is especially im-portant for multiple reasons, it’s a valuable component so stall money is a factor, it has to be stored in ground level and does not support stacking of other packages above so it occupies premium warehouse location and they also have expiration dates. There is a necessity to be more efficient in warehousing space, stall money, transport costs and pollutant emissions and that lead to a necessity of optimizing inventory levels.
1.2
Research question and hypothesis
Regarding the problem mentioned above, a question can be asked: “How to optimize the inventory levels based on the production?” The hypothesis to prove is that the inventory levels can be optimized with a data driven system that analyses the available data from stock, supply and demand, and learns from the data to provide optimizations.
1.3
Proposed solution
The proposed solution consists of a data-driven system that can collect, clean, prepare and integrate data from multiple sources, learn from historical data and suggest opti-mizations.
As a primary objective we intend to minimize situations of overstock by reducing order quantities and number of trucks.
To that end I will utilize historical data from stock levels to analyse the magnitude of the problem and where are opportunities for improvements. Then I will use data from the production line to predict the usage of each material to calculate the optimal number of inventory is at a given moment.
1 . 4 . M E T H O D O L O G Y
We intended to implement a multi-layer architecture, which for this use-case wont nec-essary be a “big data” architecture but will be built with a future integration in a cloud computing system like apache spark in mind for the purpose of scalability. The multiple layers will be described in detail throughout this dissertation. The said layers are the following:
1. ETL (extract, transform, load) – To implement a data driven system its necessary to extract the data from its source, transform it into a clean structured format to load into said system. This layer consists of multiple operations of loading, cleaning, reshaping, resampling and normalization to get the data from its source into our machine learning (ML) layer or directly to the processing or presentation layer.
2. Storage layer – this layer consists of a database with the clean, structured and inte-grated data necessary to save historical data.
3. ML layer – This layer consists of a machine learning model that receives the already prepared data and learns patterns, behaviours, and trends without being explicitly programmed from that data to forecast the future states of that said data. Those forecasted values are then forward to the next layer.
4. Processing – This layer consults the available data, including the forecasts provided by the ML layer, and calculates the suggested values of each target.
5. Presentation – This layer consists of ways to present data and insights to the plan-ners, by the creation of graphs and data tables in intuitive ways. With this addition decision makers are equipped with data and insights to make the best possible decision.
This architecture was chosen because the main problem encountered was the absence of a “Big Picture” of the data available, because of the existence of data silos and lack of data validation. This way our ETL layer can eliminate the data silos by integrating the data and cleaning and structuring the data in the process. The machine learning layer can be used to learn from data and output insights, in this use case it will learn from historical data to forecast the next 5 days of consumption of car batteries by the production line. The processing is necessary to interpret the output of the machine learning layer, and finally the presentation layer intends to solve the absence of the “Big Picture” by presenting the data from all clusters in the same platform.
1.4
Methodology
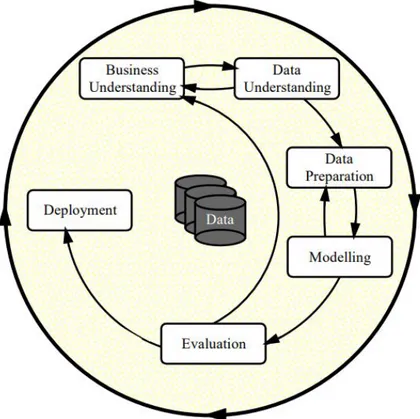
This dissertation will follow a CRISP-DM (Cross-industry standard process for data min-ing) reference model. Within this model the life cycle of a data mining project is broken down in six phases which are shown in figure 1.6. [14]
C H A P T E R 1 . I N T R O D U C T I O N
Figure 1.6: Phases of CRISP-DM model
1. Business understanding – Vital to know what to look for and defining objectives
2. Data understanding – Considerations on how to integrate data from multiple sources.
3. Data preparation – Covers all activities to construct the final dataset
4. Modelling – Decide and apply the modelling techniques.
5. Evaluating – Evaluate the results obtained in the previous step and decide new objectives and future tasks.
6. Deployment – Define a strategy to implement the results validated on step 5.
This methodology does not have a strict sequence of the phases and moving back and forth between phases is always required in order to improve the outcome iteratively. To acquire the necessary knowledge about the business, logistics process and general work of the factory an internship for the duration of the work was seen by both parts as a positive measure and the most fruitful way to proceed.
1 . 5 . B O O S T 4 . 0 C O N T R I B U T I O N S
1.5
BOOST 4.0 Contributions
As previously stated, this work is integrated in the VWAE pilot of the BOOST 4.0 Euro-pean project. This section will provide a description of the pilot and its objectives as well as description of the different phases of the pilot and the contributions of this thesis to the project.
Boost 4.0 is seeking to improve the competitiveness of Industry 4.0 and to guide the European manufacturing industry in the introduction of Big Data in the factory, along with the necessary tools to obtain the maximum benefit of Big Data. In respect to global standards, Boost 4.0 is committed to the international standardization of European Indus-trial Data Space data models and open interfaces aligned with the European Reference Architectural Model Industry 4.0 (RAMI 4.0).
The standardization of industry 4.0 compliant systems or smart manufacturing systems include many aspects [15]. Future smart manufacturing infrastructures must enable the exploitation of new opportunities. Even today, people are surrounded by interconnected digital environments continuously generating more synergies with connected devices and software. Such an evolution happens also in the manufacturing domain as in Volkswa-gen. Future Smart Manufacturing infrastructures are confronted with the digitalisation and virtualisation of (physical) objects enhanced with sensors, processors, memory and communication devices, able to communicate coactively and to exchange information independently through a reactive, predictive, social, self-aware and/or autonomous be-haviour [16] [17]. A used term for such intelligent physical objects is Cyber-Physical System (CPS) which are communicating in (Industrial) Internet of Things ((I)IoT) net-works.
To exploit new opportunities, specific requirements as real-time, security or safety have to be considered. Smart Manufacturing infrastructures have to be based on network technologies which enable a secure (encryption, authentication, robustness, safety), verti-cal and horizontal cross-domain and cross-layer communication between stationary and mobile objects (as virtual objects, sensors, actors, devices, things or systems). Network technologies must comply with specific requirements related to e.g. real-time, safety, security, data amounts, wired or wireless, passive, or active, etc.[18]. Lower level fields (process control or real-time statistics) require time frame abilities of seconds or even mil-liseconds for response, whereas higher levels (production planning or accounting) only require time frames of weeks or months[18]. Architectures, as the RAMI 4.0 in figure 1.7, in general, are describing the ordering of components/modules and their interaction and should provide a unified structure and wording for used terms. An architecture should include a logical, a development, a process and a validation view, and should provide scenarios for a validation as proposed by Philippe Kruchten in his 4+1 architectural view model [19]. A smart manufacturing architecture should also provide a unified structure and wording covering mandatory aspects in smart manufacturing as product, system
C H A P T E R 1 . I N T R O D U C T I O N
or order life cycles, value streams, information flows, or hierarchical layers. Such archi-tectures are currently under development. (Physical) reachable objects inside a smart manufacturing network (e.g. digitalised and virtualised field level devices, systems, ma-terial, integrated humans, virtual concepts (e.g. of products in the design phase), etc.), have to fulfil a range of requirements. Objects should communicate using a unified com-munication protocol, at least at the application level, and should be based on a unified semantic to enable a mutual identifiability and understanding. The object itself should provide its own features as a service (e.g. state information or functionalities) and should be able to provide its own description next to extended information as manuals, specifica-tions or wear information. All these have to be kept next to further requirements related to security, safety or quality of service [20] [21]. Finally, various applications that use
Figure 1.7: RAMI 4.0 Reference Architecture
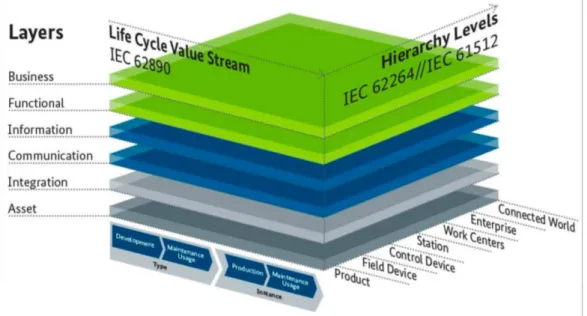
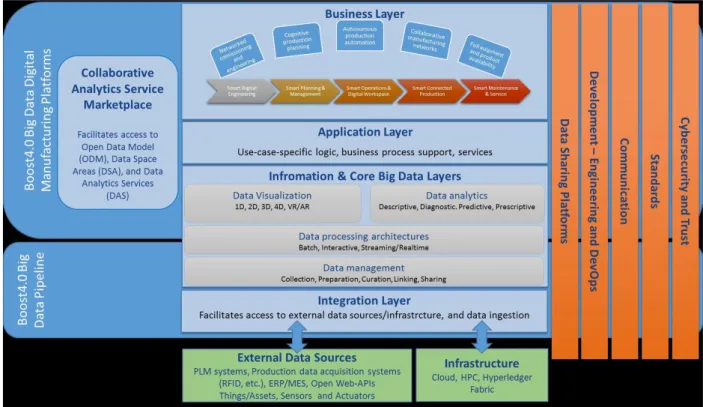
services of deployed objects to realise e.g. control systems, systems of systems through service orchestration, or - as focused in in this work - Big Data analysis applications can be implemented. Standards can be classified according to what role they play in the system architecture. At this stage in the Boost 4.0 project we have the RAMI 4.0 (fig 1.7). In figure 1.8 we have the Boost 4.0 architecture. Here we can see Boost 4.0 horizontal layers, visualization, data analytics, data processing, data management and external Data sources/Infrastructure as well as the Vertical layers, development, communications and connectivity, data sharing platforms and privacy/security. This dissertation will con-tribute mainly on the visualization, data analytics, data processing, data management and external data sources/Infrastructure layers.
This pilot is structured in four different phases as we can see on figure 1.9.
Phase 1 - The initial version of the pilot’s implementation mainly comprised the overall test of the closeness of the simulation with the reality of the logistics operations at VWAE.
1 . 5 . B O O S T 4 . 0 C O N T R I B U T I O N S
Figure 1.8: Boost 4.0 Architecture
Figure 1.9: Pilot structure and phases
This phase was divided into several iterations in order to have the best possible fitting between what is being simulated in Visual Components “Digital-Twin” and the reality in terms of logistics processes, in accordance to the main business scenarios for this pilot. The tasks of this phase are represented in figure 1.10 and this dissertation contributed to the data cleaning and data transformation tasks.
Phase 2 - Real-Time Scenario. In this phase, real-time data is fed into the simulation in order to confirm that the simulation clearly depicts the real-world processes, to val-idate if the real-world processes can be optimized and also to check the as-is situation
C H A P T E R 1 . I N T R O D U C T I O N
Figure 1.10: phase 1
when tweaks in the actual process are performed in the simulation. The data is fed to the simulation environment through a Publish-Subscribe mechanism, as is the case of the OPC-UA standard or the FIWARE ORION Context Broker, meaning that when a set of data is published into the service, the simulation environment will get it through its subscription to the Pub-sub service. On figure 1.11 we have the tasks of this phase, this dissertation contributed to the Big data aggregation.
Phase 3 Prediction. This phase is characterized by the use of Data Mining and Machine
Figure 1.11: phase 2
Learning algorithms, both for prediction of future data values and on the analysis of data retrieved from the simulation environment. The first process will be to predict future data depending on specific tweaks to the processes, whether they are made directly on the physical dimension of the simulation (e.g. placing the sequencing area in a different place, changing an human operator for an AGV or robot, etc.) or on the data per se (e.g. increase the number of jobs in the Point-of-fit, increase the time intervals between truck arrivals, etc.). The predicted data would then be fed into the simulation environment, in order to check the impact of the tweaks in the logistics operation, i.e. if the whole process would still correspond to the necessary production requirements or not. In the case the process does not meet the necessary requirements, then solutions for the encountered issues must be found. The tasks of this phase are in figure 1.12 and this dissertation contributed to the predictive algorithms task.
Phase 4 Future Digital Twin. This phase comprises the final version of the digital twin, in which the future operations of the logistics area at VWAE will be tested prior to real implementations. This process of digital twin testing will provide a solid ground to create new processes, optimize existing ones and test significant changes in the overall logistics operation without the need of performing real-world pilots, saving money, time and hu-man resources that would otherwise be needed to perform such piloting activities. This is
1 . 6 . T H E S I S O U T L I N E
Figure 1.12: phase 3
crucial to VWAE since, up to now, the only way to perform testing activities is to couple them into the everyday operation, which brings serious problems in terms of execution times, resource usage and return of investment. Furthermore, when piloting some opti-mization of processes or the assessment of the use of new technologies on the logistics operations does not meet the required expectations, all of the above problems are even more critical, since the effort spent in the tests, regarding money, time and resources does not contribute to a substantial improvement of the operation. The tasks of this phase are in figure 1.13 and this dissertation contributed to the analytics task.
Figure 1.13: phase 4
1.6
Thesis outline
This dissertation is divided in 6 chapters. The first chapter is the introduction one, it frames and describes the problem at study and presents a conceptualization and descrip-tion of the proposed soludescrip-tion. Literature review and study of previous soludescrip-tions and research on similar problems and key technologies forms the next chapter. After this a chapter with the description of the data available and used throughout the dissertation. The architecture of the system is the next chapter and it is divided into sub-chapters for each step of the process, followed by a chapter presenting the results obtained. Finally, a chapter with conclusions drawn from the work and a description of the work that can derive from the one present here.
C
h
a
p
t
e
r
2
S ta t e o f t h e A rt
This chapter contains a review of the concepts and technologies addressed in this disser-tation.
2.1
Machine Learning
Machine learning (ML) is the study of algorithms and statistical models that computers use to perform specific tasks without using explicit instructions, relying on patterns and inference instead. It focuses on the development of computer programs that access data and use it to learn (training data). This technology is seen as a subset of artificial intelli-gence.
There are multiple categories of machine learning and each one of these differ in approach, type of data input and output, and the type of problem that they are intended to solve. We can separate machine learning in 3 main categories:
• Supervised Learning – Builds a mathematical model of a set of data that contains both the inputs and the desired outputs. To every output there is one or multiple inputs. Through iterative optimization of an objective function, the system can provide outputs to any new inputs after enough training. Supervised learning algo-rithms include classification, for cases where the outputs are restricted to a limited set of values, and regression for cases when the outputs can have any numerical value.
• Unsupervised learning – Is used when the data provided is neither classified nor labelled, and instead of figuring out the right output identifies common features within the data and can infer functions to describe hidden structure on data.
C H A P T E R 2 . S TAT E O F T H E A R T
• Reinforcement learning – Ought to take actions in an environment to maximize a notion of cumulative reward. Trial and error search and delayed reward are the most relevant characteristics of reinforcement learning. It allows software agents to autonomously determine the ideal behaviour in each scenario. These algorithm’s do not assume the knowledge of an exact mathematical model and are used when exact models are infeasible.
Figure 2.1: Structuring of machine learning techniques and algorithms [6]
Figure 2.1 shows the structuring of machine learning techniques and algorithms, and that in all categories there is a big range of different algorithms, each one with its advantages and disadvantages.
Machine learning has applications in multiple areas, approaches for predicting future inbound logistic processes already exist[22], forecasting of supply chains showed im-provements and increased adaptability with the use of machine learning algorithms[23], in healthcare machine learning algorithms proved successful in predicting early colorec-tal cancer metastasis using digicolorec-tal slide images[24].
In industry, supervised machine learning techniques are mostly applied due to the data-rich but knowledge-sparse nature of the problems [25]. The general process contains several steps handling the data and setting up the training and test dataset by the teacher, hence supervised [26].
In 2017 an article[27] implemented a machine learning based system to respond to a problem of optimal order placements in electronic equity markets and achieved substan-tial reductions of transactions costs.
Multiple machine layer techniques are being applied with success on scheduling prob-lems like this article [28] that proposes a framework to optimize scheduling of processes in order to reduce power consumption in data-centre’s, they utilize machine learning techniques to deal with uncertain information and use models learned from previous sys-tem behaviours in order to predict power consumption levels, CPU (Central Processing Unit) loads, and SLA(service-level agreement) timings, and improve scheduling decisions.
2 . 1 . M AC H I N E L E A R N I N G
Machine learning algorithms are becoming more and more useful with the growth of big data, since it is not possible or practical to have programmer’s constantly adapting code to extract useful information from data. There are multiple examples of cases where the use of big data techniques aided by machine learning produced valuable results in varied areas like energy, logistics, agriculture, marketing or even health. A good example are search engines that use ML algorithms to recommend advertisements related with the content searched [29].
2.1.1 Predictive techniques
There is a wide range of predictive techniques and mainly two categories, regression tech-niques and machine learning ones. With regression models the focus lies on establishing a mathematical equation as a model to represent the interactions between the different variables in consideration. Depending on the situation there are a wide variety of models that can be applied while performing predictive analytics.
One of this models is the linear regression model that analyses the relationship between the response or dependent variable and a set of independent or predictor variables. This relationship is expressed as an equation that predicts the response variable as a linear function of the parameters. These parameters are adjusted so that a measure of fit is optimized. Much of the effort in model fitting is focused on minimizing the size of the residual, as well as ensuring that it is randomly distributed with respect to the model predictions. A proposed local linear regression model was applied to short-term traffic prediction in this paper[30] and the performance of the model was compared with pre-vious results of nonparametric approaches that are based on local constant regression, such as the k-nearest neighbour and kernel methods, by using 32-day traffic-speed data collected on US-290, in Houston, Texas, at 5-min intervals. It was found that the local linear methods consistently showed better performance than the k-nearest neighbour and kernel smoothing methods.
Logistic regression is a statistical model that in its basic form uses a logistic function to model a binary dependent variable, although many more complex extensions exist. Although it’s a simple model in some cases it can outperform more advanced models. This study [31] uses Logistic Regression, Moving Average and BPNN (Back-Propagation Neural Network) methods for sales models designed to predict daily fresh food sales and found that the correct percentage obtained by the logistic regression to be better than that obtained by the BPNN and moving average models
Machine learning was already described before and some of its techniques can be used to conduct predictive analytics.
Neural networks are nonlinear sophisticated modelling techniques that are able to model complex functions. They can be applied to problems of prediction, classification or con-trol in a wide spectrum of fields and are used when the exact nature of the relationship between inputs and output is not known. A key feature of neural networks is that they
C H A P T E R 2 . S TAT E O F T H E A R T
learn the relationship between inputs and output through training.
The multilayer perceptron (MLP) consists of an input and an output layer with one or more hidden layers of non-linearly-activating nodes or sigmoid nodes. This is determined by the weight vector and it is necessary to adjust the weights of the network. The back-propagation employs gradient fall to minimize the squared error between the network output values and desired values for those outputs. The weights adjusted by an iterative process of repetitive present of attributes. Small changes in the weight to get the desired values are done by the process called training the net and is done by the training set (learning rule).
Support vector machines (SVM) are used to detect and exploit complex patterns in data by clustering, classifying and ranking the data. They are learning machines that are used to perform binary classifications and regression estimations. They commonly use kernel-based methods to apply linear classification techniques to non-linear classifica-tion problems. There are several types of SVM such as linear, polynomial, sigmoid etc. Multiple authors written about this. This paper [32] proposes an support vector machine model to forecast the streamflow values of Swan River near Bigfork and St. Regis River near Clark Fork of Montana, United States and this model outperformed the other models tested, the autoregressive moving average model (ARMA) and an artificial neural network (ANN). Another SVM model was successfully utilized to predict a daily electricity price forecast on this paper[33].
2.1.2 LSTM
Long short-term memory (LSTM) networks are a type of RNN and were discovered in 1997 by Hochreiter and Schmidhuber and set accuracy records in multiple applications domains. [34]
LSTM are deep learning systems that avoid the vanishing gradient problem which means that prevent backpropagated errors from disappearing or overgrowing . LSTM are nor-mally augmented by recurrent gates called “forget gates”. [35]. So, errors can flow back-wards through unlimited numbers of virtual layers unfolded in space. LSTM can learn tasks that require memories of events that happened thousands or even millions of dis-crete time steps earlier. [36] LSTM differ from other networks because they can work with long delays between events and mainly because they can handle high and low frequency events at the same time.
Multiple authors are using LSTM to make predictions to important datasets, a paper [37] proposed an approach to forecast PM2.5 (Particulate Matter) concentration using LSTM by exploiting Keras[38], which is a high-level neural networks API written in Python and capable of running on top of Tensorflow, to build a neural network and run RNN with LSTM through Tensorflow. The results showed that the proposed approach can effectively forecast the value of PM2.5.
2 . 2 . B I G DATA A N A LY T I C S
Another paper [39] modelled and predicted China stock returns using LSTM. The his-torical data of China stock market were transformed into 30-days-long sequences with 10 learning features. That LSTM model compared with random prediction method im-proved the accuracy of stock returns prediction.
LSTM models accept multiple input and output types of data, one example of that is a paper [40] that introduced an algorithm of text-based LSTM networks for automatic composition and reported results for generating chord progressions and rock drum tracks. The experiments show LSTM provides a way to learn the sequence of musical events even when the data is given as text and the authors plan to examine a more complex network with the capability of learning interactions within music (instruments, melody/lyrics) for a more complete automatic composition algorithm.
2.2
Big Data Analytics
With the exponential growth in the volume of data produced, big data is a concept whose relevance has grown, a tendency with no signs of slowing down in a near future. In general, big data is used to describe a large amount of structured, semi-structured and unstructured data created by data sources, which would need too much time and money to be stored and analysed. Big data can also be defined by the four characteristics, also named “the four V’s”: [3]
• Volume, for the scale of the data produced, which makes it difficult to be processed by regular data processing techniques.
• Velocity, by the pace at which the data is produced, demanding a much higher processing capacity.
• Variety, in terms of content, format and size, which does not enable a standard method for processing all the data.
• Value of the hidden information that can be collect by analysing such a large amount of data.
Data Analytics may correspond to the application of tools and techniques to extract in-sights and knowledge from data, by analysing it through any of Statistics, Data Mining and Machine Learning techniques. Although statistical analytics is supported by well-known statistical techniques, which are more easily deployed on a Big Data context, in the case of Data Mining and Machine Learning, the passage to a Big Data environment is not a trivial task, since it comprises the reconfiguration of algorithms to be deployed in Big Data execution engines.
In typical data mining systems, the mining procedures require computational intensive computing units for data analysis and comparisons. A computing platform is, therefore, needed to have efficient access to, at least, two types of resources: data and computing
C H A P T E R 2 . S TAT E O F T H E A R T
processors.
For Big Data mining, because data scale is far beyond the capacity that a single personal computer can handle, a typical Big Data processing framework will rely on cluster com-puters with a high-performance computing platform. The role of the software component is to make sure that a single data mining task, such as finding the best match of a query from a database with billions of records, is split into many small tasks each of which is running on one or multiple computing nodes [41].
Big Data Analytics refers to the implementation of analytic tools and technologies within the scope of Big Data [9]. Hence, Big Data Analytics may be described by two specific concepts, Big Data + Analytics, and the interactions between technologies supporting both concepts.
So, why merge these concepts [42]? First, Big Data provides gigantic statistical samples, which enhance analytic tool results. In fact, the general rule is that the larger the data sample, the more accurate are the statistics and other products of the analysis. Second, analytic tools and databases can now handle big data, and can also execute big queries and parse tables in record time. Moreover, due to a precipitous drop in the cost of data storage and processing bandwidth, the economics of analytics is now more embraceable than ever.
The manufacturing sector is also implementing Big Data Analytics, this paper [43] pro-poses a big data driven analytical framework to reduce the energy consumption and emission for energy-intensive manufacturing industries. Then an application scenario of ball mills in a pulp workshop of a partner company is presented to demonstrate the proposed framework. The results show that the energy consumption and energy costs are reduced by 3% and 4% respectively.
According to [44] the semiconductor manufacturing industry has been taking advantage of the big data and analytics evolution by improving existing capabilities such as fault detection, and supporting new capabilities such as predictive maintenance. For most of these capabilities, data quality is the most important big data factor in delivering high quality solutions and incorporating subject matter expertise in analytics is often required for realizing effective on-line manufacturing solutions. In the future, an improved big data environment incorporating smart manufacturing concepts such as digital twin will further enable analytics; however, it is anticipated that the need for incorporating subject matter expertise in solution design will remain.
Internet of Things generated data is characterized by its continuous generation, large amount, and unstructured format. The existing relational database technologies are in-adequate to handle such IoT generated data because of the limited processing speed and the significant storage-expansion cost, to counter that a paper [45] proposes a sensor-integrated radio frequency identification (RFID) data repository-implementation model using MongoDB and show that the proposed design strategy, which is based on horizontal data partitioning and a compound shard key, is effective and efficient for the IoT gener-ated RFID/sensor big data.
2 . 2 . B I G DATA A N A LY T I C S
In this paper[46], an overall architecture of big data-based analytics for product lifecy-cle (BDA-PL) was proposed. It integrated big data analytics and service-driven patterns that helped to overcome the lack of complete data and valuable knowledge. Under the architecture, the availability and accessibility of data and knowledge related to the prod-uct were achieved. Focusing on manufacturing and maintenance process of the prodprod-uct lifecycle, and the key technologies were developed to implement the big data analytics. The presented architecture was demonstrated by an application scenario, and the results showed that the proposed architecture benefited customers, manufacturers, environment and even all stages of product lifecycle management, and effectively promoted the imple-mentation of cleaner production.
Big Data in supply chain problems makes it possible to analyse the data at a more ad-vanced level than traditional tools, allowing the processing and combining of data col-lected from several systems and databases in order to provide a clear picture of the situa-tion. It can provide information on potential interference with the supply chain through the collection and evaluation of data, it is possible not only to protect but also improve the efficiency of the supply chain. This way, interruptions on production are avoided and operational efficiency is increased. Big Data enables the optimization of logistic processes while making the supply chain less prone to failures [47].
2.2.1 Existing Big Data Technologies
There are several surveys, starting from early 2000’s up to today, regarding Big Data Analytics. These surveys often describe the same Big Data technologies, which have been evolving throughout the years, coupled with Analytics techniques. The following para-graphs present the most prevalent technologies and tools on all the surveys[42] [48] [49] [50].
Regarding execution engines, the following are the most referred to in literature. Apache Hadoop software library is a framework that allows for the distributed processing of large data sets across clusters of computers using simple programming models. It is designed to scale up from single servers to thousands of machines, each offering local computation and storage. Rather than rely on hardware to deliver high-availability, the library itself is designed to detect and handle failures at the application layer, so delivering a highly-available service on top of a cluster of computers, each of which may be prone to failures. It builds over a data processing paradigm called MapReduce. The MapReduce workflow looks like this: read data from the cluster, perform an operation, write results to the cluster, read updated data from the cluster, perform next operation, write next results to the cluster, etc., Apache Spark is a general-purpose cluster computing engine which is very fast and reliable [51] that started as a research project at the UC Berkeley AMPLab in 2009, and was open sourced in early 2010. Many of the ideas behind the system were presented in various research papers over the years.
C H A P T E R 2 . S TAT E O F T H E A R T
applications efficiently. RDDs can be stored in memory between queries without re-quiring replication. Instead, they rebuild lost data on failure using lineage: each RDD remembers how it was built from other datasets (by transformations like map, join or groupBy) to rebuild itself. RDDs allow Spark to outperform existing models by up to 100x in multi-pass analytics. Spark showed that RDDs can support a wide variety of iterative algorithms, as well as interactive data mining and a highly efficient SQL engine called Spark SQL, which enables queries in SQL to be executed on NoSQL environments. While MapReduce operates in steps, Spark operates on the whole data set in one fell swoop. Spark completes the full data analytics operations in-memory and in near real-time and Spark also works for both batch offline data processing and online stream pro-cessing, through its real-time counterpart: Spark Streaming.
Apache Spark also has a Machine Learning library called MLlib [52], which include:
• Classification: logistic regression, naive Bayes;
• Regression: generalized linear regression, survival regression;
• Decision trees, random forests, and gradient-boosted trees;
• Recommendation: alternating least squares (ALS);
• Clustering: K-means, Gaussian mixtures (GMMs);
• Topic modelling: latent Dirichlet allocation (LDA);
• Frequent item sets, association rules, and sequential pattern mining;
Beyond Big Data execution engines, storage and query systems for Big Data also had an enormous evolution in the past few years. MongoDb[53], Apache Cassandra[54] two different storage engines which do not rely on traditional RDBMS (Relational Database Management System) and SQL technologies. Instead, each use a specific type of data storage mechanism. Mongo is based on a document structure, relying on JSON(JavaScript Object Notation) formatted documents to store data. Cassandra is also supported by a file storage system, while HBase maintains the traditional tabular form, used in RDBMS systems. Because most companies are used to using SQL query tools in order to perform complex queries on their systems, several abstractions to NoSQL technologies were added, in order to provide SQL query functionality to these systems.
2.3
Inventory Management
This section describes relevant literature to frame the phenomenon’s in focus on this dissertation.
Inventory management is a challenging problem in supply chain management and inven-tory is the supply of raw materials that an organization maintains to meet its operational
2 . 3 . I N V E N T O RY M A N AG E M E N T
needs. Inventory is defined as a stock of goods that is maintained by a business in antic-ipation of some future demand. The quantity to which inventory must fall in order to signal that an order must be placed to replenish an item[55].
Capacity and inventory management are key to operations management, as they concern the planning and control of the supply or processing side of matching supply and de-mand, and because of that they are very a researched area[56].
As this is an old problem multiple authors have written about it.
Dolgui and Prodhon [57] have focused on the development of MRP software for an un-certain environment and have shown that various techniques such as safety stock, safety lead time, and lot-sizing rules can be used to control the supply variability in order to lead the better anticipation of uncertainties.
Multiple authors have showed that safety lead time can be used to work around sup-ply uncertainties like late deliveries[58]. Axsäter in 2006 compared two types of lead times. The comparison showed that inventory levels vary less in case of independent lead times than dependent ones[59]. There is tremendous need for scalable supply chain opti-mization algorithms to respond to dynamic information, that is, to perform data-driven re-optimization in a timely manner[56]. The classical systems work but they usually as-sumed stationary demand distributions, but when the demand environment is non static or unknown, optimal policy is often difficult to identify and even when one can identify some solutions those are likely to require a lot of computational power. To tackle these complex optimization problems on an industrial scale, machine learning techniques can be used to generate quick heuristics. Machine learning can provide general purpose algorithms that can readily be applied to multiple different problems without years of specialized research to tailor the solution approach although the generic nature of these algorithms can have worse performances than the ones specifically designed for the prob-lem at hand[60].
According to this paper [61] determining the adequate stock levels balances the over-stocking costs, these include costs for holding the safety stocks, for occupying additional storage space and transportation and the Costs of lost sales or production. To deal with this costs the use of data mining techniques ensures that each inventory point (internal warehouse, work-in-process, distribution center, retail store) has the optimal stock levels. Commonly, managers have relied on a combination of ERP (Enterprise Resource Plan-ning), supply chain, and other specialized software packages, as well as their intuition to forecast inventory. However, in today’s high uncertain environment and large quantities of disparate data demands new approaches for forecasting inventory across the entire chain. Data mining tools can be used to accurately forecast products to where they are needed.
This paper [62] proposes a hybrid deep learning models for inventory forecasting. Ac-cording to the highly nonlinear and non-stationary characteristics of inventory data, the models employ Long Short-Term Memory (LSTM) to capture long temporal dependencies and Convolutional Neural Network (CNN) to learn the local trend features and although
C H A P T E R 2 . S TAT E O F T H E A R T
building CNN-LSTM network architecture and tuning can be challenging, experimental results indicate that the evolved CNN-LSTM models are capable of dealing with complex nonlinear inventory forecasting problem.
This paper [63] from 2019, proposed an inventory forecasting solution based on time series data mining techniques applied to transactional data of medical consumptions because one of the factors that often result in an unforeseen shortage or expiry of medica-tion is the absence of, or continued use of ineffective, inventory forecasting mechanisms. Unforeseen shortage of perhaps lifesaving medication potentially translates to a loss of lives, while overstocking can affect both medical budgeting as well as healthcare provi-sion. The results from this work evidently suggest that the use of data mining techniques could prove a feasible solution to a prevalent challenge in medical inventory forecasting process.
Some authors argue that human decision making, augmented by data-driven decision models suggesting real-time actions, will remain the desired approach for complex op-erations as algorithms rarely can anticipate all possibilities economically[56]. So, it is desirable that the human be the ultimate decision maker as experience, common sense, intuition, and insights derived from structured models can rarely be replaced by a fully automated solution. Intervention is desired, if not necessary, when we detect stupid so-lutions due to input or algorithm errors. Analysing their output can generate insight into which variables are significant and which can be ignored and can help enriching analytical models to develop deeper insights, as illustrated by Gijsbrechts [60].
A paper in 2008 [64] develop an enhanced fuzzy neural network (EFNN) based decision support system for managing automobile spares inventory in a central warehouse. And in that system, the EFNN is utilized for forecasting the demand for spare parts. That system when evaluated with real world data outperformed five other models.
C
h
a
p
t
e
r
3
I n t r a l o g i s t i c s Da ta A n a ly s i s
This chapter will include a description and analysis of the whole range of intralogistics data generated at the VWAE automotive factory.
The objective of this thesis and the BOOST 4.0 project is to contribute to the optimizations of intralogistics processes by applying emerging technologies and take advantage of the data available. To ensure this a data assessment to shed light on how to integrate data in order to achieve a “big picture” of the intralogistics process.
One of the first tasks I set out to accomplish was an overview of the data available. A description of the data available by each cluster.
Note that some of the data is not described in detail to prevent any issues of data pro-tection and confidentiality. For the same reasons some data is described but the sample presented contains less data than the described.
3.1
External Transports Data
The external material transports in this context means transports that start outside the factory. Most of the incoming parts arrive by truck, the available data consisted of raw excel files with tabular data from each truck arriving at the factory.
These files contained timestamps of multiple events for each truck, like arriving time, start and end of unloading, information about the material unloaded like quantity and description, licence plate of the truck and the unloading position as well as transport identification number and material order number. The licence plate, transport identifi-cation number and material order number fields are important to the data integration process because these fields represent the same information on the receiving cluster, thus enabling a connection to be made.
C H A P T E R 3 . I N T R A L O G I S T I C S DATA A N A LY S I S
preparation was made to obtain clean data. In table 3.1 there is a small data sample.
nº guia transporte ID Chegada fabrica inicio descarga fim descarga saida fabrica local de descarga part number 000180576 219779693 03.01.19 10:03 03/01/2019 10:54:00 03/01/2019 11:30:00 03/01/2019 12:23:00 LOZ_5_KLT 6R0915105B 016648930 219812549 04.01.19 01:00 04/01/2019 01:35:00 04/01/2019 01:50:00 04/01/2019 01:51:00 LOZ10_GLT 1S0915105A 016648931 219812549 04.01.19 01:00 04/01/2019 01:35:00 04/01/2019 01:50:00 04/01/2019 01:51:00 LOZ10_GLT 5TA915105B 016648932 219812549 04.01.19 01:00 04/01/2019 01:35:00 04/01/2019 01:50:00 04/01/2019 01:51:00 LOZ10_GLT 7P0915105 016648927 219809991 04.01.19 01:36 04/01/2019 02:04:00 04/01/2019 02:17:00 04/01/2019 02:18:00 LOZ10_GLT 1S0915105A 016648928 219809991 04.01.19 01:36 04/01/2019 02:04:00 04/01/2019 02:17:00 04/01/2019 02:18:00 LOZ10_GLT 7P0915105 016648929 219809991 04.01.19 01:36 04/01/2019 02:04:00 04/01/2019 02:17:00 04/01/2019 02:18:00 LOZ10_GLT 5TA915105B 000180616 219843212 04.01.19 05:28 04/01/2019 05:54:00 04/01/2019 06:34:00 04/01/2019 06:35:00 LOZ_5_KLT 6R0915105B 016649484 219891419 07.01.19 07:05 07/01/2019 08:04:00 07/01/2019 08:37:00 07/01/2019 10:07:00 LOZ_5_KLT 7P0915105A
Table 3.1: External transport data sample
3.2
Receiving Data
Regarding the receiving cluster the data available consisted on excel files with records of material orders. The files contained entries for each unit load ordered and had the follow-ing information, material order creation date, truck license plate, truck arrival data, part identification number, supplier information and the warehouse position for the unit load. In this case the material order number allows connection to the external transport data and the warehouse position for the unit load allows connection to the warehousing data. On table 3.2 we can see a data sample of this data.
Area Nr. Fornec Nr Guia Posição Dt Guia Dt Entrada Peça Gr Arm Embalagem
FCC1 0001551600 000180576 MS05A04A03 2018-12-19 04/01/2019 00:30 6R0915105B T2 DB0011 FCC1 0001551600 000180576 MS05A08A03 2018-12-19 04/01/2019 00:30 6R0915105B T2 DB0011 FCC1 0001551600 000180576 MS05A09A01 2018-12-19 04/01/2019 00:30 6R0915105B T2 DB0011 FCC1 0002522100 016648927 INSPECAO 2018-12-27 04/01/2019 03:35 1S0915105A T2 DB0011 FCC1 0002522100 016648927 INSPECAO 2018-12-27 04/01/2019 03:35 1S0915105A T2 DB0011 FCC1 0002522100 016648927 MS05B22A02 2018-12-27 04/01/2019 03:36 1S0915105A T2 DB0011 FCC1 0002522100 016648927 MS05B22A03 2018-12-27 04/01/2019 03:36 1S0915105A T2 DB0011 FCC1 0002522100 016648927 MS05B27A03 2018-12-27 04/01/2019 03:36 1S0915105A T2 DB0011 FCC1 0002522100 016648927 MS10B25A02 2018-12-27 04/01/2019 03:36 1S0915105A T2 DB0011
Table 3.2: Receiving data sample
3.3
Warehousing Data
The warehousing data available consisted of a daily report that included the quantity and identification of the material stored in each occupied position of the VWAE internal warehouses.
This report is generated with the arrival of material from the receiving cluster and the transports of material leaving the warehouse, not a real time picture of the state of the warehouse, this can be a problem because it can lead to data errors like for example if during the warehousing process an operator stores a container in a wrong position the data will show the container at the correct position.
3 . 4 . T R A N S P O R T T O S E Q U E N C I N G
Table 3.3 is a data sample of the described data.
Area NrReferencia Zona Loc. Peça Fornecedor QStatus GrArm Embalagem Nr. Guia Dt Guia Ultimo Mov. Quantid 43B1 04314028017754 PSO BN05A14D01 7M3810630A 00156324 00X B9 0015SCH 007011214 01/12/2014 13/07/2017 116 43B1 04316031877318 U20 BN06B04E01 7N0864633A 00153479 00X K3 0006PAL 026301258 01/09/2016 13/03/2018 500 43B1 04317035155166 PSO BN05A14B02 1K8827209A 00057588 280 B8 111902 000397189 03/03/2017 23/02/2018 28 43B1 04317036301736 PSO BN05A14B03 1K8827210A 00057588 280 B8 111902 000405075 05/07/2017 23/02/2018 12 43B1 04317036919162 V05 BN03B03C01 1K0809495 00016954 280 B8 111902 000379297 14/09/2017 20/10/2017 500 43B1 04317036938926 INK MAT-NOK. 1K8864629B 00051288 000 68 006280 002161428 04/09/2017 02/11/2017 200 43B1 04317036950013 ING MAT-NOK 1K0813146 00071142 280 B8 111950 040125786 05/09/2017 13/02/2018 129 43B1 04317036968762 V05 BN03B02C02 1K0809495 00016954 280 B8 111902 000377602 04/09/2017 20/10/2017 361 43B1 04317036978923 BKL BN99011A05 7N0864623A 00153479 00X K2 0001SCH 060705981 08/09/2017 25/10/2017 1080 43B1 04317036978927 BKL BN99011A05 7N0864623A 00153479 00X K2 0001SCH 060705981 08/09/2017 25/10/2017 1080
Table 3.3: Stock data sample
3.4
Transport to Sequencing
When it comes to internal transports there is a system responsible for the movements of tow tugs and forklifts. This system manages all internal transports apart from AGV’s, and stores the information regarding each internal transportation, creating a huge amount of data every day.
This data is very detailed and contains a description of each movement made, however the size of this data was overwhelming for the traditional tools for data analysis used like excel, because in a single day hundreds of thousands of records can be generated and weigh over 30 megabyte, that led to this data being left unexplored by the VWAE planners because they only have traditional tools like excel.
The first step made was to isolate the entries regarding transport of the car batteries to compare with the data from the other clusters and with the shop floor situation to un-derstand the meaning of the data. Then a data validation step was made with specialists on these databases from the VWAE in order to understand the real meaning of the data, situations like sensor errors, or impossible values can be quickly detected and explained by specialists in the logistics process, this work with specialists was made for each data source but the complexity of this data led to this data being the focus of our meetings. After this work with the specialists I advanced to clean and prepare data for all existent car components.
This data was connected with the warehouse and sequencing data using the partnumber and warehouse position fields.
ITLS-Auftrags-Nr. Sachnummer Karte DtHrMov_PT Ereignisschlüssel Verbindername Subsystem Menge Lagerplatz 483737 3Q0813116B 08/01/2020 23:02:59 subsystem_started BODY_P1E1->BODY_P1 SLS_BODY 20 B-MAKE 483737 3Q0813116B 08/01/2020 23:04:21 subsystem_finished BODY_P1E1->BODY_P1 SLS_BODY 20 B-MAKE 565637 BUNDLE-R-DE 08/01/2020 23:04:40 subsystem_started POT-KLT->BHF-KLT-MF SLS_ASSY 28
565637 BUNDLE-R-DE 08/01/2020 23:04:42 subsystem_finished POT-KLT->BHF-KLT-MF SLS_ASSY 28
483743 2GA821105A 08/01/2020 23:04:59 subsystem_started BODY_P1E1->BODY_P1 SLS_BODY 26 B-MAKE 483743 2GA821105A 08/01/2020 23:05:17 subsystem_finished BODY_P1E1->BODY_P1 SLS_BODY 26 B-MAKE 483720 2GA809642 08/01/2020 23:05:22 subsystem_started PAL1_A2_LPL->PAL1_EXPED.B2 SLS_PAL1 60 GESTAMP-01 483720 2GA809642 08/01/2020 23:05:28 subsystem_finished PAL1_A2_LPL->PAL1_EXPED.B2 SLS_PAL1 60 GESTAMP-01 565637 BUNDLE-R-DE 08/01/2020 23:05:29 subsystem_started BHF-KLT-MF->VBHF-KLT-DE ZLS-KLT-MF 28
43B1 04317036978927 BKL BN99011A05 7N0864623A 00153479 00X K2

![Figure 2.1: Structuring of machine learning techniques and algorithms [6]](https://thumb-eu.123doks.com/thumbv2/123dok_br/19185197.947227/36.892.136.807.325.580/figure-structuring-machine-learning-techniques-algorithms.webp)

