INSTITUTE OF TECHNOLOGY
GRADUATE PROGRAM IN ELECTRICAL ENGINEERING
OUTPUT-ONLY METHODS FOR DAMAGE
IDENTIFICATION IN STRUCTURAL
HEALTH MONITORING
ADAM DREYTON FERREIRA DOS SANTOS
TD 05/2017
UFPA / ITEC / PPGEE
Guamá University Campus
INSTITUTE OF TECHNOLOGY
GRADUATE PROGRAM IN ELECTRICAL ENGINEERING
ADAM DREYTON FERREIRA DOS SANTOS
OUTPUT-ONLY METHODS FOR DAMAGE
IDENTIFICATION IN STRUCTURAL
HEALTH MONITORING
TD 05/2017
UFPA / ITEC / PPGEE
Guamá University Campus
INSTITUTE OF TECHNOLOGY
GRADUATE PROGRAM IN ELECTRICAL ENGINEERING
ADAM DREYTON FERREIRA DOS SANTOS
OUTPUT-ONLY METHODS FOR DAMAGE
IDENTIFICATION IN STRUCTURAL HEALTH
MONITORING
Ph.D. thesis submitted to the Examining Board of the Graduate Program in Electri-cal Engineering from the Federal University of Pará to obtain the Ph.D. Degree in Elec-trical Engineering, Area of Concentration in Applied Computing.
UFPA / ITEC / PPGEE
Guamá University Campus
Santos, Adam Dreyton Ferreira dos, 1989
-Output-only methods for damage identification in structural health monitoring / Adam Dreyton Ferreira dos Santos. - 2017.
Orientador: João Crisóstomo Weyl Albuquerque Costa; Coorientador: Elói João Faria Figueiredo.
Tese (Doutorado) – Universidade Federal do Pará, Instituto de Tecnologia, Programa de Pós-Graduação em Engenharia Elétrica, Belém, 2017.
1. Falhas estruturais – prevenção. 2. Localização de falhas (engenharia) – processamento de dados. 3. Inteligência artificial. 4. Reconhecimento de padrões. I. Título.
INSTITUTE OF TECHNOLOGY
GRADUATE PROGRAM IN ELECTRICAL ENGINEERING
OUTPUT-ONLY METHODS FOR DAMAGE
IDENTIFICATION IN STRUCTURAL HEALTH
MONITORING
AUTHOR:
ADAM DREYTON FERREIRA DOS SANTOS
PH.D. THESIS SUBMITTED TO EVALUATION OF THE EXAMINING BOARD AP-PROVED BY THE COMMITTEE OF THE GRADUATE PROGRAM IN ELECTRI-CAL ENGINEERING FROM FEDERAL UNIVERSITY OF PARÁ AND JUDGED AP-PROPRIATE TO OBTAIN THE PH.D. DEGREE IN ELECTRICAL ENGINEERING, AREA OF CONCENTRATION IN APPLIED COMPUTING.
APPROVED ON: 27/04/2017
EXAMINING BOARD:
Prof. Dr. João Crisóstomo Weyl Albuquerque Costa
(Advisor – PPGEE/UFPA)
Prof. Dr. Elói João Faria Figueiredo
(Co-advisor – FE/ULHT)
Prof. Dr. Ádamo Lima de Santana
(Internal Member – PPGEE/UFPA)
Prof. Dr. Diego Lisboa Cardoso
(Internal Member – PPGEE/UFPA)
Prof. Dr. Claudomiro de Souza de Sales Junior
(External Member – PPGCC/UFPA)
Prof. Dra. Regina Augusta Campos Sampaio
(External Member – PPGEC/UFPA)
SIGNATURE:
Prof. Dr. Evaldo Gonçalves Pelaes
I would like to thank my family for the kindness, encouragement, and support I have received from them during the entire Ph.D. Course in Electrical Engineering at the Federal University of Pará.
I would like to thank my girlfriend Cindy Fernandes for all the love and compan-ionship dedicated to me during all the moments of this journey that becomes less difficult because of her presence in my life.
I would like to express my deep gratitude to Professors João C.W.A. Costa and Elói Figueiredo, my research supervisors, for their patient guidance, enthusiastic encour-agement and useful critiques of this research work. I would also like to thank Professors Claudomiro Sales, Ádamo Santana, Diego Lisboa, and Regina Sampaio, for their advices and assistance in keeping my progress on schedule since the Qualifying exam.
My grateful thanks are also extended to the friends and researchers Moisés Silva and Reginaldo Santos for their support and collaboration in many publications and vi-sionary ideas. Leaving aside the work, our friendship has great potential to last a lifetime. I am particularly grateful for the friendship and assistance given by members of the Applied Electromagnetism Laboratory (LEA1): Dércio Mathe, Fabrício Lobato, Liane
Barbosa, Roberto Menezes, Gilvan Borges, and Marco Sousa.
My acknowledgements for the financial support received from the CNPq2 (under
Grant 142236/2014-4 and Grant 454483/2014-7).
List of Figures VIII
List of Tables IX
List of Abbreviations and Acronyms X
Abstract XII
Resumo XIII
1 Introduction 1
1.1 Research context . . . 1
1.2 Motivation . . . 4
1.3 Problem . . . 5
1.4 Related work . . . 8
1.4.1 Classical methods . . . 8
1.4.2 Kernel-based methods . . . 9
1.4.3 Cluster-based methods . . . 11
1.5 Justification . . . 12
1.6 Objectives . . . 13
1.7 Original contributions . . . 13
1.8 Organization of the thesis . . . 15
2 Statistical pattern recognition paradigm for structural health monitoring 16 2.1 Main objective of the paradigm . . . 16
2.2 Operational evaluation . . . 17
2.3 Data acquisition . . . 18
2.4 Feature extraction . . . 19
2.4.1 Modal parameters . . . 20
2.4.2 Autoregressive model . . . 21
2.5 Statistical modeling for feature classification . . . 22
2.5.1 Machine learning algorithms for data normalization . . . 22
2.5.1.1 Mahalanobis squared-distance . . . 23
2.5.1.2 Principal component analysis . . . 24
2.5.1.3 Auto-associative neural network . . . 25
2.5.1.4 Kernel principal component analysis . . . 26
2.5.3 Outlier detection based on central Chi-square hypothesis . . . 30
2.5.4 Performance evaluation of feature classification for damage detection 31 2.6 Challenges for statistical modeling for feature classification . . . 33
3 Summary of original work and discussion 35 3.1 Methodology for damage detection and quantification . . . 35
3.2 Papers which compose the thesis and enhancements . . . 37
3.2.1 Paper A: Machine learning algorithms for damage detection: Kernel-based approaches . . . 38
3.2.2 Paper B: A novel unsupervised approach based on a genetic algo-rithm for structural damage detection in bridges . . . 38
3.2.3 Paper C: A Global Expectation-Maximization Approach Based on Memetic Algorithm for Vibration-Based Structural Damage De-tection . . . 39
3.2.4 Paper D: A global expectation-maximization based on memetic swarm optimization for structural damage detection . . . 39
3.2.5 Paper E: Output-only structural health monitoring based on mean shift clustering for vibration-based damage detection . . . 40
3.2.6 Paper F: Agglomerative concentric hypersphere clustering applied to structural damage detection . . . 41
3.2.7 Enhancements of the damage detection process . . . 41
3.3 Comparison between the proposed methods and discussion . . . 43
3.4 List of publications in the context of the thesis . . . 46
4 Conclusions and future research 48 4.1 Conclusions . . . 48
4.2 Future research . . . 51
References 53
Appendices
61
Appendix A Paper A: Machine learning algorithms for damage detection:
Kernel-based approaches 62
Appendix B Paper B: A novel unsupervised approach based on a genetic
Detection 93
Appendix D Paper D: A global expectation-maximization based on memetic
swarm optimization for structural damage detection 104
Appendix E Paper E: Output-only structural health monitoring based on
mean shift clustering for vibration-based damage detection 121
Appendix F Paper F: Agglomerative concentric hypersphere clustering
Figure 1 Hierarchical structure of damage identification (FIGUEIREDO, 2010). 2 Figure 2 Structural collapses in Brazil (from left to right): the Guararapes Battle
Viaduct (Minas Gerais, 2014), the Bridge over the Aracatú River (Pará, 2014), and the Bridge over the Santo Antônio River (Mato Grosso do Sul, 2016). . . 5 Figure 3 Influence of temperature on the first four natural frequencies of the
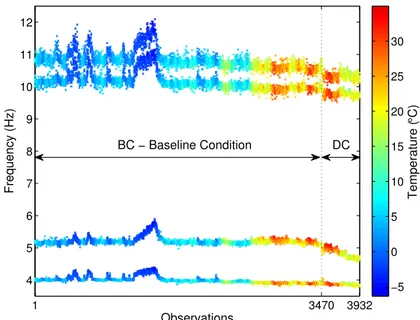
Z-24 Bridge: 1–3470 baseline condition (BC) and 3471–3932 damaged condition (DC). . . 7
Figure 4 The SHM process based on the SPR paradigm (FIGUEIREDO, 2010). 16 Figure 5 Standard architecture of the AANN. . . 25 Figure 6 The MSD-based method combining data normalization and statistical
modeling for feature classification. . . 31 Figure 7 Distributions from the undamaged and damaged conditions. . . 32 Figure 8 Example of a ROC curve; the diagonal line divides the ROC space into
two parts and represents a classifier which performs random classifica-tions. . . 33
Figure 9 Flow chart of the methodology for damage detection and quantification. 36 Figure 10 Graphic representation of the statistical modeling for feature
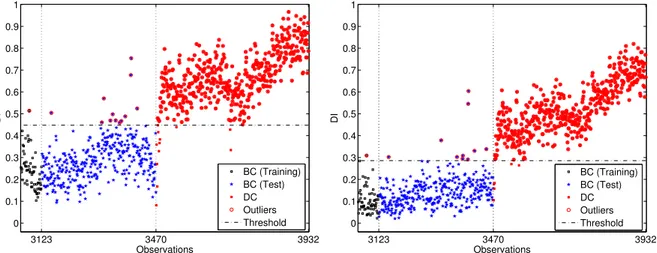
classifi-cation and results related to damage detection and quantificlassifi-cation. . . . 36 Figure 11 DIs estimated from the application of the MSC (left) and GEM-GA
(right) methods on hourly data sets from the Z-24 Bridge. . . 45
Table 1 Accuracy of binary classification. . . 32
AANN Auto-associative neural network
ACH Agglomerative concentric hypersphere
AIC Akaike information criterion
BC Baseline condition
BIC Bayesian information criterion
BMS Bridge management system
DC Damaged condition
DI Damage indicator
EM Expectation-maximization
FA Factor analysis
FN False negative
FP False positive
FPR False-positive rate
GA Genetic algorithm
GADBA Genetic algorithm for decision boundary analysis
GKPCA Greedy kernel principal component analysis
GMM Gaussian mixture model
KPCA Kernel principal component analysis
MA Memetic algorithm
MCMC Markov-chain Monte Carlo
ML Maximum likelihood
PCA Principal component analysis
PDF Probability density function
PSO Particle swarm optimization
RBF Radial basis function
ROC Receiver operating characteristic
SHM Structural health monitoring
SPR Statistical pattern recognition
SSI Stochastic subspace identification
SVD Singular value decomposition
SVDD Support vector data description
SVM Support vector machine
TN True negative
TP True positive
In the structural health monitoring (SHM) field, vibration-based damage identification has become a crucial research area due to its potential to be applied in real-world engineering structures. Assuming that the vibration signals can be measured by employing different types of monitoring systems, when one applies appropriate data treatment, damage-sensitive features can be extracted and used to assess early and progressive structural damage. However, real-world structures are subjected to regular changes in operational and environmental conditions (e.g., temperature, relative humidity, traffic loading and so on) which impose difficul-ties to identify structural damage as these changes influence different features in a distinguish manner. In this thesis by papers, to overcome this drawback, novel output-only methods are proposed for detecting and quantifying damage on struc-tures under unmeasured operational and environmental influences. The methods are based on the machine learning and artificial intelligence fields and can be classified as kernel- and cluster-based techniques. When the novel methods are compared to the state-of-the-art ones, the results demonstrated that the former ones have better damage detection performance in terms of false-positive (ranging between 3.6–5.4%) and false-negative (ranging between 0–2.6%) indications of damage, suggesting their applicability for real-world SHM solutions. If the proposed methods are compared to each other, the cluster-based ones, namely the global expectation–maximization approaches based on memetic algorithms, proved to be the best techniques to learn the normal structural condition, without loss of information or sensitivity to the initial parameters, and to detect damage (total errors equal to 4.4%).
No campo da monitorização de integridade estrutural (SHM), a identifi-cação de dano baseada em vibração tem se tornado uma área de pesquisa crucial devido a sua potencial aplicação em estruturas de engenharia do mundo real. As-sumindo que os sinais de vibração podem ser medidos pelo emprego de diferentes tipos de sistemas de monitorização, quando aplica-se o tratamento de dados ade-quado, as características sensíveis a dano podem ser extraídas e usadas para avaliar dano estrutural incipiente ou progressivo. Entretanto, as estruturas do mundo real estão sujeitas às mudanças regulares nas condições operacionais e ambientais (e.g., temperatura, umidade relativa, massa de tráfego e outros), as quais impõem dificul-dades na identificação do dano estrutural uma vez que essas mudanças influenciam diferentes características de forma distinta. Nesta tese por agregação de artigos, a fim de superar essa limitação, novos métodos output-only são propostos para de-tectar e quantificar dano em estruturas sob influências operacionais e ambientais não medidas. Os métodos são baseados nos campos de aprendizagem de máquina e inteligência artificial e podem ser classificados como técnicas baseadas em kernel e clusterização. Quando os novos métodos são comparados àqueles do estado da arte, os resultados demonstraram que os primeiros possuem melhor performance de detecção de dano em termos de indicações de dano falso-positivas (variando entre 3,6–5,4%) e falso-negativas (variando entre 0–2,6%), sugerindo potencial aplicabili-dade em soluções práticas de SHM. Se os métodos propostos são comparados entre si, aqueles baseados em clusterização, nomeadamente as abordagens de expectância– maximização global via algoritmos meméticos, provaram ser as melhores técnicas para aprender a condição estrutural normal, sem perda de informação ou sensibili-dade aos parâmetros iniciais, e para detectar dano (erros totais iguais a 4,4%).
1 Introduction
1.1
Research context
Engineering structures such as aircraft, buildings, roads, railways, bridges, tun-nels, dams, power generation systems, rotating machinery and offshore oil platforms are present and play a crucial role in modern societies, regardless of geographical location or economical development. The safest, economical and most durable structures are those that are well managed and maintained. Health monitoring represents an important tool in management activities as it permits one to identify early and progressive structural damage (FARRAR; WORDEN, 2007). The massive data obtained from monitoring must be transformed in meaningful information to support the planning and designing mainte-nance activities, increase the safety, verify hypotheses, reduce uncertainty and to widen the knowledge and insight concerning the monitored structure.
1. Is the damage present in the system (detection)?
2. Where is the damage (localization)?
3. What kind of damage is present (type)?
4. What is the extent of damage (severity)?
5. How much useful lifetime remains (prognosis)?
Detection
Localization Type
Severity
Prognosis
Diagnosis
Level 5
Level 4
Level 3
Level 2
Level 1
Figure 1 – Hierarchical structure of damage identification (FIGUEIREDO, 2010).
Usually, the answers to the aforementioned questions can be made in a sequential manner. For example, the answer to the severity of damage can be made with a priori knowledge of the type of damage. Note that damage prognosis at step five can not be accomplished without an understanding of the damage accumulation process. For further discussion on the concept of damage prognosis, one should see (FARRAR; J.LIEVEN, 2007). Even though the damage identification hierarchy is composed of five levels, this thesis poses the SHM process mostly in the context of the first level (damage detection) and, for some extent, the fourth level is also addressed through damage quantification.
for damage identification. These algorithms can be applied in supervised or unsupervised learning (WORDEN; MANSON, 2007).
In the SHM field, supervised learning refers to the case where data from undam-aged and damundam-aged conditions are available to train the algorithms. When applied in a supervised manner and coupled with physics-based models, the algorithms can be used to better determine the type of damage, the severity of damage, and the remaining useful life-time. Unsupervised learning refers to the case where training data are only available from the undamaged condition. When applied in an unsupervised manner, machine learning algorithms are typically used to answer questions regarding the detection and localization. Nevertheless, in certain cases, it can also perform relative quantification of damage. Note that for high capital expenditure structures where the SHM systems are applied, such as most civil infrastructure, the unsupervised algorithms are often required because only data from the undamaged condition are normally available (FARRAR; WORDEN, 2013). Several unsupervised methods have been proposed to detect structural damage by combining pattern recognition and machine learning (FIGUEIREDO et al., 2011; TORRES-ARREDONDO et al., 2014; SANTOS et al., 2016). This combination is of-ten accomplished through a phase of a statistical pattern recognition (SPR) paradigm that establishes two steps:
1. Learn a model which comprises undamaged data from the normal structural condi-tion, considering nearly all operational and environmental influences.
2. Test the learned model by classifying new undamaged or damaged data, i.e., assess-ing the actual condition of the monitored structure.
It is important to emphasize that, currently, most of the techniques used in the SPR are output-only, i.e., only the damage-sensitive features (often derived from vibration response measurements (CARDEN; FANNING, 2004)) need to be measured, not the operational and environmental parameters.
1.2
Motivation
The motivations of this study are related to economic and safety considerations. The complete transition of the SHM technology from research to practice depends deeply on the economical and life safety benefits it can provide (CHANG; FLATAU; LIU, 2003). Besides the main goal to prevent catastrophic failures and the usefulness to evaluate the structure performance, as any investment, the SHM systems must prove to be a manner of reducing the overall life-cycle maintenance costs related to a structure. For example, currently for new bridges, the initial investment of an SHM system ranges between 0.5% and 3% of the total bridge construction cost. Additionally, every year the maintenance and data management typically add 5–20% of the SHM system cost. Thereby, over the first 10 years of a medium-size bridge, the SHM system may require an investment in the order of 4.5–9% of the total construction cost (INAUDI; MANETTI; GLISIC, 2009).
In the light of the above cost estimates, an SHM system must be designed as an integrated system that can be developed and maintained during the construction stage, as well as over the structure lifetime. During the construction stage, the SHM system can potentially be used to supervise the construction and thus put pressure on the contractors to deliver a high-quality product, as well as to support the construction of new lightweight structures. Monitoring during service stage provides information related to structural behavior under predicted loads (also registers the effects of unpredicted overloading). For instance, overviews of the motivations to deploy the SHM systems on bridges are well discussed by several authors (KO; NI, 2005; MAGALHAES; CUNHA; CAETANO, 2012; FIGUEIREDO; MOLDOVAN; MARQUES, 2013; YAPAR et al., 2015).
Therefore, the data obtained by monitoring are useful for damage detection, evalu-ation of safety and determinevalu-ation of the residual capacity of structures. Incipient damage detection via robust data-based methods – the main goal of this thesis – is particularly im-portant because it leads to appropriate and timely interventions, avoiding refurbishment costs or, in some cases, the closure, dismantling and even collapse of structures.
Figure 2 – Structural collapses in Brazil (from left to right): the Guararapes Battle Viaduct (Minas Gerais, 2014), the Bridge over the Aracatú River (Pará, 2014), and the Bridge over the Santo Antônio River (Mato Grosso do Sul, 2016).
To summarize, even though the main goal of the SHM systems is for incipient dam-age identification and, ultimately, to prevent catastrophic failures, from a more general perspective, these systems can be designed to:
1. Provide structural monitoring during the construction stage with the potential ben-efit of reducing manufacturing costs and to permit the construction of lightweight structures by fully exploiting the material strength;
2. Validate design assumptions by measuring the actual structural response, which can be used to improve design specifications for future structures;
3. Detect anomalies and/or damage at early stages;
4. Reduce and/or support visual inspections;
5. Provide the owners with a real-time tool to support the decision-making process, i.e., reduce unnecessary ad hoc maintenance, extend the structures’ lifetime by pre-ventive maintenance, and reduce downtime costs, traffic management and control;
6. After extreme events, such as earthquakes and blast loading, the SHM systems can be used for condition assessment regarding the integrity of the structure;
7. Finally, the main goal to deploy the SHM systems in engineering structures will always be to prevent catastrophic failures.
1.3
Problem
Through the monitoring of damage-sensitive features over time structural damage can be detected. However, in real-world SHM applications, this approach requires some precaution to be applied because of two drawbacks. Firstly, many features are not mea-sured directly, instead they are estimated from monitoring data using feature extraction techniques. Natural frequencies, for example, can be estimated from vibration response measurements, such as accelerations, which may introduce estimation errors. Secondly, almost all features are sensitive not only to changes caused by structural damage but also to changes in temperature, traffic loading, wind speed or relative humidity. These prob-lems highlight that, in practical SHM solutions, the accuracy of the estimated features and the operational and environmental variability should be accounted for. In this thesis, the main focus is on the second problem.
When the environmental variability on features is considered, an important issue is that the changes in environmental conditions are much slower than the lowest struc-tural eigenperiod for fixed conditions (REYNDERS; WURSTEN; ROECK, 2014). If a structure is monitored for a short period of time (seconds or minutes), it acts as a linear time-invariant system. This structural dynamics behavior may change when a long-term monitoring (hours, days, months or years) is performed, i.e., becomes a time-varying sys-tem. The variations in temperature can be pointed out as the main cause for this change, due to the nonlinear temperature-stiffness relationships of structural materials.
One of the main real examples presented in literature is the long-term monitoring performed in the Z-24 Bridge, subjected to environmental variability (ROECK, 2003). The damage-sensitive features extracted from vibration response measurements of the Z-24 Bridge were natural frequencies which combine one-year monitoring of the healthy condition, influenced by operational and environmental variability, with realistic damage scenarios. As demonstrated in Figure 3, the first 3470 observations correspond to the features extracted within the undamaged condition under operational and environmental variability. The last 462 observations correspond to the damage progressive testing period, which is highlighted, especially in the second frequency, by a clear decay in the magnitude of this frequency.
1 3470 3932 4
5 6 7 8 9 10 11 12
Observations
Frequency (Hz)
BC − Baseline Condition DC
Temperature (
°
C)
−5 0 5 10 15 20 25 30
Figure 3 – Influence of temperature on the first four natural frequencies of the Z-24 Bridge: 1–3470 baseline condition (BC) and 3471–3932 damaged condition (DC).
Currently, there are two data-driven approaches to separate changes in features caused by operational and environmental influences from those caused by damage. The first approach, also known as input-output, consists of measuring the parameters related to operational and environmental variations, such as traffic loading, temperature, wind speed or relative humidity, as well as the structural response at different locations. Then, a data-driven (or black-box) model can be identified with these parameters as inputs and the corresponding features as outputs, i.e., the features corresponding to the normal con-dition can be parametrized as a function of the measured operational and environmental conditions (PEETERS; ROECK, 2001; NI et al., 2005). However, a major challenge with this approach is to determine which operational and environmental influences should be measured and where the corresponding sensors should be placed.
1.4
Related work
In this section, by considering output-only approaches and unsupervised learning, the state-of-the-art machine learning algorithms and their adaptations for data normal-ization and damage detection are reviewed and discussed.
1.4.1
Classical methods
Mahalanobis squared-distance (MSD) algorithm is one of the most classical meth-ods for damage detection, having widespread use in real scenarios due to its ability to identify outliers (WORDEN et al., 2007; WORDEN; MANSON, 2007; NGUYEN; CHAN; THAMBIRATNAM, 2014; ZHOU et al., 2015). When abnormal observations appear sta-tistically inconsistent with the rest of the data, it is conjectured that these observations have been generated by an alternative mechanism, which is not related to the normal condition established with a mean vector and a covariance matrix derived from the base-line data sets, obtained under operational and environmental conditions. However, when nonlinearities are present in the undamaged observations, the MSD fails in modeling the normal condition of a structure because it assumes the baseline data modeled by an unique cluster from a multivariate Gaussian distribution.
Kullaa (KULLAA, 1993) proposed to use the factor analysis (FA) algorithm in SHM to eliminate the effects of operational and environmental variations on the damage-sensitive features. Statistically, FA is a multivariate technique used to estimate the linear correlation among a number of observed dependent variables (features) in terms of a small number of unobserved independent variables (or operational and environmental factors). The main challenge associated with the FA-based method is the supposition, in advance, of the number of factors that influence the damage-sensitive features (DERAEMAEKER et al., 2008). Similar to the MSD, this method can not address satisfactorily nonlinearities present in the monitoring data.
In turn, Ruotolo and Surage (RUOTOLO; SURACE, 1999) proposed an output-only data normalization method based on the singular value decomposition (SVD) algo-rithm. This technique relies on the determination of the rank of a state matrix. If the potential outlier comes from the undamaged condition, it is expected that the rank will not change. On the other hand, if the potential outlier comes from the damaged condition, and it is independent from the others, the rank will be increased. However, when dealing with real-world monitoring data, noise is often present, which may affect the rank and introduce residual singular values (VANLANDUIT et al., 2005).
and environmental factors is estimated and model residuals are then produced to sup-port the damage detection (YAN et al., 2005a; SHAO et al., 2014). In practice, however, for long-term monitoring this relationship is in general nonlinear (PEETERS; ROECK, 2001; PEETERS; MAECK; ROECK, 2001; MOSER; MOAVENI, 2011), demanding other techniques to address this issue.
As an alternative, a piecewise linear relationship between the observed features can be determined by clustering and subsequently the linear PCA is applied for each piece (YAN et al., 2005b; KULLAA, 2006). Unfortunately, this method has narrow applicability because its parameters (e.g., number of nonlinearity tuning points) should be chosen with great care, without an effective criterion, to obtain acceptable results.
In an attempt to accommodate nonlinear environmental effects for improving the feature discrimination process, an auto-associative neural network (AANN), also known as autoencoder, has been proposed (SOHN; WORDEN; FARRAR, 2002; HSU; LOH, 2010; HAKIM; RAZAK, 2014). Leaving aside the sensitivity of neural networks to the initial weights, the AANN suffers with the definition of its architecture composed of three differ-ent layers, for which several combinations concerning the number of neurons and initial weights must be performed to select the best model via an information criterion. Similar to the FA, this technique previously assumes the number of factors (usually unknown) that influence the damage-sensitive features.
Figueiredo et al. (FIGUEIREDO et al., 2011) performed a comparison study of several output-only machine learning algorithms for data normalization and damage de-tection on standard data sets. This study was performed upon experimental vibration monitoring tests in the laboratory using a three-story frame structure with different struc-tural state configurations. The operational and environmental effects were simulated by stiffness or mass changes, while damage was simulated with a bumper mechanism causing a nonlinear effect due to collisions. The four output-only methods chosen were based on the MSD, FA, SVD and AANN algorithms. A prominence of the MSD and AANN al-gorithms was attested when one wants to minimize false-negative indications of damage, i.e., life-safety is the primary motivation for deploying SHM systems. However, as those data sets were acquired in laboratory conditions, further analysis is required to test their applicability on real-world data sets.
1.4.2
Kernel-based methods
Khoa et al. (KHOA et al., 2014) adapted the one-class SVM algorithm for learning the normal structural condition and detecting possible structural anomalies. This unsuper-vised method finds a small hyperplane, containing most of the undamaged observations and the anomalies elsewhere, by mapping observations into a high-dimensional feature space using a kernel and thereafter separating them from the origin with maximum mar-gin. However, in this study, the parameters related to the bandwidth of the kernel and regularization should be provided by the user, i.e., there is no heuristic to automatically define these parameters, which naturally influence the quality of the results.
As a nonlinear version of the PCA, the kernel principal component analysis (KPCA) has been used for data normalization in changing operational and environmental condi-tions (OH; SOHN; BAE, 2009; CHENG et al., 2015; YUQING et al., 2015), revealing the nonlinear correlations present in the extracted features through a nonlinear mapping from an original space into a possible very high-dimensional space. After the nonlinear projection, the linear PCA is applied in the mapped feature space to retain the principal components that explain the variability in the data. In opposition to the AANN, as a kernel function is used, the type of nonlinearity is not explicitly defined and the KPCA is computationally very robust and efficient. However, again, this version of KPCA requires the specification by the user of two crucial parameters; the bandwidth of the kernel and a minimal percentage of the variance to explain the variability in the data, i.e., the number of principal components retained in the high-dimensional feature space.
1.4.3
Cluster-based methods
Linear output-only methods to model nonlinearities in long-term monitoring of structures have been developed by means of a new concept based on a two-step strategy (FIGUEIREDO et al., 2012): (i) data normalization procedure by clustering the training observations into different data clusters and (ii) damage detection by identifying possible outliers through a distance metric between the learned clusters and a new observation.
In the study performed by Figueiredo and Cross (FIGUEIREDO; CROSS, 2013), an approach based on Gaussian mixture models (GMMs) is applied to model the main clusters that correspond to the normal or undamaged state conditions of a structural system, even when it is affected by unknown operational and environmental effects. The parameters of the GMMs are estimated from the training data, using the classical maxi-mum likelihood (ML) estimation based on the expectation-maximization (EM) algorithm. Afterwards, the damage detection is performed on the basis of multiples MSD algorithms regarding the chosen clusters of main states. This method outperforms the MSD, AANN and PCA algorithms for damage detection when nonlinear environmental effects are pre-sented in the measured vibration data from the Z-24 Bridge. However, the performance of the EM algorithm was shown to be strongly affected by the initial parameters.
The drawback highlighted above is also discussed by Kulla (KULLAA, 2014), where an approach, composed of GMMs, local linear models using minimum mean square error, PCA and control charts, is used to eliminate the underlying effects and detect damage from the residuals between the monitoring data and the identified model. The main disadvantages are: the EM algorithm is not guaranteed to find the global maximum; and the training phase is quite slow because it is advised to run this algorithm a couple of times with different initial parameters to find, without any guarantee, a satisfactory maximum. In consequence, this degenerated behavior of the EM algorithm may affect the stability of the results and the number of data clusters estimated for each different run.
1.5
Justification
In the above section, the advantages and limitations of several output-only meth-ods (some of them are presented in more detail in subsection 2.5.1) were discussed in the context of data normalization and damage detection for SHM. In general, the methods based on nonlinear or cluster assumptions were most prominent to deal with challenging SHM scenarios under operational and environmental variability. However, these state-of-the-art techniques have some limitations related to their working principles, such as some loss of information (e.g., the PCA, FA, KPCA and AANN) or high sensitivity to the chosen initial parameters (e.g., the EM-GMM and MC-GMM). This fact highlights the need for novel methods, as the ones proposed in this study, to overcome these limitations. Thus, novel output-only methods based on the machine learning and artificial in-telligence fields are proposed to detect incipient or progressive structural damage. These techniques allow to learn the undamaged condition of a structure by considering all nor-mal variability, without loss of information or sensitivity to the initial parameters. Since this undamaged model is determined, the proposed methods can discriminate the actual condition of the structure (i.e., undamaged or damaged) with high stability and reliability. The improvement on the estimation of the normal condition and damage detection provided by the development of these new methods is critical for current SHM solutions, as much attention has been paid on the declining state of the aging infrastructure around the world. This concern applies not only to civil infrastructures, such as bridges, high-ways, and buildings, but also to other types of structures, such as aircraft. The ability to continuously assess the integrity of engineering structures in real time offers the opportu-nity to reduce maintenance and inspection costs, while providing increased safety to the public. Addressing these issues is the goal of this thesis.
1.6
Objectives
In the hierarchical structure of damage identification, this thesis addresses the need for robust vibration-based damage detection methods. Therefore, this study is mainly concerned with detection of damage in engineering structures. Although locating and assessing the severity of damage are important in terms of estimating the residual lifetime of structures, the complete and reliable detection of damage existence must precede these more detailed damage descriptions. Damage quantification is also a final result provided by the damage detection process.
The general objective of this thesis is to adapt, develop, and apply several output-only methods for statistical modeling and feature classification, in the context of the SPR paradigm for SHM, capable of detecting and quantifying damage on structures under unmeasured operational and environmental influences. To achieve this general objective, particular objectives are addressed:
∙ Adapt unsupervised algorithms from the machine learning field as data normaliza-tion approaches, combining them with statistical distance metrics as a means of detecting and quantifying structural damage;
∙ Develop novel output-only methods based on the machine learning and artificial intelligence fields to establish the normal condition of structures and detect damage under operational and environmental conditions, such that these approaches can be applied to engineering infrastructure of arbitrary complexity;
∙ To test the performance of adapted and novel methods, as well as to compare them to state-of-the-art methods, the approaches are first applied on standard data sets measured from a laboratory structure and afterwards on response data from real-world structures – the Z-24 and Tamar Bridges.
Note that the novel output-only methods developed in this study can be applied in any (e.g., civil, mechanical or aerospace) engineering structure. However, the data sets available to test the damage detection performance of these methods are only from civil engineering infrastructures.
1.7
Original contributions
In Appendices A and E, several machine learning algorithms based on kernel as-sumptions are adapted to work as data normalization procedures to support damage detec-tion and quantificadetec-tion via statistical distance metrics. The methods are based on the one-class SVM, support vector data description (SVDD), KPCA, greedy KPCA (GKPCA), and mean shift clustering (MSC) algorithms.
Particularly, in Appendix A, the main contribution is the adaptation of the pro-posed kernel-based algorithms for damage detection. Specifically, other contributions are: the first-known adaptation of two algorithms (the KPCA and GKPCA) for damage detec-tion in the SHM field; and the combinadetec-tion between other two algorithms (the one-class SVM and SVDD) and an outlier detection method (the MSD) for data normalization purposes in the SHM field. In a different manner, in Appendix E, the MSC-based method is presented to discover the number of clusters that correspond to the normal state con-ditions of a structure. The main contribution is that the method is a nonparametric technique that does not require prior knowledge of the number of clusters and can iden-tify groups of distinct shapes, sizes and density. This reliable estimation enhances the subsequent damage detection process.
Novel nonparametric methods are proposed in Appendices B and F to support the structural damage detection process, in the presence of linear and nonlinear effects caused by operational and environmental variability. A genetic algorithm for decision boundary analysis (GADBA) is described in Appendix B as a technique which searches for an optimal number of clusters in the feature space, representing the main state con-ditions of a structural system. This genetic-based clustering approach is supported by a novel concentric hypersphere algorithm to regularize the number of clusters and mitigate the cluster redundancy. An improved and simplified version of this method is highlighted in Appendix F as an agglomerative clustering procedure, the agglomerative concentric hypersphere (ACH), to automatically discover the optimal number of clusters as a means to assist the damage detection and quantification in engineering structures. This straight-forward method does not require any input parameter, except the training data.
produced in different executions by the EM-GMM or MC-GMM approaches.
Furthermore, for the cluster-based methods proposed herein, another contribution is related to the physical interpretations about the undamaged condition under normal variability. The discovered clusters allow a better understanding of the operational and environmental sources of variability, as demonstrated in Appendices E and F.
When the novel methods are compared to the state-of-the-art ones, they clearly demonstrate their superiority in terms of data normalization and damage detection on laboratory and real-world data sets. Nevertheless, a comparison between the proposed methods is imperative to derive more conclusions related to their applicability on real-world SHM applications. This comparison is highlighted in chapter 3 with these methods applied on natural frequencies from the Z-24 Bridge, where a wide spectrum of challenges encountered in practical SHM problems were presented.
1.8
Organization of the thesis
2 Statistical pattern recognition paradigm for
structural health monitoring
This chapter is concerned with the discussion of the SPR-SHM phases, as well as other background issues, presenting the main challenges associated to each phase. Thus, the issues related to operational evaluation and data acquisition are briefly highlighted. Feature extraction techniques used in this study are presented in terms of advantages and limitations. Finally, a major focus is given to the statistical modeling for feature classification: output-only machine learning algorithms for data normalization and damage detection based on residual errors or central Chi-square hypothesis. The methods based on the MSD, PCA, AANN, KPCA and GMMs algorithms are considered, because they are the basis for the understanding of novel methods proposed in this thesis.
2.1
Main objective of the paradigm
In this study, the output-only approaches to SHM presented in section 2.5 are posed in the context of a pattern recognition problem. Thereby, the SPR paradigm for the development of the SHM systems and solutions, SPR-SHM, can be described as a four-phase process (FARRAR; DOEBLING; NIX, 2001), as illustrated in Figure 4.
?
Pr g
h
Undamaged Damaged
Operational Evaluation
Data Acquisition
Feature
Extraction Statistical Modeling for
Feature Classification
t t
t
ν1(t)
ν2(t)
νn(t)
...
X =
φ11
φ21
φ12
φ22 φ2n
φ1n
φpn
φp1 φp2 ... ...
...
... ... ... ...
In the context of the SHM applications, the main objective of the SPR paradigm is to recognize and distinguish between the patterns related to an undamaged structure under operational and environmental influences and those associated to the same struc-ture under the damaged condition. This process starts from sensor measurements of the monitored structure and ends with the assessment of the actual structural condition.
2.2
Operational evaluation
An important first phase for developing the SHM capability is to perform an operational evaluation. This part of the SHM process attempts to answer four essential questions regarding the implementation of an SHM system (FARRAR; WORDEN, 2007):
∙ What are the life safety and/or economic justifications for monitoring the structure?
∙ How is damage defined for the structural system being monitored?
∙ What are the operational and environmental conditions under which the structural system of interest operates?
∙ What are the limitations on acquiring data in the operational environment?
The operational evaluation phase defines, and to the greatest extent possible quan-tifies, the damage that should be identified. It also establishes the benefits to be gained from the deployment of the SHM system. This process also begins to impose limitations on what will be monitored and how to perform this task, as well as adapting the SHM system to the unique aspects of the chosen structure and unique characteristics of the damage that should be identified and analyzed.
The main challenges of the operational evaluation phase are presented in the fol-lowing:
∙ Most high-capital-expenditure engineering structures, such as bridges, are one-of-a-kind systems, influenced by the physical environment where they are built; there-fore, it is more difficult to incorporate lessons learned from other nominally similar structural systems to define anticipated damage;
∙ Structural designs are often driven by low-probability, but extreme-impact events, such as earthquakes, hurricanes, terrorist actions or floods;
∙ There is no widely accepted procedure yet to demonstrate the rate of return of the investment in an SHM system.
2.3
Data acquisition
The data acquisition phase of the SHM process, based on the SPR paradigm, involves selecting the excitation methods; the sensor types, numbers, and locations; and the data acquisition/storage/processing/transmittal hardware. The interval at which the data should be collected (e.g., daily or hourly) is another consideration that must be addressed. The actual implementation of the data acquisition systems is application-specific, where economic issues play a fundamental role in making the aforementioned choices (GLISIC; INAUDI, 2007).
A crucial premise regarding sensing and data acquisition is that these systems do not measure damage. Rather, they measure the response of a structure to its operational and environmental conditions or the response to inputs from actuators embedded with the sensing system (WORDEN; DULIEU-BARTON, 2004). Depending on the sensing technology and the type of damage to be identified, the sensor readings may be more or less directly correlated to the presence and location of damage. Data interrogation proce-dures (feature extraction and statistical modeling for feature classification) are necessary components of an SHM system. They convert the sensor data into information about the structural condition. Moreover, to achieve successful SHM, the data acquisition systems have to be developed in conjunction with these procedures.
The main challenges of the data acquisition phase are listed below:
∙ Currently, there is no sensor that measures damage. However, it is not possible to implement the SHM process without sensing;
∙ Definition of the data to be acquired and the data to be used in the feature extraction process: types of data to be acquired, sensor types and locations, bandwidth and sen-sitivity (e.g., dynamic range), data acquisition/transmittal/storage system, power requirements (e.g., energy harvesting), sampling frequencies, processor/memory re-quirements, excitation source (e.g., active sensing), and sensor diagnostics;
∙ Ruggedness of sensors. Sensing systems must last for many years with minimal maintenance. The existence of harsh environments (e.g., thermal, mechanical, mois-ture, radiation, and corrosion) compromises the sensor durability. Need of sensor diagnostic capability;
∙ The sensing system must be developed integrally with the feature selection and extraction as well as feature classification.
2.4
Feature extraction
A damage-sensitive feature is some quantity extracted from the structural re-sponse data which is correlated with the presence of damage in a structure, such as modal parameters (REYNDERS, 2012), quasi-static strains (GLISIC; INAUDI, 2012), auto-regressive model parameters and residual errors (FIGUEIREDO et al., 2011), lo-cal flexibilities (REYNDERS; ROECK, 2010), and electromechanilo-cal impedances (BAP-TISTA; FILHO; INMAN, 2012). Ideally, a damage-sensitive feature will change in some consistent manner as the level of damage increases. Identifying features that can accu-rately distinguish a damaged structure from its undamaged condition is the focus of most SHM technical literature. Fundamentally, the feature extraction process is based on fitting some model, either physics- or data-based, to the measured response data. The param-eters of the models, or the predictive errors associated with them, become the damage-sensitive features. An alternative approach is to identify features that directly compare the sensor waveforms (e.g., influence lines and acceleration time series) or spectra of these waveforms (e.g., power spectra density) measured before and after damage. Many of the features identified for impedance- and wave propagation-based SHM studies fall into this category (KESSLER; SPEARING; SOUTIS, 2002; PARK HOON SOHN; INMAN, 2003; IHN; CHANG, 2004; SOHN et al., 2004).
In the feature extraction phase, it is imperative to derive damage-sensitive features correlated with the severity of damage present in a monitored structure, minimizing false judgements in the following classification phase. Nevertheless, in real-world SHM appli-cations, operational and environmental effects can mask damage-related changes in the features as well as alter the correlation between the magnitude of the features and the level of damage. Commonly, the more sensitive a feature is to damage, the more sensitive it is to changing in the operational and environmental conditions (e.g., temperature or wind speed). To overcome this impact, robust feature extraction procedures are usually required (MATTSON; PANDIT, 2006; FIGUEIREDO et al., 2010; FIGUEIREDO, 2010) and the primary properties of damage-sensitive features are defined as follows:
∙ Sensitivity – a feature should be sensitive to damage and completely insensitive to
∙ Dimensionality – a feature vector should have the lowest dimension without
signif-icant loss of information; high dimensionality induces undesirable complexity into the statistical models and storage mechanisms.
∙ Computational requirements – minimal assumptions and minimal processor cycles,
which facilitates the embedded systems.
∙ Consistency – feature’s magnitude should change monotonically with damage level.
One wants to use the simplest feature to distinguish between the undamaged and damaged conditions of a structure. However, there are a couple of challenges for feature selection and extraction, as described below:
∙ Feature selection is still based almost exclusively on engineering judgement;
∙ Quantifying the features’ sensitivity to damage;
∙ Quantifying how the feature changes with the level of damage;
∙ Understanding how the feature varies with changing operational and environmental conditions.
For completeness, this section briefly reviews the theory behind of some of the widely feature extraction techniques used in different engineering fields, based on time and frequency domain analysis. It is shown that the appropriate sort of feature to use is damage-specific, and so each feature has its advantages and limitations regarding its sensitivity to a particular type of damage. Notice that this section intends to summarize some advantages and limitations of the feature extraction techniques used in this thesis, rather than showing all possible techniques presented in the SHM literature.
2.4.1
Modal parameters
The most prominent dynamic system identification techniques for modal analysis are: classic and reference-based stochastic subspace identification (SSI), considering both data-driven and covariance-driven versions (PEETERS; ROECK, 1999); SSI with vari-ance estimation (REYNDERS; PINTELON; ROECK, 2008); classic and reference-based combined deterministic-SSI (REYNDERS; ROECK, 2008); and frequency response func-tion (GUILLAUME; PINTELON; SCHOUKENS, 1992; SAMPAIO; MAIA; SILVA, 1999; MAIA et al., 2003). Depending on the system identification method used, the modal parameter estimation can be performed, for instance, via peak picking or stabilization diagram strategy (PEETERS, 2000; REYNDERS; HOUBRECHTS; ROECK, 2012).
The applicability of the modal parameters as damage-sensitive features is subject to the operational and environmental variability, which may cause changes in the modal parameters and mask the changes resulting from damage (KIM et al., 2003; XIA et al., 2006; SOYOZ; FENG, 2009). Additionally, in many cases, modal parameters do not have the required sensitivity to small cracks in a structure (FARRAR; DOEBLING, 1997).
2.4.2
Autoregressive model
Usually, for various applications in the SHM field, the modal parameters have been used as features that characterize the global condition of structures. However, in this study, the AR model can also be used to extract damage-sensitive features, because the underlying linear stationary assumption makes it possible to detect the presence of damage state conditions as nonlinearities in the time-series. It is considered that in a structural system where different dynamics are present at different times, the estimated parameters should change between intervals (KANTZ; SCHREIBER, 2003).
Alternatively, the AR models have been also used in the SHM field to extract damage-sensitive features from time-series data, either using the model parameters or residual errors (FIGUEIREDO et al., 2011; YAO; PAKZAD, 2012). For a measured time-series �1, �2, ..., �N the AR(�) model of order� is given by:
�i = p ︁
j=1
ãj�i−j +�i, (2.1)
and number of estimated parameters. In the context of AR models:
AIC =�tln(�) + 2�p, (2.2)
where �p is the number of estimated parameters, �t is the number of predicted data points, and � = ���/�t is the average sum-of-square residual (���) errors. The AR model with the lowest AIC value gives the optimal order �.
The appropriate order estimation of an AR model remains a very complex issue. A high-order model may better fit the training data, but may not generalize well to other test data sets. On the other hand, a low-order model may not necessarily capture the underlying physical system dynamics.
2.5
Statistical modeling for feature classification
The development of statistical models to enhance the damage detection process is the phase concerning the implementation of machine learning algorithms to normalize the monitoring data and to analyze the distributions of the extracted features in an effort to determine the structural condition. Even though several statistical modeling approaches have been proposed in the literature, this section only makes reference to the state-of-the-art ones used in this study. Herein, the unsupervised algorithms described in subsection 2.5.1 are used for outlier detection based on residuals errors or central Chi-square hypothesis. Additionally, the performance evaluation of feature classification for damage detection is described on the basis of Type I/Type II error tradeoffs.
2.5.1
Machine learning algorithms for data normalization
The data normalization procedure is fully connected to the data acquisition, fea-ture extraction and statistical modeling phases of the SHM process. This procedure in-cludes a wide range of steps for mitigating (or even removing) the effects of operational and environmental variations on the extracted features. It is also used for separating changes in features caused by damage from those caused by operational and environ-mental influences (SOHN; WORDEN; FARRAR, 2002). This procedure often contributes significantly to the structural damage detection process.
GMMs algorithms are considered, because they are the basis for the understanding of novel methods proposed in Appendices from A to F. These state-of-the-art algorithms are designed and developed in such a way that their performance is improved based on the analysis of normal condition data, i.e, they learn from data acquired under operational and environmental conditions and when the structure is supposed to be undamaged.
Basically, these output-only methods develop a functional relationship that models how changing operational and environmental conditions influence the underlying distri-bution of the damage-sensitive features (WORDEN; MANSON, 2007). When subsequent features are analyzed with these methods and a new set of features are shown not to fit into an appropriate distribution, they might be more confidently classified as outliers or, potentially, features from a damaged structure, because the operational and environmen-tal influences have been incorporated into the learning procedure.
Although the methods have different underlying mathematical formulations, they are implemented in a common sequence of steps. First, each algorithm is trained and its parameters are adjusted using features extracted from the normal condition. Second, in the test phase, the methods (with exception of the MSD- and GMM-based ones) transform each new input feature vector into an output residual vector of the same dimension.
For general purposes, one should consider a training data matrix composed of normal condition data, X ∈ Rm×n
, with �-dimensional feature vectors from � different
operational and environmental conditions when the structure is undamaged and a test data matrix, Z ∈ Rl×n
, where � is the number of feature vectors from the undamaged and/or damaged conditions. In this context, a feature vector (or an observation) represents some property of the structural system at a given time.
2.5.1.1 Mahalanobis squared-distance
The Mahalanobis distance differs from the Euclidean distance because it takes into account the correlation between the features and does not depend on the scale of them. Considering the training matrix X with multivariate mean vector, µ, and covariance matrix, Σ, the MSD (or damage indicator, DI, in the context of this study) between the feature vectors of the training matrix and any new feature vector (or observation) from the test matrix Z is defined as (WORDEN; MANSON; FIELLER, 2000)
d2 = (z
⊗µ)T Σ−1
(z⊗µ). (2.3)
with operational and environmental variability, this feature vector is closer to the mean of the normal condition.
2.5.1.2 Principal component analysis
PCA is a linear method for mapping multidimensional data (input space) into a lower dimension (feature space) with minimal loss of information (JOLLIFFE, 2002). Herein, PCA is used as a data normalization method as follows (YAN et al., 2005a). Assuming the training data matrix X decomposed in the form of
X=TUT =︁n
i=1
tiuTi , (2.4)
where T is the scores matrix and U is a set of � orthogonal vectors, ui, also called the loadings matrix. The orthogonal vectors can be obtained by decomposing the covariance matrix of X in the form of Σ = UΛUT, where Λ is a diagonal matrix containing the ranked eigenvalues Úi, and U is the matrix containing the corresponding eigenvectors. The eigenvectors associated with the higher eigenvalues are the principal components of the data matrix and they correspond to the dimensions that have the largest variability in the data. Basically, this method permits one to perform an orthogonal transformation by retaining only the principal components � (⊘�), also known as the number of factors
(DERAEMAEKER et al., 2008). Precisely, choosing only the first�eigenvectors, the final
matrix can be rewritten without significant loss of information as
X=TrUTr +E= r ︁
i=1
tiuTi +E, (2.5)
where E is the residual matrix resulting by the � factors. The coefficients of the linear
transformation are such that if the feature transformation is applied to the data set and then reversed, there will be a negligible difference between the original and reconstructed data. The� factors can be automatically estimated by test the minimal percentage of the
variance Γ (usually from 0.9 to 0.95) to explain the variability in the matrix X
Γ⊘ r ︁
i=1 Úi,i n ︁
i=1 Úi,i
In the context of data normalization, the PCA algorithm can be summarized as follows: the loadings matrix, U, is obtained from X, the test matrix Z is mapped onto the feature space Rr and reversed back to the original space Rn, the residual matrix E is computed as the difference between the original and the reconstructed test matrix
E=Z⊗(ZUr)UTr. (2.7)
2.5.1.3 Auto-associative neural network
The AANN, also known as nonlinear PCA, is trained to characterize the underlying dependency of the identified features on the unobserved operational and environmental factors by treating this unobserved dependency as hidden intrinsic variables in the network architecture (HSU; LOH, 2010). As illustrated in Figure 5, the AANN architecture consists of three hidden layers: mapping, bottleneck, and de-mapping. The mapping layers consist of hyperbolic tangent sigmoid transfer functions. On the other hand, the bottleneck and output layers are formed with linear transfer functions. More details on the network, including the number of nodes to use, can be found in the reference (KRAMER, 1991).
Mapping function
z
1z
2z
nz
1z
2z
n. . . . ^
^
^ .
. . .
De-mapping function
Mapping layer
Bottleneck layer
De-mapping layer
Output layer
Figure 5 – Standard architecture of the AANN.
that influence the structural response (SOHN; WORDEN; FARRAR, 2002). Second, for the test matrix Z, the residual matrix E reads
E=Z⊗Zˆ, (2.8)
where ˆZcorresponds to the estimated feature vectors that are the output of the network. Assuming that the network is trained with the normal condition data, the residuals will grow when the features which are fed to the network come from the damaged condition, otherwise z≡ˆz(undamaged).
This type of network is related to a nonlinear PCA, where the target outputs are simply the inputs of the network. Thereby, the method presented herein is a mixture of two different learning approaches, i.e., supervised learning is used to quantify the op-erational and environmental conditions dependency although without direct measure of these conditions, while unsupervised learning is used to detect damage. A key issue is to appropriately define the number of nodes in the bottleneck layer, which depends on the independent sources of variability present in the structural response measurements and influences the damage detection performance.
2.5.1.4 Kernel principal component analysis
The KPCA method extends the standard linear PCA for dimensionality reduction in a very high-dimensional space (SCHOLKOPF; SMOLA; MULLER, 1998). This algo-rithm identifies a nonlinear model by fitting it to the features during a phase in which the structure is undamaged. Afterwards, the structure is monitored by comparing the model predictions with the observed features (REYNDERS; WURSTEN; ROECK, 2014).
Basically, for a feature vector �(� = 1,2, . . . , �), the part of the residual that is
uncorrelated with the unknown operational and environmental variability is
ef =U2UT2Φ(zf), (2.9)
where U = [U1 U2] is the eigenvectors matrix partitioned into U1 that contains the � largest eigenvectors and U2 that comprises the (�⊗�) shortest eigenvectors. These
eigenvectors are derived from an eigenvalue decomposition of the mapped output corre-lation during the training phase. A nonlinear mapping of the output sequence, zf, onto a possibly very high-dimensional is represented by Φ(zf).
nearly all normal variability (REYNDERS; WURSTEN; ROECK, 2014). Note that as in KPCA the mapped feature space is very high-dimensional, Γ (or �) might be larger
than the values normally used in linear PCA. The issue of specifying Φ can be derived by considering that there exists an eigenvector matrix A for which
U= ˜ΦA, (2.10)
where
˜
Φ:= √1
�[Φ(x1). . .Φ(xm)]. (2.11)
Therefore, all relevant solutions are contained in the following standard eigenvalue problem (SCHOLKOPF; SMOLA; MULLER, 1998)
KA=AΛ, (2.12)
being Λ a diagonal matrix containing the ranked eigenvalues Úi and K a kernel matrix denoted as
K:= ˜ΦTΦ˜ ∈Rm×m
. (2.13)
In Equation 2.13, the nonlinear mappingΦ only appears in inner products of the form Φ(xi)T Φ(xj). Thus, a kernel function representation for the inner product reads
�(xi,xj) :=Φ(xi)T Φ(xj). (2.14)
The well-known kernel trick consists of specifying the kernel�(xi,xj) instead of the nonlinear mapping Φ, which enables to operate in a very high-dimensional feature space. A radial basis function (RBF) or Gaussian kernel is most often applied, as it implicitly defines an infinite-dimensional feature space with a single parameter
�(xi,xj) = exp ⎠
⊗‖xi⊗xj ‖
2
2à2
⎜
, (2.15)
where à > 0 is the bandwidth of the RBF kernel and can be determined by requiring
that the corresponding inner product matrix Kis maximally informative as measured by Shannon’s information entropy. A detailed step-by-step to choose the optimal value of à
Finally, the Euclidean norm of the residual feature vector ef, which is evaluated with the kernel function only (without carrying out the nonlinear mapping), can be com-puted as (REYNDERS; WURSTEN; ROECK, 2014)
‖ef ‖= ︂
Φ(zf)T ΦA˜ 2AT2Φ˜
T
Φ(zf), (2.16)
being A2 defined by partitioningA in the ranked form of
A= [A1 A2], A2 ∈Rm
×(m−r)
. (2.17)
2.5.1.5 Gaussian mixture models
First, this method carries out a cluster-based model using GMMs that aim to capture the main clusters of features, which correspond to the normal and stable state conditions of a structure, even when it is affected by extreme operational and environ-mental conditions. Afterwards, an outlier detection strategy is implemented in relation to the chosen main groups of states (FIGUEIREDO; CROSS, 2013). Basically, the damage detection is performed on the basis of multiples MSD algorithms, where the mean vectors and covariance matrices are obtained from the learned clusters.
A finite mixture model, �(x♣Θ), is the weighted sum of� >1 clusters�(x♣θq) in Rn (MCLACHLAN; PEEL, 2000),
�(x♣Θ) =
Q ︁
q=1
Ðq�(x♣θq), (2.18)
wherexis an�-dimensional feature vector andÐqcorresponds to the weight of each cluster
� = 1, . . . , �. These weights are constrained to be positive Ðq >0 with ︀Qq=1Ðq = 1. For a GMM, each cluster �(x♣θq) is represented as a Gaussian distribution
�(x♣θq) =
exp⎭⊗1 2
⎞
x⊗µq⎡T Σ−1
q ⎞
x⊗µq⎡
⎨
(2Þ)n/2︁det (Σq)
, (2.19)
being each cluster denoted by the parameters θq = ¶µq,Σq♢, composed of the mean vector µq and the covariance matrix Σq. Thus, a GMM is completely specified by the set of parameters Θ=¶Ð1, Ð2, . . . , ÐQ,θ1,θ2, . . . ,θQ♢.
The EM algorithm is the most common local search method used to estimate the parameters of the GMMs (DEMPSTER; LAIRD; RUBIN, 1977; MCLACHLAN; PEEL, 2000). This method consists of an expectation and a maximization step, which are al-ternately applied until the log likelihood, log�(X♣Θ) = log︀m