M
ASTER
I
N
F
INANCE
M
ASTER
’
S
F
INAL
W
ORK
P
ROJECT
W
ORK
E
QUITY
R
ESEARCH
S
UMOL
+C
OMPAL
S
ARA
J
ULFICARALI
M
ASTER
I
N
F
INANCE
M
ASTER
’
S
F
INAL
W
ORK
P
ROJECT
W
ORK
E
QUITY
R
ESEARCH
S
UMOL
+C
OMPAL
S
ARA
J
ULFICARALI
S
UPERVISOR:
P
ROFESSORI
NÊSP
INTOii ABSTRACT
Sumol+Compal is the leader of non-alcoholic beverages in Portugal and the single Portuguese beverages firm present on the NYSE Euronext Lisbon. Having a market share superior to 25%, the firm focuses on strategies based on innovation and diversification. As a result, the company managed to increase its sales and expand its business, strengthening their footprint internationally.
Through a detailed analysis of the firm and its results, its future goals and strategies, and its industry, this project aims to evaluate Sumol+Compal and determine a fair value of its shares. The valuation used was Free Cash Flow to the Firm (FCFF) method, once according to the literature review, fitted best the company.
From the results obtained in the valuation, it was possible to conclude that Sumol+Compal’s shares are undervaluated. The price quoted at 31 of August 2015 was 1,90€, which is lower than the target price reached of 2,06€.
From 31 of December 2014 to 31 of August 2015, the price rose almost 70%, from 1,13€ to 1,90€. Hence, the recommendation to future investors would be to buy the shares, once they may provide larger returns in the future.
Keywords: Equity Research, Sumol+Compal, Company Valuation, Free Cash Flow to the Firm, Discounted Cash Flows
iii RESUMO
A Sumol+Compal é a líder do setor das bebidas não-alcoólicas, e a única empresa portuguesa de bebidas cotada no índice NYSE Euronext Lisboa. Detendo uma quota de mercado superior a 25%, a empresa foca a inovação e a diversificação como parte da sua estratégia. Desta forma, conseguiu aumentar as suas vendas e expandir o seu negócio, fortalecendo o seu posicionamento internacionalmente.
Através de uma análise detalhada à empresa e aos seus resultados, aos objetivos e estratégias da empresa, e à indústria envolvente, este trabalho pretende avaliar a Sumol+Compal e determinar um preço às suas ações. O método utilizado para a avaliação foi o Free Cash Flow to the Firm (FCFF), uma vez que de acordo com a revisão de literatura, era o método mais adequado à empresa.
Através dos resultados da avaliação, foi possível concluir que as ações da Sumol+Compal estão subavaliadas. O preço a 31 de Agosto de 2015 foi de 1,90€, sendo menor que o preço da avaliação (2,06€).
De 31 de Dezembro de 2014 a 31 de Agosto 2015, o preço subiu quase 70%, de 1,13€ para 1,90€. Desta forma, a recomendação de compra seria dada aos investidores, na medida em que poderiam ter maiores retornos no futuro.
Palavras-chave: Equity Research, Sumol+Compal, Avaliação da empresa, Free Cash
iv ACKNOWLEDGEMENTS
I would like to express my gratitude, firstly to my supervisor, Professor Inês Pinto, for her guidance, support, suggestions and feedback during this project.
To Teresa Caldeira, who gave me a precious help. To her, a special thank you, not only for the availability and critical opinions, but also for the motivation and kindness during all the ER.
To my friends and colleagues, who always supported and motivated me.
And last but not least, to my parents and my family, for their unconditional support, encouragement and understanding, which were essential during the project.
v INDEX 1. Introduction ... 1 1.1 Framework ... 1 1.2 Project Structure ... 1 2. Literature Review ... 2 2.1 Valuation ... 2 2.2 Valuation Methods ... 2
2.2.1 Discounted Cash Flow (DCF) ... 3
2.2.1.1 Firm Valuation Models ... 3
2.2.1.2 Equity Valuation Models ... 8
2.2.1.3 Adjusted Present Value (APV) ... 9
2.2.2 Relative Valuation ... 10
2.2.3 Contingent Claim Valuation ... 12
2.2.4 Asset Based Valuation ... 12
3. Investment Case ... 13
3.1 Company’s Presentation ... 13
3.2 Business Units ... 14
3.3 Future goals and strategic lines ... 14
3.4 Operational Performance ... 15
3.5 Financial Performance ... 17
3.6 Stock Market Performance, Shareholder Structure and Dividends ... 19
3.7 Strategic Analysis... 19
4. Macroeconomic Environment and Industry Sector ... 20
4.1 Macroeconomic Environment ... 20 4.2 Industry Sector ... 23 5. Valuation ... 27 5.1 Methodology ... 27 5.2 Assumptions ... 27 5.2.1 Turnover ... 27 5.2.2 Operational Costs ... 30
5.2.3 Investment in Capital Expenditures and Depreciations and Amortizations ... 30
5.2.4 Working Capital ... 31
vi
5.2.6 WACC ... 32
5.2.6.1 Cost of equity ... 32
5.2.6.1.1 Rf ... 32
5.2.6.1.2 Beta ... 32
5.2.6.1.3 Market Risk Premium ... 33
5.2.6.1.4 Cost of Debt ... 33
5.2.6.1.5 Tax rate ... 34
5.2.6.1.6 Perpetual Growth Rate ... 34
5.3 FCFF and Enterprise Value ... 34
6. Valuation Results ... 35
7. Conclusions ... 36
8. Appendixes ... 42
Appendix 1 - Sumol+Compal Business Units ... 42
Appendix 2 - 5 Porter Forces ... 42
Appendix 3 - Portugal Economic Indicators ... 44
Appendix 4 - Angola Economic Indicators ... 44
Appendix 5 - Mozambique Economic Indicators ... 45
Appendix 6 - GDP of Sumol+Compal Geographical Regions ... 45
Appendix 7 - Inflation of Sumol+Compal Geographical Regions ... 45
Appendix 8 - Sumol+Compal’s Turnover by business segment ... 45
Appendix 9 - Sales growth rate (g sales) ... 46
Appendix 10 - Operating Costs ... 46
Appendix 11 - CAPEX and Amortizations and Depreciations projections ... 46
Appendix 12 - Working Capital projections ... 48
Appendix 13 - Net Debt ... 48
Appendix 14 - Linear Regression between Sumol+Compal and PSI 20 ... 48
Appendix 15 - Market Risk Premium... 49
Appendix 16 - Cost of Debt ... 49
Appendix 17 - WACC Assumptions ... 50
Appendix 18 - Relative Valuation ... 50
Appendix 19 - Sensitivity Analysis ... 52
vii INDEX OF FIGURES
Figure 1 - Largest VAT increase on products ... 16
Figure 2 - Turnover ... 16
Figure 3 - EBITDA (million euros) ... 17
Figure 4 - Financial Gearing ratio ... 18
Figure 5 - Financial Autonomy ratio ... 18
Figure 6 - Net Debt/EBITDA ... 18
Figure 7 - Beverages Sales (billion euros) ... 23
Figure 8 - Evolution of Sales (million euros) ... 24
Figure 9 - Alcoholic Beverages Sales Evolution (billion dollars) ... 24
Figure 10 - Global Soft Drink Market Size (2013) ... 26
INDEX OF TABLES Table 1 - Relative Multiples ... 11
Table 2 - SWOT Analysis ... 19
Table 3 - Percentage of Sales of Sumol+Compal's geographical regions and others ... 28
Table 4 - Business Segments Geographical Presence ... 29
Table 5 - Discounted Cash Flow Statement... 34
Table 6 - Sumol+Compal's Target Price ... 35
INDEX OF EQUATIONS Equation 1 - Free Cash Flow to the Firm ... 4
Equation 2 - Terminal Value ... 4
Equation 3 - WACC rate ... 5
Equation 4 - CAPM formula ... 5
Equation 5 - Beta ... 6
Equation 6 - EVA ... 8
Equation 7 - Dividend Discounted Model: Value per share of stock ... 8
Equation 8 - Dividend Discounted Model: Value of stock... 8
Equation 9 - Free Cash Flow to Equity ... 9
Equation 10 - APV: Value of Unlevered Firm ... 10
Equation 11 - APV: Value of Levered Firm ... 10
Equation 12 - Volume in liters 2015 ... 29
Equation 13 - Working Capital: Inventory ... 31
viii ABREVIATIONS LIST
APT – Arbitrage Pricing Theory APV – Adjusted Present Value CAPEX – Capital Expenditures CAPM – Capital Asset Pricing Model D – Debt
DCF – Discounted Cash Flow DDM – Dividend Discount Model DPS – Dividend per share
E – Equity
EBIT – Earnings before Interest and Taxes
EBITDA – Earnings before Interest, Taxes, Depreciations and Amortizations EPS – Earnings per share
ER – Equity Research EV – Enterprise Value
EVA – Economic Value Added FCFE – Free Cash Flow to Equity FCFF – Free Cash Flow to Firm GGM – Gordon Growth Model g – Growth rate
IMF – International Monetary Fund M&A – Mergers and Acquisitions MRP - Market Risk Premium NYSE – New York Stock Exchange S+C – Sumol+Compal
SWOT – Strengths, Weaknesses, Opportunities and Threats T – Tax rate
TV – Terminal Value VTS – Value of Tax Shields
1 1. Introduction
1.1 Framework
In the past few years, due to the crisis the world is facing, the consumers’ confidence levels and the private consumption decreased. Naturally, so did beverages market suffered from the crisis. Being Sumol+Compal the leader of non-alcoholic beverages in Portugal and the single Portuguese beverages firm present on the NYSE Euronext Lisbon, it became interesting and challenging to analyze how the industry and the company were operating in such environment.
The aim of this project is to evaluate Sumol+Compal and to determine a fair value of its shares. The valuation of a firm consists in a detailed analysis of the company, as well as its industry, future perspectives and strategies.
Sumol+Compal divides its business units in: i) carbonated soft drinks and ice teas; ii) juices, nectars and fruit still drinks; iii) waters; iv) beers; and v) others, which includes canned vegetables. It also commercializes its distribution brands, and is present in every continent, with a stronger footprint in Portugal and Africa.
1.2 Project Structure
The company’s valuation will be divided into several parts. Firstly it will illustrate a literature review. Through academic publications and researches, there will be explained the different methods to evaluate a company, in order to sustain the model chosen to evaluate Sumol+Compal. Secondly, it will be performed an analysis to the company, namely to its business units, future goals and strategies, operational, financial and stock market performances. This will be followed by a macroeconomic study of the main countries where the firm operates, and an industry analysis for the company’s business. Then, the valuation will be made, using some assumptions, where the Free Cash Flow to the Firm (FCFF) will be used. Finally, it will be presented the results, namely the target price, and the recommendations.
2 2. Literature Review
2.1 Valuation
The valuation of a company is the process used to find the true value of the firm. According to Damodaran (2006), valuation can even be seen as the heart of finance. For several years the financial community has been searching for ways to find methods that could result in a fair valuation of the firm (Carvalho das Neves, 2002). This is fundamental, once the different stakeholders may have separate notions of what the value should be. Therefore, this equilibrium is essential. However, finding the perfect method for the search of the fair value has not been as objective as expected.
Valuation applies to multiple areas of finance, namely mergers and acquisitions, corporate finance, or portfolio management. In mergers and acquisitions processes, both buyers and sellers have to perform a valuation of the company since its value can be different for both parties. In corporate finance, it has the purpose of analyzing how investments, financing decisions, dividend policies or strategies of the firm can affect the company’s value (Damodaran, 2006). In portfolio management, the main objective is to look into companies that transact at a lower value in order to have some profits (Damodaran, 2006).
So, despite its relevance, a company’s valuation is subjective, given it must take into account the firm’s and managers’ future prospects and different assumptions (Fernández & Bilan, 2007).
2.2 Valuation Methods
There are various methods to perform a company’s valuation. This is due to the fact that they have different assumptions, despite the common features among them (Damodaran, 2012).
Different authors try to divide the methodologies into groups. This literature review, will follow Damodaran’s perspective, where there are four approaches: Discounted Cash Flow, Relative Valuation, Contingent Claim Valuation and Asset Based Valuation.
3 2.2.1 Discounted Cash Flow (DCF)
DCF analysis is a powerful measure of the attractiveness of a business, being most applied for corporate valuations, investment appraisals, mergers and acquisitions and joint ventures (Arumugam, 2007). According to Damodaran (2002), discounted cash flow valuation is the foundation of the four methodologies, once they all depend on it. It is not only precise but flexible, which makes it one of the most popular approaches for valuing companies or projects (Goedhart, Koller, & Wessels, 2005).
DCF is a summary of cash flows that, adjusted, reveal the present value. This means that a DCF analysis identifies the value of an asset by the present value of the future expected cash flows, discounted at a risk adjusted rate (Arumugam, 2007; Damodaran, 2006), allowing the possibility to reach the intrinsic value.
There are several methodologies for DCF approach, thus, in this literature review, it will be given focus on the main models formed by Damodaran (2006): Firm Valuation Models, Equity Valuation Models, and Adjusted Present Value.
2.2.1.1 Firm Valuation Models
The firm or enterprise valuation models, as its name suggests, has the purpose to determine the total value of the firm. This is accomplished through an analysis to all the cash flows of the firm, discounted at an appropriate rate - the weighted average cost of capital (Damodaran, 2006; Steiger, 2010).
Firm valuation models comprise two major models: Free Cash Flow to the Firm (FCFF) and Economic Value Added (EVA), therefore, this review will expose both.
Free Cash Flow to the Firm (FCFF)
According to Goedhart, Koller, & Wessels (2010), free cash flows are the foundation of the firm valuation models. FCFF is the cash flow resulted by the firm’s core business, before interest payments and after the deductions on investments, taxes, operating costs, capital expenditures, and working capital needs (Arumugam, 2007; Goedhart et al., 2010; Steiger, 2010). According to Damodaran (2006), FCFF is given by:
4
(1)
𝐹𝑟𝑒𝑒 𝐶𝑎𝑠ℎ 𝐹𝑙𝑜𝑤 𝑡𝑜 𝑡ℎ𝑒 𝐹𝑖𝑟𝑚 = 𝐴𝑓𝑡𝑒𝑟 𝑇𝑎𝑥 𝑂𝑝𝑒𝑟𝑎𝑡𝑖𝑛𝑔 𝐼𝑛𝑐𝑜𝑚𝑒 − − (𝐶𝑎𝑝𝑖𝑡𝑎𝑙 𝐸𝑥𝑝𝑒𝑛𝑑𝑖𝑡𝑢𝑟𝑒𝑠 − 𝐷𝑒𝑝𝑟𝑒𝑐𝑖𝑎𝑡𝑖𝑜𝑛𝑠) − 𝐶ℎ𝑎𝑛𝑔𝑒 𝑖𝑛 𝑛𝑜𝑛 𝑐𝑎𝑠ℎ 𝑊𝑜𝑟𝑘𝑖𝑛𝑔 𝐶𝑎𝑝𝑖𝑡𝑎𝑙
Equation 1 - Free Cash Flow to the Firm
Having this, it is clear that to perform the calculation of the future FCFF, a series of procedures must be taken into account. According to Goedhart et al. (2010), firstly, it is required a reorganization of the financial statements, so that it becomes possible a division of the financial structure, the operating and the nonoperating components. Secondly the historical performance analysis is essential in order to examine the firm’s past performance, namely its growth, value, return on invested capital and even its behavior towards their competitors. Then, having all the information above mentioned, it is able to forecast the free cash flows in addition to the company’s growth and return on invested capital.
In order to calculate the Firm Value through this approach, we also need to estimate the terminal value, on which it is assumed a perpetual growth for the company. Finally, it is also needed to determine the weighted average cost of capital (WACC), the rate that the FCFF will be discounted.
Continuing/Terminal Value
The Terminal Value (TV) relies on the assumption of constant growth rates over the time horizon, namely a constant perpetual growth rate, which is given by g. Using as discount rate the WACC, the formula of TV is as follows:
Naturally, the TV must be very precisely calculated, once it gives a perspective of the growth of a company in perpetuity terms. Small changes in the rate used could have a significant impact on the Firm Value, having thus, a serious effect on the DCF valuation (Steiger, 2010). In addition, the constant growth cannot be higher than the economy in which the company is present, since it would be unrealistic (Damodaran, 2002).
Equation 2 - Terminal Value
(2) 𝑇𝑉 = 𝐹𝐶𝐹𝐹𝑇𝑉× (1 + 𝑔)
5
WACC
The calculation of the Firm Value through the FCFF approach, demands that the FCFFs are discounted at an appropriate rate. This rate is given by the weighted average cost of capital (WACC). The WACC is the rate of return expected from investors as a result of the investments made on the firm (Goedhart et al., 2010). It is given by:
Equation 3 - WACC rate
As it can been perceived by the formula above, WACC is computed with Equity (E) and Debt (D), ke and kd, representing cost of equity and cost of debt, and finally T, the tax
rate. From the formula, it is also clear that the cost of debt is reduced by T. - Cost of Equity (ke)
The cost of equity (ke) is the expected rate of return given to investors and it is
considered one of the most difficult valuation component to estimate (Brealey, Myers, & Allen, 2011; Goedhart et al., 2010). According to Goedhart et al. (2010), there are three models that are frequently used to estimate ke, which are the Three Factor
Model (Fama & French, 1993, 1996, 2004), the Arbitrage Pricing Theory model (APT) (Ross, 1976), and lastly, and more common, the Capital Asset Pricing Model (CAPM) developed by Sharpe (1964). This model is the best known and more popular model of the relationship between risk and expected return models (Damodaran, 2002). It relies on the stocks’ returns and reveals the prospects required by investors allying the risk and expected return from a share to the market’s (Arumugam, 2007; Steiger, 2010). It is calculated by:
(4) E(𝑅𝑖) = 𝑅𝑓+ β𝑖 [E(𝑅𝑚) − 𝑅𝑓
Equation 4 - CAPM formula
The market risk premium consists in the difference between the expected return of the market (E(𝑅𝑚)) and the 𝑅𝑓, which will be the same for every company, once they
depend on the market. Contrarily, the beta (βi), represents the stock’s sensitivity to the
market, so, it depends on the company.
(3) 𝑊𝐴𝐶𝐶 = 𝐸
𝐸 + 𝐷× 𝑘𝑒+ 𝐷
6
Risk free rate (Rf)
According to Damodaran (2008, 2012), the risk free rate (Rf) is the risk that allows the
expected returns to be equal to the actual returns. From the author perspective, the investments must fulfill certain requirements in order to be risk free, which consists in the mandatory’s no default and no reinvestment risk components. Therefore, according to the author, the only securities that could match these requirements are the government securities.
Beta (βi)
Beta is the variable that measures the sensitivity of the investment to changes in the market as a whole (Damodaran, 2002). It assumes a strong importance once it gives a perspective not only to the relationship of the risk and return, but also to how it affects the capital structure of the firm (Brealey et al., 2011).
Beta has two major features that should be kept in consideration. On the one hand, it represents a risk measure to a diversified portfolio. This allows a more precise comprehension of the origin of the riskiness in the portfolio, whether individually or market related. On the other hand, beta has the feature of referring the relative risk of the asset (Damodaran, 1999b). The most usual regression used to calculate beta is:
(5) 𝑅𝑖 = ∝ + 𝛽𝑅𝑚+ 𝜀
Equation 5 - Beta
The estimation of beta is highly imprecise, hence there are various perspectives to compute it. Goedhart et al. (2010) states that beta should be estimated by its industry rather than comparing firms, given companies in the same business have operating risks comparable to each other. Since the operating risks do not comprise the financial risks, this beta is entitled as beta unlevered (βu). The major aspect to have in
consideration is leverage, once some companies may have more debt, which could be translated into more risk. For this reason this beta is labeled as beta levered (βl). The
beta levered needs to be calculated, and it can done through the beta unlevered. - Cost of Debt (kd)
The cost of debt, can be estimated through the risk free rate, by adding it to a default spread (Damodaran, 2008).
7
Naturally, this spread will take into account the firm’s credit risk, in order to the analysis to be more accurate.
Another method consists in analyzing a yield to maturity of a long term bond, having in consideration a time horizon that fits the company in question.
- Risk Premium and Market Risk Premium
The risk premium is a key element for firms to evaluate themselves in multiple areas such as corporate finance, valuation or portfolio management (Damodaran, 2012). It constitutes the extra return the investors expect to gain, besides the risk free rate, therefore, it is calculated by the difference between the expected return of the market and the risk free rate (Damodaran, 1999a).
For there to be a positive variation, the stocks have to surpass the performance of bonds, and that implies effects in several areas (Damodaran, 2013; Goedhart et al., 2010). According to Goedhart et al. (2010), there are three ways to estimate the market risk premium. The first one is through the historical risk premium approach, which constitutes the difference between the returns of a certain stock with the returns of a risk free rate during a period of time (annual basis) (Damodaran, 1999a). However, despite its popularity among users, Damodaran (1999a) and Goedhart et al. (2010) concluded that there were disparities in the risk premium estimations, given the differences there could be in asumptions such as time period, risk free rate, among others. The second method consists in using a regression analysis to connect the market variables in order to achieve the market risk premium. To conclude, it could be used a DCF valuation and the current financial ratios.
Economic Value Added (EVA)
EVA is a measure of performance and residual income used by firms in order to achieve the value generated to the shareholders, or, in other words, the net income after the deductions demanded by the investors (Alexei, 2012; Brealey et al., 2011). It evaluates the efficacy of management in a certain year (Brigham & Ehrhardt, 2011). There are several ways used to calculate EVA. One of them is suggested by Alexei (2012) and is given by:
8
(6) 𝐸𝑉𝐴 = 𝐼𝑛𝑐𝑜𝑚𝑒 𝐸𝑎𝑟𝑛𝑒𝑑 − 𝐶𝑜𝑠𝑡 𝑜𝑓 𝐶𝑎𝑝𝑖𝑡𝑎𝑙 × 𝐼𝑛𝑣𝑒𝑠𝑡𝑚𝑒𝑛𝑡
Equation 6 - EVA
2.2.1.2 Equity Valuation Models
The Equity Models focus on shareholders and their spar on the business. This is done by discounting the expected cash flows at a specific rate for the firm’s equity risk (Damodaran, 2006). In this review, it will be presented two of the models: the Dividend Discount Model (DDM) and the Free Cash Flow to the Equity (FCFE).
Dividend Discounted Model (DDM)
According to Damodaran (2006), DDM is considered the oldest discounted cash flow model. The author also states that the fundamental concept of this approach consists in the present value of dividends as follows:
(7) 𝑉𝑎𝑙𝑢𝑒 𝑝𝑒𝑟 𝑠ℎ𝑎𝑟𝑒 𝑜𝑓 𝑠𝑡𝑜𝑐𝑘 = ∑ 𝐸(𝐷𝑃𝑆𝑡)
(1 + 𝑘𝑒)𝑡 𝑡=∞
𝑡=1
Equation 7 - Dividend Discounted Model: Value per share of stock
On Foerster & Sapp (2005) perspective, when it comes to equities, the expected cash flows are usually dividends. The first author to discover this relationship between the dividends and the shares’ value was William (1938). Durand (1957) initially developed the DDM model, which was later studied by Gordon, producing the Gordon Growth Model (GGM). This model considers the same definition previously stated, with the addition of a perpetual growth rate (Foerster & Sapp, 2005; Gordon, 1962).
(8) 𝑉𝑎𝑙𝑢𝑒 𝑜𝑓 𝑠𝑡𝑜𝑐𝑘 = 𝐷𝑃𝑆𝑡
(𝑘𝑒− 𝑔)
Equation 8 - Dividend Discounted Model: Value of stock
According to Damodaran (2012b), by using stable growth rates, firms have to be careful about two aspects. The first one is that the growth rate chosen cannot be higher than the economy’s growth. The second one is based on the expectation of the other variables of the firm to grow at an equal rate as the dividends. This is due to the fact that one can surpass the other, which can disturb the steady state assumption. Despite its popularity and simplicity, the GGM has some limitations. It is extremely sensitive to the assumptions for the growth rate and it is not useful for certain type of firms that do not follow the model characteristics, such as companies who do not pay
9
dividends or have an unstable growth. Moreover, it does not quickly adjust to market or companies with a fast changing pace (Damodaran, 2006), and assumes dividends as cash flows. It also relies on the assumption that the firm will always pay dividends, which is not necessarily true as lots of firms tend to retain the earnings instead of distributing it (Damodaran, 2006).
Free Cash Flow to Equity (FCFE)
The Free Cash Flow to Equity (FCFE) is the amount of cash that should be paid to the equity shareholders, after deducting all the expenses, investments and debt repayment (Damodaran, 2012; Steiger, 2010). It is given by:
(9)
𝐹𝑟𝑒𝑒 𝐶𝑎𝑠ℎ 𝐹𝑙𝑜𝑤 𝑡𝑜 𝐸𝑞𝑢𝑖𝑡𝑦 = 𝑁𝑒𝑡 𝐼𝑛𝑐𝑜𝑚𝑒 − (𝐶𝑎𝑝𝑖𝑡𝑎𝑙 𝐸𝑥𝑝𝑒𝑛𝑑𝑖𝑡𝑢𝑟𝑒𝑠 − 𝐷𝑒𝑝𝑟𝑒𝑐𝑖𝑎𝑡𝑖𝑜𝑛𝑠) − (𝐶ℎ𝑎𝑛𝑔𝑒 𝑖𝑛 𝑛𝑜𝑛 𝑐𝑎𝑠ℎ 𝑊𝑜𝑟𝑘𝑖𝑛𝑔 𝐶𝑎𝑝𝑖𝑡𝑎𝑙) + 𝑁𝑒𝑤 𝐷𝑒𝑏𝑡 𝐼𝑠𝑠𝑢𝑒𝑑 − 𝐷𝑒𝑏𝑡 𝑅𝑒𝑝𝑎𝑦𝑚𝑒𝑛𝑡𝑠)
Equation 9 - Free Cash Flow to Equity
Presenting a similar behavior as DDM, the FCFE method will require the cost of equity discount rate for the calculations.
2.2.1.3 Adjusted Present Value (APV)
The APV approach was first proposed by Myers (1974) and it emerged as a possible substitute for WACC method among some users (Luehrman, 1997b). The APV describes a levered firm value as equal to an unlevered firm value added by a variation due to tax savings (Brigham & Ehrhardt, 2011; Ehrhardt & Daves, 1999).
According to Brigham & Ehrhardt (2011) and Goedhart et al. (2010), APV is able to divide the value of the firm in two: on one side the unlevered operational value of the company, and on the other side the value generated by financing, namely tax shields (VTS). VTS is a result of the tax savings’ present value (Fernández, 2007).
In order to compute APV, there are three steps that, according to Damodaran (2006, 2012b) ought to be followed. The first one is to calculate the unlevered value of the firm. Given it has the postulation of the company being financed fully by equity, it is used the unlevered cost of equity (ρu) and an assumption that the cash flows grow at g.
10
(10) 𝑉𝑎𝑙𝑢𝑒 𝑜𝑓 𝑈𝑛𝑙𝑒𝑣𝑒𝑟𝑒𝑑 𝐹𝑖𝑟𝑚 = 𝐹𝐶𝐹𝐹0(1 + 𝑔)
ρu− g
Equation 10 - APV: Value of Unlevered Firm
The second step is the computation of the value of tax benefits given a certain percentage of debt. Now that being a levered company, the rate used for the calculations is the cost of debt.
The third step is to perform an assessment of the impact that the percentage of debt used previously has on bankruptcy costs and the company’s risk of default. This final procedure is visibly the most difficult one, given that the probability of bankruptcy or bankruptcy costs cannot be immediately calculated. Having all of these, the value of a levered firm through APV method is computed as:
(11) 𝑉𝑎𝑙𝑢𝑒 𝑜𝑓 𝐿𝑒𝑣𝑒𝑟𝑒𝑑 𝐹𝑖𝑟𝑚 = 𝐹𝐶𝐹𝐹0(1 + 𝑔)
ρu− g + 𝑡𝑐𝐷 − 𝜋𝑎𝐵𝐶
Equation 11 - APV: Value of Levered Firm
As mentioned before, for some, APV came as a substitute for WACC methodology, since it can be used either when WACC is applicable and when it is not (Luehrman, 1997a). Some of the assumptions of WACC that constitute limitations are corrected by APV (such as fixed debt ratio and financial side effects), resulting in a model with fewer restrictions and consequently, fewer errors (Booth, 2002; Luehrman, 1997a). It also provides managers more significant information and it allows them to find the origin of the value of the firm’s assets (Luehrman, 1997a). However, it allows the assumption of unreliable values for debt financing and consequently tax shield, financial distress and agency costs (Booth, 2002).
Despite all of these, Sabal (2005) states that after WACC, which is the most commonly used methodology, comes APV as the second most used method for valuations of companies.
2.2.2 Relative Valuation
According to Damodaran (2012b), relative valuation aims to value the company by comparing it to identical firms in the market.
11
To perform this analysis, Damodaran (2006) describes three fundamental steps. Firstly, the firm must search and identify comparable companies in the market. This procedure is not simple given the complexity of the criteria that should be used. In order to find comparable firms, not only should be concerned the fact that the companies can belong to one or more industries and sectors of activity, but also other factors that play a key role such as its risk level, growth and cash flows through time (Lie & Lie, 2002). The following step is based on the standardization of the prices into a variable that makes them comparable to each other, since they may be quoted differently in the market. Finally, the last step is to control the necessary adjustments to the values obtained.
According to Fernández (2015), there are three types of multiples. Table 1 - Relative Multiples
Based on Equity Value (E) Based on Enterprise Value (E+D) Related to Growth
PER (Price Earnings Ratio), P/S (Price to Sales), P/BV (Price to Book Value)
EV/EBITDA (Enterprise Value to EBITDA), EV/Sales (Enterprise Value to Sales), EV/FCF (Enterprise Value to Unlevered FCF)
P/EG (PER to earnings per share growth), EV/EG (Enterprise Value to growth of EBITDA)
Source: Fernández (2015)
Having this, and the examples of multiples below, it is highly important to choose the right multiples to use. Lie & Lie (2002) considers the choice of multiples depend on the size of the company, its performance, among others aspects. Contrarily, Goedhart et al. (2010) affirms one should always start by computing Enterprise Value to EBITDA, since it leads to more efficient conclusions than the others.
Relative valuation methodology is one of the most popular methods being used globally. According to Damodaran (2012b), it has a simple approach which results in more understandable conclusions for stakeholders than a discounted cash flow valuation. Given its comparison to market prices, it also has a higher probability of revealing the actual conjecture of market. Moreover, it has less requirements and provides more directly and faster valuations (Fernández, 2002). However, this methodology is not the most appropriate when the business is very unique and there are not comparable firms that can provide useful results (Damodaran, 2012) or in environments with a fast pace, since it reveals past values.
12
For these reasons, Fernández (2015) and Schreiner (2007) state that multiples should be used after applying other valuation method. According to Goedhart et al. (2005) and Kaplan & Ruback (1995), DCF is the method that should be analyzed firstly, given its efficiency and better performance, being then complemented with the multiples. 2.2.3 Contingent Claim Valuation
Contingent Claim Valuation performs the valuation of assets, through option pricing models, that have options characteristics. These comprehend models such as Black-Scholes and Binomial models (Damodaran, 2012). According to Mason & Merton (1985) an option analysis provides the awareness of the option’s value if, for example, the conditions of a project change and the company does not wish to continue with it. On the one hand, Copeland & Keenan (1998) state this model outperforms DCF models, for its better perspective not only on risk adjustment, but also on flexibility and when to leave and return to a certain business. On the other hand, Damodaran (2012b) considers that option pricing models bring more estimated errors to the results. According to Luehrman (1997b), the option pricing models provides managers more information about the value of new opportunities in long term, introducing a product in the market, acquisitions, among others, that DCF does not as clearly.
2.2.4 Asset Based Valuation
The final approach, asset based valuation, estimates the firm’s value by valuing the assets the firm owns. According to Fernández (2002), this approach is mainly based on a company’s balance sheet and accounting statements, having a stagnant perspective. Therefore, it does not consider any growth for the company or any aspects that can influence the firm on other terms, such as the market conjecture or internal concerns. Damodaran (2012b) states there are three types of valuing a company by this model. The first is liquidation value, which constitute the revenues obtained if the assets were sold today. The second is replacement cost, which is the cost of replacing every assets the firm owns. The third one is book value, which is represented by the equity parcel of the balance sheet (Fernández, 2002).
13 3. Investment Case
3.1 Company’s Presentation
Sumol+Compal is a Portuguese firm, that resulted from the merger of two of the largest non-alcoholic beverages companies in Portugal, Sumolis and Compal, in 2008. Sumolis group, formerly Refrigor, was founded in 1945 in Algés, with the purpose of manufacturing and commercializing soft drinks. The constant innovation (such as flavors without dyes or preservatives, or the green bottles to protect the drinks’ properties) and the proximity with its clients were key factors for the company’s success and thrive throughout the years.
Compal was founded in 1952, in Almeirim, with the name of Companhia de Conservas Alimentares, S.A.. It initially focused on the manufacture of preserved tomatoes, having later expanded its business to juices, soft drinks, nectars, canned vegetables and aerated waters.
With the merger, Sumol+Compal intended to become a reference in the Portuguese beverages’ market, maintaining its strong position on canned vegetables and preserved tomatoes.
Today, Sumol+Compal has expanded its mission, and intends to become a reference not only in Portugal but also in Africa. Sumol+Compal is the leader of the non-alcoholic beverages in Portugal, having a market share superior to 25%. It is present in more than 70 countries, employs approximately 1300 people, and it is the single food and beverages firm present on the NYSE Euronext Lisbon.
The company is organized in: Sumol+Compal, S.A..; Sumol+Compal Distribuição, S.A.; Sumol+Compal Mozambique, S.A.; Sumol+Compal Angola, S.A.; and Sumol+Compal Marcas, S.A..
The first one, Sumol+Compal, S.A., constitutes the parent company and it is responsible for the decisions that affect the company. It provides support to the remaining holdings and it is assigned with tasks such as planning and organizing in order to monitor the firm on its activities, either operational or representative.
14
The second is Sumol+Compal Distribuição, S.A.. This division is responsible to secure the sales of the products and its respective distribution to their clients, not only in Portugal, but abroad as well.
Sumol+Compal Mozambique, S.A. and Sumol+Compal Angola, S.A.’s mission is to control the implementation of the industrial unit abroad Portugal and to guarantee the manufacture, evolution and performance of the brands present in Mozambique and Angola respectively, and in some countries of the Southern African Development Community. These divisions, by its nature, are capable of cooperating with the objective of the company to become more globally recognized.
Sumol+Compal Marcas, S.A. is the last segment from the company’s organization. Its purpose is to manage the brands of the company, assuring their commercialization and distribution in the countries where the firm operates. It is also this division that is responsible to develop consumer studies and identify new opportunities. On November 2014, for 88,2 million euros, Sumol+Compal sold 49,9% of the holding to Copagef, a holding from Castel Group. Castel Group is a French company and its main business is related to the wine and beer industry. Currently, Copagef is one of the largest players in Africa. So, with this, Sumol+Compal may strengthen its position in Africa, expanding its business and reaching a largest target.
3.2 Business Units
Sumol+Compal has a wide portfolio of products which are divided in five major business units: soft drinks, juices and nectars, water and beer, canned vegetables and tomatoes, and finally, the distribution brands. These are framed into six portfolio brands, which are comprised by Compal, Sumol, Um Bongo, B!, Frize, Água da Serra da Estrela, Tagus, and Damm. Among these, Compal is the most consumed brand in the markets where the company operates (Appendix 1).
3.3 Future goals and strategic lines
Overall, the company is looking to have better results than in 2014, more specifically regarding turnover and operational returns.
15
It will also continue on focusing on innovation and communication of the brand and its new image, appealing to the concept of “Frutology” by investing and launching products that only contain Portuguese fruit.
Focusing on Portugal, the perspectives for the company are that the overall beverages’ sales continue to grow. Relying on an expected improvement on the country crisis, the private consumption is likely to grow, hence so should beverages consumption. However, the firm’s purpose will be to consolidate Portugal’s business and market share, so, it will continue to search for strategic partners.
Concerning international markets, the perspectives are for the sales to grow as well. Given Angola is the main location where the company operates abroad from Portugal, the growth of international sales will be highly impacted by the country’s results. The investment of a plant in Angola is expected to improve sales and reinforce the position and strength of the company. Therefore, it is crucial to maintain an efficient productive capacity, in order to fulfill and surpass demand. On the other hand, and due to the alienation of Sumol+Compal Marcas to Copagef, a strong player in Africa, the company is prospecting to strengthen its position in the continent, as well as to reach countries where it is not present.
Having increased sales for its second year since it started, and having export for the first time to South Africa, Madagascar and Swaziland, a future goal for Sumol+Compal Mozambique, will be to expand and explore exports to Southern African Development Community (SADC).
3.4 Operational Performance
Turnover
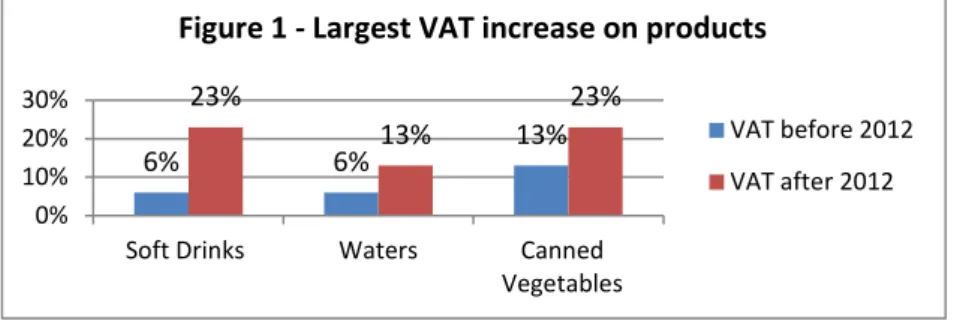
The year of 2012 was especially difficult for the company, mainly due to the impacts of the economic recession. GDP suffered a reduction of 4%, and the beverages’ market was highly impacted by the increase of VAT. Restaurants and similar establishments raised VAT from 13% to 23%, and some of the products suffered from large VAT increases (Figure 1).
16 6% 6% 13% 23% 13% 23% 0% 10% 20% 30%
Soft Drinks Waters Canned
Vegetables VAT before 2012 VAT after 2012 0 100 200 300 400 500
YE08 YE09 YE10 YE11 YE12 YE13 YE14
Volume (euros) Volume (litres)
Figure 1 - Largest VAT increase on products
This just worsened the continuous tendency of the reduction of private consumption, having the company’s sales decreased on 14,5% that year.
For the last three years, Sumol+Compal has been reverting this tendency, in which was able to slowly increase its turnover.
In 2014 the company presented 321 million euros of sales, having from 2012 to 2014, a positive growth of 3,8%. Despite the continuingly strong position Sumol+Compal has on domestic markets, being Portugal and Spain the main areas where the company operates and has more profits, international markets have been rising exponentially as well. The merger of Sumolis with Compal had a positive effect on this, since from 2010 to 2014, international markets have grown over 43%.
Last fall, along the sale of Sumol+Compal Marcas, the company not only had a boost of capital, but was also able to associate itself to Copagef.
This agreement will allow Sumol+Compal to strengthen its position in Africa, as well as to reach countries where the company is not present. Having this, it is expectable a positive growth of the turnover for the next years.
As it can be seen from Figure 2, there is a disparity among the volume in euros and in litres. However, this difference has been reducing, given the volume in litres has been growing more slowly than the volume in euros. This reflects the increase in prices the
company had to incur. Figure 2 - Turnover
Source: Sumol+Compal
17 Source: Sumol+Compal 38 41 43 34 36 38 40 42 44
YE12 YE13 YE14
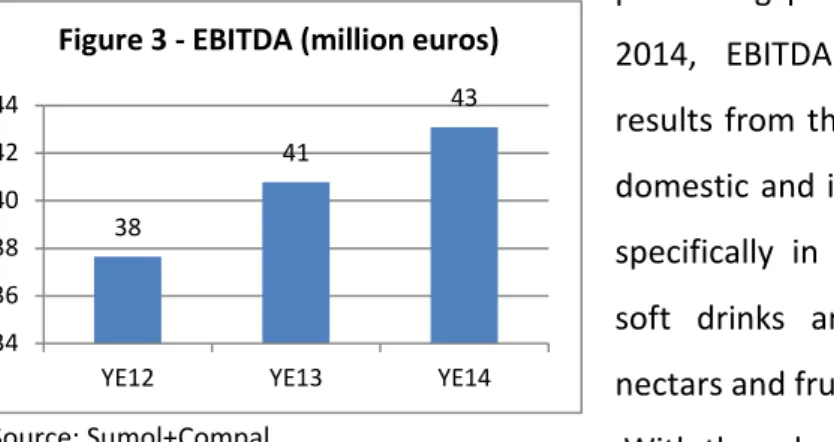
EBITDA
EBITDA is the indicator that allows the company to analyze its profits liberating the operational activity. For the last three years, EBITDA levels are also increasing, always presenting positive values. From 2012 to 2014, EBITDA increased 14,5%, which results from the increase of sales both on domestic and international markets, more specifically in goods, namely carbonated soft drinks and iced teas, and juices, nectars and fruit still soft drinks.
With the sale of Sumol+Compal Marcas, it is expectable that this indicator increases, given its expected positive growth for the turnover.
3.5 Financial Performance
Financial Expenses
The company’s financial expenses had been reducing over time. Despite the small decrease (approximately 6%) from 2012 to 2014, it is considered a good indicator for the company.
EBIT/Interest Coverage
The interest coverage ratio is the ability that a company has to pay its interest payments, with the earnings it has. Calculated by dividing EBIT by financial expenses, Sumol+Compal ratio has been increasing in the past years. The ratio suffered a decrease in 2012 due to the economic crisis, however, the value remained positive. From 2012 on, the ratio has been increasing, presenting 1,44 in 2014.
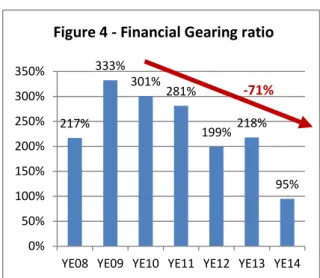
Financial Gearing
The financial gearing is the leverage ratio that measures the percentage of debt funded by the company’s equity.
18 217% 333% 301% 281% 199% 218% 95% 0% 50% 100% 150% 200% 250% 300% 350%
YE08 YE09 YE10 YE11 YE12 YE13 YE14
2,00 4,00 6,00 8,00
YE12 YE13 YE14
Source: Sumol+Compal For the previous years, Sumol+Compal
has been decreasing this ratio, having exposed a small increase in 2012, followed by a strong reduction to 2014, in 123%. This was mainly due to the reduction of net debt, more specifically, the long term interest bearing liabilities and the increase of the levels in cash, deposits and securities.
Financial Autonomy
The financial autonomy ratio measures the solvability of the company, measuring the percentage of assets funded by equity. For the last years, the company has been increasing this ratio, more particularly in 2014. This growth was essentially due to the increase on minority interests, namely because of Sumol+Compal Angola, and recently, Sumol+Compal Marcas.
Net Debt/EBITDA
The Net Debt to EBITDA ratio shows how much time would take for the firm to meet its debt if EBITDA and Net Debt remained constant. As seen from Figure 6, in 2014 this ratio had a significant decrease, from 6,99 in 2013 to 4,93 in 2014. 21% 23% 36% 0% 5% 10% 15% 20% 25% 30% 35% 40%
YE12 YE13 YE14
-71%
Figure 4 - Financial Gearing ratio
Source: Sumol+Compal
Figure 5 - Financial Autonomy ratio
Source: Sumol+Compal
19
Strenghts • Company’s strong reputation and brand
• Diverse and innovative portfolio
• Market leader in Portugal
• Good business partnerships with strong clients in Portugal
• Good relationship with labels such as Lipton, Pepsi, and Guaraná
• Strong ambition to growth, by expanding the business internationally
• Only Portuguese beverages company quoted
Weaknesses • High levels of debt
• Dependence on economic cycle, more specifically, private consumption
• Low liquidity
• Dependence on clients such as large distribution operators
• HoReCa channel sales’ decrease
• Risk of large investments made on developing countries
Opportunities • Expansion to other countries
• Larger presence in international markets and the group’s brands
• Economic recovery
• Developing countries opening up to new perspectives, becoming a world of unlimited opportunities
• Consumers’ mentality and behavior on a healthier lifestyle
Threats
• Political instability and vulnerability of countries such as Angola and Mozambique
• Difficult penetration of the markets of the countries such as Angola and Mozambique
• Continuing economic crisis
• Dependence on weather climate
• Strong presence of competitors globally
• Volatility on oil prices
• Closing establishments from HoReCa channel
This reduction was also due to the Sumol+Compal Marcas alienation, which made cash levels increase exponentially, approximately in 60 million. The increase in cash reduced the net debt, hence, the decrease in the ratio.
3.6 Stock Market Performance, Shareholder Structure and Dividends
In the past five years, from 2011 to 2015, Sumol+Compal stocks were very little volatile, decreasing its price throughout the years. In 2015, the price increased from a month to another performing at 1,139€ in 20 of April 2015 to 1,940€ in 20 of May 2015, reaching its maximum on 3 of June 2015, at 2,050€. This was the result of a reduction of the number of outstanding shares going from 96.030.687 to 60.499.364. In 31 of December 2014, Sumol+Compal was constituted by 100.092.500 shares, being 96.030.687 outstanding shares. The remaining 4.061.813 shares were held by the group. The main shareholders were Refrigor which held 70,53% of the shares and Caixa Geral de Depósitos that detained 10,50%. The company does not have a strict dividend policy having distributed dividends of 0,06€ per share in 2012. In 2014, due to the earnings and cash liquidity the sale of part of Sumol+Compal Marcas, the company distributed dividends on a total value of 15.658.444,48€.
3.7 Strategic Analysis
20
A breakdown of the 5 Porter Forces was also considered, by analyzing the threat of new entrants, threat of substitutes, bargaining power of buyers and bargaining power of suppliers, in order to understand the industry the company is in (Appendix 2).
4. Macroeconomic Environment and Industry Sector
4.1 Macroeconomic Environment
Along Sumolis and Compal merger, in 2008, the world was facing a recession on the economy. The effects of this crisis impacted not only Portugal, but the rest of the world as well. Given the crisis’ negative effects on GDP, unemployment rate and salaries, the confidence level of the consumers decreased as well as the private consumption. Naturally, so did beverages market suffered from the crisis.
Regardless of the merger’s advantages and growth of the group’s portfolio, Sumol+Compal was not an exception to the impacts of the crisis the world was facing, neither in Portugal, or the rest of the countries where the company operates.
In this section, it will be analyzed the macroeconomic scenario in the countries where the group mainly operates.
Portugal
As stated before, Portugal was also highly impacted by the crisis that reached worldwide economy. In an attempt to surpass the financial difficulties the country was facing, in 2011, Portugal asked for financial aid to the European Union and IMF. In exchange for their help, Portugal compromised on performing budgetary targets, structural reforms and several austerity measures. Troika composed by European Central Bank, International Monetary Fund and European Comission stayed in Portugal for three years with the program “Programa de Assistência Económica e Financeira”. During these three years, it can be said that Portugal faced a gradual economic recovery. Indicators such as GDP, volume of imports and exports, and unemployment rate reflect this economic conjecture, as can be seen in Appendix 3.
GDP suffered a strong decrease, presenting the major declines in 2009 and later on in 2011. It started to invert this tendency in 2013, having in 2014 increased by 0,9%.
21
Other indicators such as exports and imports volumes and unemployment rate confirm these betterments. In 2013 the level of imports and exports increased. Imports volume was the higher one (and the only positive record) since 2009, and exports risen by more than 100% since 2009 as well. This is due to the slight increase in private consumption and consumers’ confidence level.
Regarding unemployment rate, after reaching its maximum in 2013, it started to decrease in 2014 by approximately 13,9%.
Overall, according to IMF, Portugal economic indicators are likely to increase for the following years, especially prices (inflation index) and total investment.
Africa
The African continent is considered one of the fastest growing economic regions. Despite its lack of conditions in terms of high levels of poverty, low education levels, health care and mortality indexes, the African continent has been reflecting a positive economic growth, being GDP an indicator that is expected to grow for the next years. Until 2008, Africa’s economic growth was increasing exponentially, having reached its maximum in 2007 with a growth rate above 6%. With the economic crisis, African countries suffered a strong decrease in growth rate, having achieved 3% in 2009, less than half than two years ago. From 2009 on, with some volatility due to oil prices, the African continent has been increasing its growth throughout the years, being expected to grow 5% in 2016 according to African Economic Outlook.
Being Angola and Mozambique the main countries where Sumol+Compal is investing, the two will be analyzed in detail.
Angola
Despite being the second largest oil producer of Africa, Angola was not an exception to the crisis. In 2013 the country’s economy suffered from the decline of oil prices globally, the largest period of drought of oil fields given the temporary pause of oil production. Decreasing over time, the prices per barrel have achieved its historical minimums in January 2015, quoting less than half in the homologous period.
22
In addition, the country also endured the consequences of the lack of efficiency on managing the public debt. Having this, authorities have ensured that the 2015 State Budget clearly reflected the cut in investment expenses due to the decrease in oil revenues. Moreover, the national currency has been depreciating its value, in order to maintain international reserves in stock and increase imports.
The slow recovery from oil prices and the consequent uncertainty relative to international markets is the main risk in order to recover the economic activity. Due to this, it is expected that the growth rates will decelerate to around 3,5% and 4,4% (IMF and State Government estimates respectively).
Even though, Angola’s GDP has always been positive and with an increasing tendency until 2014 that decreased briefly (Appendix 4).
Mozambique
Overall, despite the global economic crisis, Mozambique has been having a significant increase in its economic activity, having risen again in 2014. Recovering from 2013 year-end political instability, GDP increased and presented a percentage change of 7,4% (Appendix 5). Impacted by presidential elections in the last quarter of 2014 and the floods in the beginning of 2015, it is expected a negative impact in the economic activity of 2015. Nevertheless, according to IMF and following Government guidelines for the next five years, it is expected that the country maintains its growth rates around 7% to 8% until 2019, as well as the inflation rate below 10%. In addition, the Government has the purpose of increasing the State revenues to 32,5% of GDP and public debt below 40% of GDP. With positive prospects, so are investments made in the country rising, representing almost 50% of its GDP in 2014 (Appendix 5).
Mozambique’s profitable sectors are represented by construction, transports and extractive industry. All of these industries are expected to grow in 2015, as well as the manufacturing industry, which is expected to grow approximately 5% due to the increase of beverages and textiles production. This was the industry that most contributed to GDP increase, having presented significant growths along the year.
23 4.2 Industry Sector
Overall Industry
The beverage industry is composed by companies that market alcoholic and non-alcoholic drinks, having worldwide players that have a strong impact on their segments. Determined by tendencies, this industry is affected by several macroeconomic factors that impact its evolution and progress. The first factor comes from merger and acquisitions operations. The entry or exit of large firms in the industry, leads to strong changes in the sector. These M&A operations have become more often and are making the industry more competitive, once companies are seeking for more revenues, market share, expand their portfolios, increase their bargain power, or economies of scale. According to Credit Sights, the M&A risk will increase, comparing to 2014. The second factor is globalization, which is allowing the industry to grow and to expand to other countries, such as emerging markets. Thirdly, comes the change on the concerns of the society, namely regarding lifestyles and attitudes towards health. Nowadays, consumers have been more informed and aware of the risks towards an unhealthy lifestyle. This is leading to a constant change in the sector, namely products diversification, since companies need to respond to the changing markets and its tendencies. This relates to the final trend which is product innovation. The key for beverages companies’ success relies on differentiation, and as a result, society is always expecting new formulas, flavors and appearances.
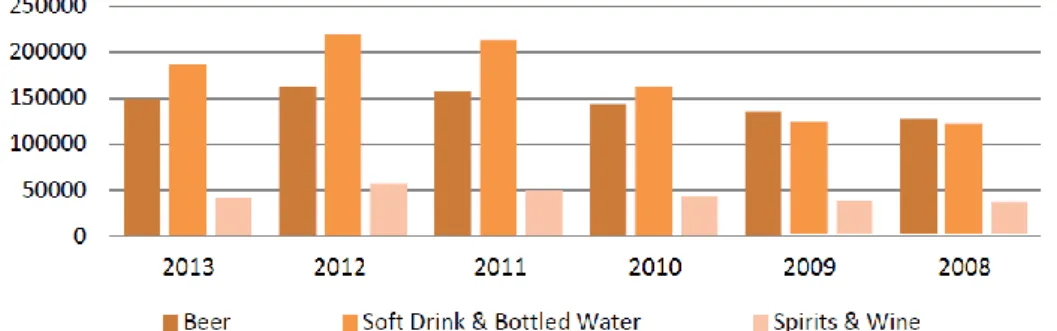
Looking at the industry as a whole, its recovery since the 2008 crisis is evident. Looking at Figure 7, it can be seen that from 2008 on, the sector has shown, in average, a growth tendency, being more evident in 2012.
Concerning an analysis by product, through the figure below, Figure 8, it is able to confirm that in fact, beverages’ sales have been rising since 2008, having all the segments slightly decreased in 2013. The aggregate with higher weight in the sector is
Source: “Banco BIG” Sectorial Analysis and Bloomberg
24
clearly soft drinks and bottled water segment, being spirits and wine the one with less contribution to the sector sales.
Alcoholic Beverages
The alcoholic beverages segment can be divided into three groups, namely, beers, spirits and the wines. Typically, beers represent 50% of the global consumption, spirits 20% and wines 30%. Throughout the years, and due to the current trends, the industry has been suffering from some
volatility. Despite the overall growth of 1,4% in the past ten years, the largest market size on alcoholic beverages, held by Europe, has been decreasing its alcohol consumption (approximately by 0,9% in the past years). This tendency is mainly due to
the crisis and consequent
consumption reduction, and currency
volatily, especially negative to Euro. Contrarily, emerging markets have been growing steadily and have become the drivers of the alcoholic beverages performance. Asia, has been the continent with higher growth (approximately 3,9% in the past ten years), as a result of the increasing “urban lifestyle”. China, more specifically, contradicts its continent tendency, particularly concerning spirits segment. This is due to the
Figure 8 - Evolution of Sales (million euros)
Source: “Banco BIG” Sectorial Analysis and Bloomberg
Figure 9 - Alcoholic Beverages Sales Evolution (billion dollars)
25
regulatory changes on anti-corruption and anti-fraud campaigns launched by the Chinese government in November of 2012.
From Figure 9, it is also noticeable the stability on North America throughout the years, representing 36% of the alcoholic consumption.
Having this, and looking closely to the segments, it can be perceived an overall growth on the spirits and wine, and beer segments, with a slight decrease in 2013, through the graph already seen above (Figure 8).
Spirits segment follows the tendency mentioned, growing until 2012, and decreasing in 2013. This is explained by the fact that the top players of this segment are majorly original from Europe. The top ten spirits producers represent 26% of the volumes, and six of them are European. As seen previously, Europe has been decreasing its sales on alcoholic beverages, which is partly responsible for this decrease.
The beer segment can be described as a concentrated market, since the global volume sold is mainly original from the top ten players, representing nearly 65%, and being all of them European companies with large scale economies.
The beer industry is highly dominated by mergers and acquisitions, having all the segment leaders been involved on these transactions as well.
The wine segment has been decreasing its consumption over the years. According to Bloomberg estimates, European countries such as Portugal, France, Italy, Switzerland and Slovenia, are the top consumers of wine. However, due to the last tendencies and to the crisis Europe is in, the overall consumption of alcoholic beverages decreased, and so did the wine segment.
Non-alcoholic Beverages
The non-alcoholic beverages comprise carbonated soft drinks, juices and nectars, waters, and sports and energy drinks, ready-to-drink tea and coffee. Soft drinks constitute the leader segment on the non-alcoholic beverages, as it can be seen by the graph below.
As it can be observed through Figure 10, carbonated soft drinks is the segment with the larger market size, representing approximately 40% (337,8 billion dollars). Following, it comes bottled water, having a 189,1 billion dollars market size. Finally,
26
Figure 10 - Global Soft Drink Market Size (2013)
Source: Market Realist and Euromonitor International
comes the segment of juices with 146,2 billion dollars of market size. These three together represent 80% of the market size of non-alcoholic beverages. With this, it is able to conclude that hot drinks, namely ready to drink teas and coffees, and sports and energy drinks represent a very small minority on the total. However, these minorities and bottled waters have grown in 2013, contrarily to carbonated soft drinks, juices and nectars. As seen before in Figure 8, the aggregate soft drinks and bottled water decreased its sales from 2012 to 2013. This was mainly due to the impact of soft drinks and not bottled waters, given the last ones increased its sales. Ready to drink coffees have increased more than the other segments. Nevertheless, this percentage is still little significant in the total market size, having its share on the total non-alcoholic beverages remained the same. Similarly to ready to drink coffee, so did energy drinks. Sports beverages on the other hand have grown significantly from 2011 on, which made Gatorade company enter as the fifth largest beverage trademark in 2013 in the US. Despite its decrease on sales, carbonated soft drinks segment remained as the leader of non-alcoholic beverages, being highly represented by two main players: Coca-Cola and Pepsi.
27 5. Valuation
5.1 Methodology
Sumol+Compal equity value resulted from a Sum of the Parts method. This valuation methodology consists in determining the value of the company by separately adding the value of its segments. In the case of Sumol+Compal, it was added according to its segments and geographical region.
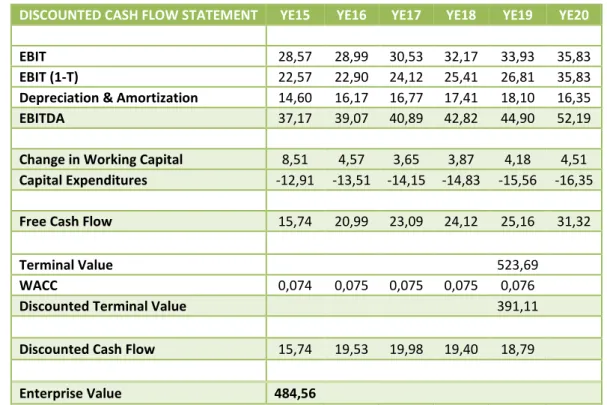
Nevertheless, considering the existing synergies between the operational areas of the company, a single Cash Flow Statement was used to compute the Enterprise Value of the company. To these cash flows the Discounted Cash Flow methodology was applied, hence obtaining the present value of future cash flows. The operational forecasts were made for a five year tenor, followed by a perpetuity beginning in the sixth year. In order to obtain the equity value, the Net Debt and Minorities of the current fiscal year (2015) were deducted to the equity value. This method is the most appropriate to be used to Sumol+Compal, not only because it is the most used methodology for corporate valuations (Arumugam, 2007), but also due the reduced volatility of the company’s debt-to-capital ratio following the sale of Sumol+Compal Marcas.
5.2 Assumptions
In order to determine the value of the business segments, there were several assumptions that had to be taken into account when projecting FCFF and WACC rate. 5.2.1 Turnover
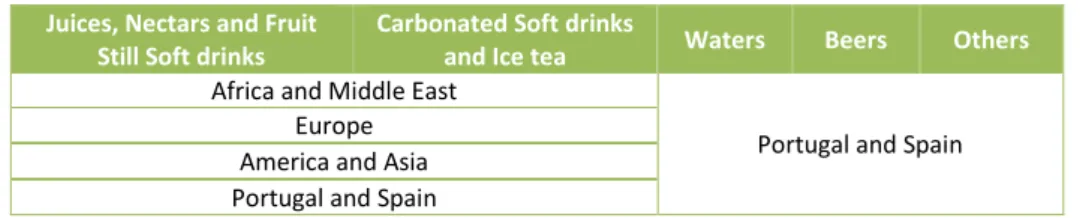
Sumol+Compal turnover was determined for each of its business segments, taking into account its geographical footprint. The business segments estimated were (i) carbonated soft drinks and ice tea; (ii) juices, nectars, and fruit soft drinks (iii) waters; (iv) beers and (v) others. The geographical regions were aggregated into Africa and Middle East; Europe; America and Asia; and Portugal and Spain. It was also considered in this section a portion for others shared services, franchising and other activities that are not integrated in the services provided by the firm. For the calculations, it was considered the IMF’s GDP and inflation forecasts until 2020, for all of the geographical
28
regions (Appendix 6 and Appendix 7 respectively). The calculation of the turnover for each business segment was performed by multiplying the volume in litres and the price for each segment.
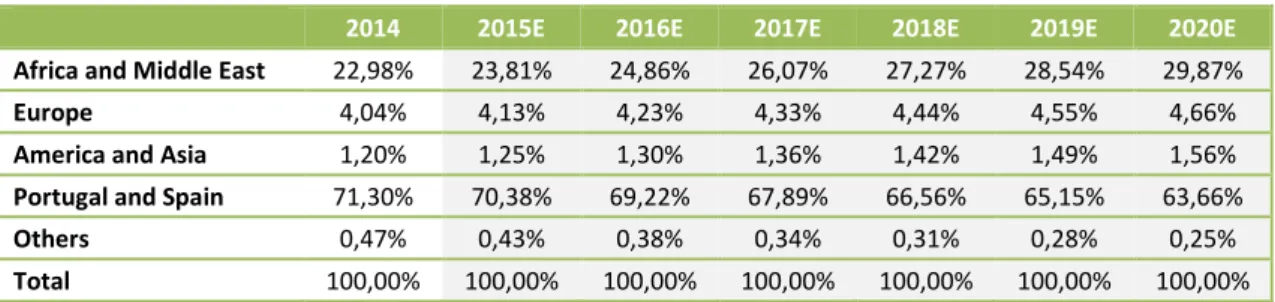
So, firstly, it was computed the percentage of sales that each geographic region had on the total sales of Sumol+Compal in 2014 (Table 3).
Having this, and in order to forecast their weight on the sales until 2020, it was assumed that Africa and Middle East, Europe, and America and Asia weight on total sales would increase according to its respective GDP. Moreover, the percentage that the group others has on the total sales, would only represent ninety percent of the previous year sales. The remaining would be represented by Portugal and Spain. Since the company has been focusing on its expansion to international domains, the percentage on the total sales of Portugal and Spain had to decrease. With the alienation of Sumol+Compal Marcas, the company hopes to have a stronger presence in the African continent. In addition, and given Angola is the main international market the company is in, the investment on the Angolan plant is expected to increase its sales, as well. For these, it was also natural to assume, that throughout the years, the company’s sales to Africa and Middle East aggregate would have a stronger impact on the total sales of the company. The active and growing presence of the non-brands on the consumers’ households also constitutes a threat, and a reason for Portugal and Spain have their shares reduced on the total sales. However, it is important to denote, that despite Portugal and Spain represent a smaller share over the years, they still constitute the majority of the total sales of the firm.
Table 3 - Percentage of Sales of Sumol+Compal's geographical regions and others
2014 2015E 2016E 2017E 2018E 2019E 2020E Africa and Middle East 22,98% 23,81% 24,86% 26,07% 27,27% 28,54% 29,87%
Europe 4,04% 4,13% 4,23% 4,33% 4,44% 4,55% 4,66%
America and Asia 1,20% 1,25% 1,30% 1,36% 1,42% 1,49% 1,56%
Portugal and Spain 71,30% 70,38% 69,22% 67,89% 66,56% 65,15% 63,66%
Others 0,47% 0,43% 0,38% 0,34% 0,31% 0,28% 0,25%
Total 100,00% 100,00% 100,00% 100,00% 100,00% 100,00% 100,00% Source: Sumol+Compal and own calculations