Universidade de Lisboa
Faculdade de Ciências
Departamento de Biologia Animal
Characterization by HPLC of Phytoplankton and
Microphytobenthos Photosynthetic Pigments
Mickael Philippe Marquês Ruivo
Mestrado em Ecologia Marinha
2010
Universidade de Lisboa
Faculdade de Ciências
Departamento de Biologia Animal
Characterization by HPLC of Phytoplankton and
Microphytobenthos Photosynthetic Pigments
Dissertação orientada por:
Doutor Paulo Cartaxana
Professora Doutora Ana Amorim
Mickael Philippe Marquês Ruivo
Mestrado em Ecologia Marinha
2010
i
Acknowledgements
This thesis is dedicated to all those who contributed in some way this work and as such I would like to leave my profound thanks to:
Doutor Paulo Cartaxana, for teaching me the fantastic world of pigments, and of course for all support, supervision, patience (is not easy to endure a S. L. B. fan) and enjoyable moments, allowing this work to be a delightful and gratifying learning process.
Professora Doutora Ana Amorim, for accepting the guidance of thesis, support and recommendations despite being one click away.
Doutor Bruno Jesus, for all nice and helpful discussions and of course for the given opportunity (still owe you a beer).
Vera Veloso for her precious help and teachings on algal cultures.
Bernardo, Tânia, Lourenço, Márcio, Alexandra, Ana Brito, Ana Sousa, Vânia, Liliana, Rafael e Carolina for all nice chats.
Gonçalo Pereira, Miguel Camilo, Dikk, Nelson and Eduardo Sobral, Manel, Titão, Luís, Paulo and Rito for all transfer of musical knowlegde and jams.
António Raposo, João Costa, João Cruz, Tiago Raposo for all enjoyable moments and genial discussions about biology.
ii All my friends especially, Edgar, Ricardo, Marco and Joaquim for all support, advices and of course funny moments.
My family and especially to Vânia, for all unconditional support, love, care, lost weekends, motivation and more important for being here.
iii "Indulge your passion for science,
says she, but let your science be human, and such as may have a direct reference to action and society"
v
Abbreviations
Alo - Alloxanthin Ant - Antheraxanthin Chl - Chlorophyll
Cont HL - High light control sediments DD - Diadinoxanthin
DPS - De-epoxidation state DT - Diatoxanthin
Ek - Light saturation coefficient
ExpP - Exponential phase Fo - Minimum fluorescence
Fuc - Fucoxanthin HL - High light
HPLC - High performance liquid Chromatography k - Light attenuation coefficient
k - Growth rate
Lat A - Latrunculin A
Lat A HL - High light Latrunculin A LHP - Light harvesting pigments LL - Low light
LN - Liquid nitrogen Lut - Lutein
ML - Medium light MPB - Microphytobenthos
NDVI - Normalized difference vegetation index Neo - Neoxanthin
NPQ - Non photochemical quenching OS - monomeric octysilica
PAM - Pulse amplitude modulated Per - Peridinin
PP – Photo-protective pigments
rETRmax - Maximum relative electron transport rate
RLC - Rapid light curve StaP - Stationary phase T2 - Doubling time
VAZ - Violaxanthin + Antheraxanthin + Zeaxanthin Vio - Violaxanthin
Zea - Zeaxanthin
vii
Resumo
Introdução
As zonas costeiras são regiões de enorme produtividade, demonstrando elevada diversidade de organismos de fitoplâncton e de microfitobentos. A biomassa e produção destes organismos autotróficos são afectadas, entre outros factores, pela disponibilidade de luz e nutrientes.
As clorofilas, carotenóides e ficobilinas são os principais tipos de pigmentos fotossintéticos, sendo essenciais à fotossíntese. A cromatografia líquida de alta precisão (HPLC) é uma técnica que permite a análise qualitativa e quantitativa dos vários pigmentos fotossintéticos, disponibilizando informações acerca de biomassa, composição e estado fisiológico das comunidades de fitoplâncton e de microfitobentos.
Capítulo 2
Neste capítulo estudaram-se os efeitos das fases de crescimento, exponencial e estacionária, e da irradiância nas concentrações e razões pigmentares em espécies fitoplanctónicas. No estudo do efeito da fase de crescimento foram utilizadas sete espécies, entre elas dois dinoflagelados, Amphidinium carterae e Gymnodinium
catenatum, uma clorofícea, Dunaliella salina, uma prasinofícea, Tetraselmis suecica,
duas diatomáceas, Cylindrotheca closterium e Phaeodactylum tricornutum, e uma criptofícea, Rhodomonas sp. Após realização das curvas de crescimento, amostraram-se três réplicas em fase exponencial e três réplicas em fase estacionária. No estudo do efeito da irradiância nas concentrações e razões pigmentares usaram-se 3 espécies, A.
carterae, C. closterium e T. suecica, submetidas a três níveis de irradiância (Luz Baixa,
viii 400 µmol fotões m-2 s-1). Amostraram-se três réplicas em fase exponencial para cada nível de irradiância. A análise e caracterização pigmentar das várias espécies foi efectuada por HPLC.
A comparação entre as fases de crescimento exponencial e estacionária demonstrou a existência de diferenças significativas tanto nas concentrações como nas razões pigmentares. As concentrações de pigmentos fotossintéticos por célula (e.g. clorofila a, clorofila b, fucoxantina e neoxantina) foram superiores durante a fase de crescimento exponencial. Tais resultados podem ser consequência da limitação de nutrientes e/ou da idade celular durante a fase estacionária. Por sua vez, obtiveram-se, consistentemente, maiores concentrações de anteraxantina, diatoxantina e zeaxantina durante a fase estacionária, demonstrando que pigmentos tipicamente com função fotoprotectora tendem a aumentar a sua concentração quando as células entram nesta fase, provavelmente devido ao seu envolvimento na prevenção foto-oxidativa das células. Os ratios pigmento/clorofila a, (exceptuando a violaxantina e o β-Caroteno), violaxantina + anteraxantina + zeaxantina (VAZ)/clorofila a e diadinoxantina + diatoxantina (DD + DT)/clorofila a e os índices de de-epoxidação (DPS) foram sistematicamente superiores durante a fase estacionária. Verificaram-se diferenças inter-específicas para espécies pertencentes ao mesmo grupo taxonómico. Em C. closterium a razão fucoxantina/clorofila a não variou significativamente enquanto em P. tricornutum esta razão foi aproximadamente o dobro na fase estacionária. Nos dinoflagelados, a razão peridinina/clorofila a aumentou menos de 25% entre as fases exponencial e estacionária, todavia essas diferenças só foram significativas em A. carterae.
O efeito da irradiância foi significativo nas concentrações dos pigmentos de colheita de luz (LHP) e pigmentos fotoprotectores (PP). As maiores concentrações de LHP
ix ocorreram em LL, intermediárias em ML e finalmente mais baixas em HL. Esta diminuição na concentração de LHP com o aumento da intensidade luminosa é devido à fotoaclimatação das células regulada pelo tamanho das antenas fotossintéticas. Pelo contrário, os PP apresentaram maiores concentrações em HL e menores em LL. A de-epoxidação de violaxantina em anteraxantina e zeaxantina e de diadinoxantina em diatoxantina (ciclo das xantofilas), regula o excesso de energia, consequência do aumento da irradiância, através da dissipação de calor, permitindo a protecção do aparelho fotossintético. Genericamente, as razões de pigmentos com função fotossintética, e embebidos nos complexos de colheita de luz, foram constantes nas diferentes irradiâncias, pois tendem a co-variar com a clorofila a. No entanto, as razões de pigmentos com função protectora foram superiores em HL (e.g. luteína e zeaxantina).
No capítulo considerado demonstrou-se o efeito significativo da fase de crescimento e da luz nas razões pigmento/clorofila a. Assim sendo, estas variáveis devem ser consideradas na aplicação dos pigmentos fotossintéticos como indicadores quimiotaxonómicos para o estudo de comunidades fitoplanctónicas.
Capítulo 3
Os objectivos deste estudo foram direccionados para a comparação da fotoprotecção fisiológica (utilização dos ciclo das xantofilas como forma de dissipação do excesso de energia no aparelho fotossintético) e comportamental (capacidade de migração vertical que permite às microalgas o controlo do nível de irradiância a que estão expostas) entre comunidades epipélicas e epipsâmicas de substrato vazoso e arenoso no estuário do Tejo. Amostraram-se dois locais: um tipicamente constituído por partículas de dimensões inferiores a 63 µm (denominado vasa), e outro com partículas de calibre
x entre 125 e 1000 µm (referido como areia). Assim sendo, aspectos como fluorescência, atenuação da luz, curvas rápidas de luz, análise e caracterização pigmentar e avaliação da capacidade migratória foram estudados recorrendo a técnicas de fluorescência de Pulso Modulado (PAM) e HPLC.
Na comparação entre as comunidades epipélicas e epipsâmicas verificaram-se diferenças nos diversos parâmetros estudados. Na comunidade de substrato vazoso, denotou-se um efeito da profundidade nos perfis de clorofila a e uma diminuição da concentração de clorofila a ao longo do perfil. O coeficiente de atenuação da luz (k) foi elevado, com um decréscimo na disponibilidade da luz para 33%, 7% e 1% da luz incidente à superfície a profundidades de 200, 400 e 600 µm, respectivamente. Na comunidade de substrato arenoso, não se verificaram diferenças significativas nas concentrações de clorofila a, sendo estas constantes ao longo do perfil. O coeficiente de atenuação de luz foi inferior, comparativamente ao valor obtido no substrato vazoso, com 80%, 50% e 2% de disponibilidade de luz a profundidades, de 200 µm, 400 µm e 3000 µm, respectivamente. As diferenças de k e da concentração de clorofila a ao longo dos perfis de sedimento são devido ao tamanho das partículas, provocando assim, uma diferenciação na distribuição vertical das comunidades bênticas. O calibre das partículas de sedimento e k variam de forma inversamente proporcional.
Em substrato vazoso, ocorreu uma diminuição de clorofila a à superfície (0-200 µm) no controlo sob luz alta (Cont HL) quando comparado com luz baixa (LL) e sedimentos tratados com um inibidor de motilidade (Lat A HL). Em simultâneo, observou-se um aumento da percentagem relativa de clorofila a na camada de 200-400 µm. Tal situação, não se verificou em Lat A HL devido à presença do inibidor de motilidade, prevenindo a migração. Estes resultados indicam que as diatomácias epipélicas da vasa submetidas
xi a luz forte migram em profundidade – fotoprotecção comportamental – e corrobora a função de Lat A como um inibidor altamente específico de motilidade em diatomácias.
Ambas comunidades estudadas activaram mecanismos fisiológicos de fotoprotecção quando sujeitas a luz forte. No substrato vazoso o índice DPS foi superior em Lat A HL quando comparado com LL (estrato 0-200 µm), mas sem diferenças significativas entre Lat A HL e Cont HL. No substrato arenoso o índice DPS foi inferior para LL, intermédio para Cont HL e superior em Lat A HL. Estes resultados indicam diferenças significativas com Cont HL. A interpretação destes resultados sugere que as comunidades pertencentes aos substratos vazoso e arenoso recorrem ao ciclo das xantofilas como mecanismo de fotoprotecção, independentemente da sua capacidade migratória.
Na avaliação da influência dos diferentes tratamentos nos vários parâmetros das curvas rápidas de respostaluz (taxa máxima relativa de transporte de electrões
-rETRmax; declive inicial da taxa fotossintética não saturada - α; parâmetro de saturação
de luz - Ek) denota-se um efeito significativo dos vários tratamentos, para ambos
substratos em rETRmax, α e Ek. A excepção ocorre no substrato arenoso para Ek, onde
não existem diferenças significativas. Porém, no substrato vazoso, os valores de
rETRmax, α e Ek foram significativamente mais baixos em Lat A HL que em Cont HL
enquanto essas diferenças não foram significativas no substrato arenoso. Estes resultados são consequência das diferentes condições de luz na matriz sedimentar dos substratos estudados, e provavelmente devido a diferenças na composição taxonómica.
Este trabalho demonstra as diferentes respostas das células às variações de luz no sedimento: i) através de fotoprotecção fisiológica (ciclo das xantofilas) e/ou ii) movimento vertical descendente ao longo do perfil de sedimento, denominado fotoprotecção comportamental. As comunidades epipélicas, por apresentarem
xii capacidade migratória, utilizam tanto a fotoprotecção fisiológica como comportamental, enquanto as comunidades epipsâmicas, sem capacidade migratória, valem-se apenas de fotoprotecção fisiológica.
xiii
Abstract
Phytoplankton and microphytobenthos communities influence coastal systems productivity and are affected, among other factors, by light and nutrients availability. Growth phase and light variation effect on phytoplankton pigment concentrations and physiological vs. behavioral photo-protection of epipelic and epipsamic microphytobenthos communities were studied using High Performance Liquid Chromatography.
Growth phase and light variation showed a significant effect on phytoplankton light harvesting (LHP) and photo-protective (PP) pigments. LHP concentrations were lower during stationary growth phase presumably by nutrient limitation and cellular age whereas photo-protective pigments increased. An increment of pigment ratios from exponential to stationary phase was consequence of the pronounced decrease in chlorophyll a cellular content comparatively with other pigments. Light increase lead to a decrease on photosynthetic pigment concentrations due to cellular photoacclimation, while the photo-protective pigment concentrations increase, allowing the dissipation of excess energy. This study shows that growth phase and light intensity have significant effects on pigment/Chl a ratios, including many marker pigments, and this should be taken into account in the application of chemotaxonomical approaches to phytoplankton natural communities.
Microphytobenthos biomass vertical distribution in intertidal mud and sandflats of the Tagus estuary was considerably different depending on the type of sediment. In the mud, a steep decrease in biomass accumulation from the surface down to 1 mm was observed, whereas in the sand Chl a concentrations were relatively stable throughout the profile. Epipelic and epipsamic communities showed different photo-regulaton
xiv strategies: both communities photo-regulated using physiological photo-protection while the epipelic community of muddy sediments used physiological and behavioral photoprotection.
Table of contents
Acknowledgements ... i Abbreviations ... v Resumo ... vii Introdução ... vii Capítulo 2 ... vii Capítulo 3 ... ix Abstract ... xiii Chapter 1 ... 1 General introduction ... 3Phytoplankton and Microphytobenthos ... 3
Pigments ... 4
HPLC ... 6
Objectives ... 6
Chapter 2 ... 9
Effects of growth phase and irradiance on phytoplankton pigment ratios: implications for chemotaxonomy in coastal waters... 11
Abstract ... 11
Results ... 18 Discussion ... 29 Acknowledgements ... 32
Chapter 3 ... 35 Physiological versus behavioral photo-protection of intertidal epipelic and epipsamic microalgae benthic communities ... 37 Abstract ... 37 Introduction ... 38 Materials & Methods ... 40 Results ... 44 Discussion ... 52 Acknowledgements ... 56 Chapter 4 ... 59 Final Considerations ... 61 Chapter 5 ... 65 References ... 67
1
General Introduction
3
General introduction
Phytoplankton and Microphytobenthos
Coastal ecosystems found along continental margins are characterized by regions of high productivity, showing high diversity of phytoplankton organisms in the water column and a remarkably large number of benthic species (Kaiser et al., 2005). The phytoplankton (phyto = plant; plankton = drifting) is composed of microscopic photosynthetic organisms, both prokaryotes and eukaryotes (Graham & Wilcox, 2000). The phytoplankton is a fundamental component on the functional structure of oceanic, coastal and estuarine systems (Underwood & Kromkamp, 1999) because it is the basis of food webs (Fenchel, 1988) and can affect biogeochemical cycles and the global climate system (Falkowski, 1994; Bains et al., 2000).
Microphytobenthos (MPB; micro = small; phyto = plant; benthos = depth) is a group of benthic microalgae, incorporating diverse photosynthetic eukaryotic algae and cyanobacteria, which colonize intertidal mud and sand flats of estuaries and shallow coastal zones (MacIntyre et al., 1996). These organisms play an important role on estuarine ecosystems due to their high productivity (e.g. Underwood & Kromkamp, 1999). Their occurrence is of great importance in the benthic trophic webs (Herman et al., 2000; Hillebrand et al., 2002) because they are an important resource for grazers (Middelburg et al., 2000) and contribute to sediment stabilization by secretion of extracellular polymeric substances (Smith & Underwood, 1998; Stal, 2003).
The main limiting factors of phytoplankton and microphytobenthos productivity are nutrients and light (Kromkamp et al., 1995). Dynamics of phytoplankton and microphytobenthos are essentially correlated with spatial and temporal variations of
Chapter 1
4 major nutrients such as nitrogen, silicon and phosphorus (Graham & Wilcox, 2000). Most of the dissolved nitrogen present in the aquatic environment is found as dinitrogen gas. The remainder is in the ionic form, as ammonium, nitrite and nitrate ion, and are usually involved in biological processes (Head, 1985; Graham & Wilcox, 2000) being important for proteins, nucleic acids and other cellular components (Madigan & Martinko, 2006). Silicon can be a limiting nutrient since it is a requirement for the growth of diatoms. They can convert silicic acid into silica and incorporate into skeletal material (Head, 1985; Graham & Wilcox, 2000). Phosphorus occurs in nature in the form of organic and inorganic phosphates, but phytoplankton and microphytobenthos can only use inorganic phosphates, such as orthophosphate, monophosphate and dyhidrogen phosphate (Graham & Wilcox, 2000; Madigan & Martinko, 2006). Phosphorus is a key role nutrient because is required by the cell primarily for synthesis of nucleic acids, phospholipids and cellular transport energy (Grasshoff et al., 1983; Madigan & Martinko, 2006).
The physical characteristics of the water column cause variations in the intensity and light quality, in short time periods, affecting the levels of irradiance received by phytoplankton (Diehl et al., 2002; Huisman et al., 2004). Although, microphytobenthos are found at the surface layers, near the sediment-water interface, its abundance and distribution are determined by depth light penetration, which is normally confined to the first millimeters of sediment (MacIntyre et al., 1996).
Pigments
In photoautotrophs, photosynthesis begins with the absorption of light through light harvesting complexes. This light is directed to reaction centers that enable light energy
General Introduction
5 to be converted into chemical energy (Raven et al., 2005; Kromkamp et al., 2006). Light absorption and energy transfer is performed by photosynthetic pigments. The main types of photosynthetic pigments are chlorophylls, carotenoids and phycobilins (Raven et al., 2005).
Chemically, chlorophylls are cyclic tetrapyrroles, characterized by the presence of a magnesium ion and an isocyclic ring (Senge et al., 2006). Chlorophylls play several important roles in photosynthesis: they have great efficiency in light absorption, high capacity and efficiency in the transfer of excitation energy to reaction centers and conducts the primary charge separation across the photosynthetic membranes (Scheer, 2006).
Carotenoids are C40 isoprenoids composed by a hydrocarbon backbone (Cuttriss &
Pogson, 2004). There are two groups of carotenoids: carotenes, consisting only of carbon and hydrogen atoms, like β,β-Carotene, and xanthophylls, which are products of the oxidation of carotenes, formed by carbon, hydrogen and oxygen atoms, such as diatoxanthin (Jeffrey et al., 1997; Cuttriss & Pogson, 2004). The main functions of this groups of pigments are: light-harvesting (Jeffrey et al., 1997), photo-protection (Jeffrey et al.,1997; Demming-Adams et al., 1999), anti-oxidant (Raven et al., 2005), and stabilization of light-harvesting protein structures (Jeffrey et al., 1997).
The last group of photosynthetic pigments, phycobilins, are water-soluble open-chain tetrapyrroles without a metallic ion (Beale & Cornejo, 1991; Graham & Wilcox, 2000; Raven et al., 2005). There are two kinds of phycobilins: phycocyanins (that predominate in cyanobacteria) and phycoerythrin (that predominate in red algae) (Graham & Wilcox, 2000). Phycobilins act as light-harvesting entities because they transfer captured energy to chlorophyll a. (Green & Parson, 2003).
Chapter 1
6
HPLC
High performance liquid chromatography (HPLC) is a technique that allows the separation, identification and quantification of chlorophylls and carotenoids, gathering information about biomass, composition and physiological state of phytoplankton (Jeffrey et al., 1997; Latasa, 2007) and microphytobenthos (Brotas & Cunny, 2003; Cartaxana et. al., 2006). HPLC is a rapid, low-cost technique, allowing the analysis of hundreds of samples (Mackey et al., 1996; Wright et al., 1996). Since larger volumes of water are filtered for pigment analysis by HPLC, the variability problem is attenuated when compared to microscopy (Schlüter & Havskum, 1997).
Objectives
The main objectives of this thesis were:
To assess pigment composition of phytoplankton microalgae cultures kept at the ALISU collection of the Institute of Oceanography (Chapter 2).
To evaluate light and growth phase effect in pigment composition of phytoplankton species representing major groups of microalgae (Chapter 2).
To determine the main pigment to chlorophyll a ratios and their chemotaxonomic relevance (Chapter 2).
To study the variation in pigment composition and the physiological versus behavioral response of microphytobenthonic communities during periods of high light exposure in mud and sand sediments (Chapter 3).
9
Phytoplankton pigment ratios
11
Effects of growth phase and irradiance on phytoplankton pigment ratios:
implications for chemotaxonomy in coastal waters
Abstract
Pigment (chlorophylls and carotenoids) concentrations were studied in cultures of two dinophyceae (Amphidinium carterae and Gymnodinium catenatum), two bacillariophyceae (Cylindrotheca closterium and Pheodactylum tricornutum), one chlorophyceae (Dunaliella salina), one prasinophyceae (Tetraselmis suecica), and one cryptophyceae (Rhodomonas sp.), isolated from Portuguese coastal waters. Consistently higher pigment to chlorophyll a (Chl a) ratios were observed at stationary compared to exponential phase. The most affected ratios were fucoxanthin/Chl a in C. closterium and zeaxanthin/Chl a in D. salina, that were 2.3- and 10.5-fold higher at stationary phase respectively. Most marker pigments to Chl a ratios were not dependent on growth irradiance as light-harvesting photosynthetic pigments tend to co-vary with Chl a. For
C. closterium, fucoxanthin/Chl a ratios decreased with irradiance, while lutein/Chl a
doubled from low to high light in T. suecica. Ratios based on photo-protective pigments (diatoxanthin, zeaxanthin and antheraxanthin) to Chl a increased with irradiance. The effects of growth phase and irradiance on phytoplankton pigment/Chl a ratios, as well as the inter-specific differences within the same phytoplankton group, underlines the importance of choosing the most abundant species of the studied area in the application of chemotaxonomical tools to phytoplankton natural communities.
Chapter 2
12
Introduction
Phytoplankton is the basis of food webs in marine ecosystems, affecting biogeochemical cycles and the global climate system (Falkowski, 1994; Bains et al., 2000). Coastal ecosystems are the most affected by anthropogenic eutrophication and the rapidly changing nutrient status of these water systems can cause major shifts in phytoplankton community composition (Cloern, 2001).
Traditionally, phytoplankton composition studies use light microscopy for the identification and estimation of cell abundance and biomass. This method requires taxonomic expertise, is very time-consuming, and usually subjective (Duarte et al., 1990; Schlüter et al., 2000). Furthermore, in general small cells (picoplanktonic and nanoplanktonic) cannot be identified, as they lack taxonomically useful morphological features or the details are beyond the light microscope resolution. An alternative approach is the characterization of phytoplankton communities based on the analysis of photosynthetic pigments by High Performance Liquid Chromatography (HPLC) (e.g. Wright et al., 1996; Rodríguez et al., 2002). Although not providing the taxonomic precision of microscopy, the analysis of pigments by HPLC, and statistical tools such as CHEMTAX (CHEmical TAXonomy) matrix factorization program (Mackey et al., 1996), is rapid and objective generating highly reproducible results (Wright et al., 1996).HPLC-CHEMTAX analysis has been shown to detect small phytoplankton taxa that are generally underestimated or overlooked using microscopy (Wright et al., 1996; Ansotegui et al., 2001).
CHEMTAX estimates the contribution of different phytoplankton groups to total chlorophyll a (Chl a) based on the ratios between pigments restricted to one or a small group of taxa − marker pigments − and Chl a. A necessary assumption for methods such
Phytoplankton pigment ratios
13 as CHEMTAX is that marker pigments to Chl a ratios are constant within a phytoplankton group (Mackey et al., 1996). However, the pigment content and the pigment to Chl a ratios are strongly influenced by factors such as irradiance and nutrient availability (Latasa, 1995; Goericke & Montoya, 1998; Llewellyn & Gibb, 2000; Schlüter et al., 2000; Henriksen et al., 2002). Due to the variability of these parameters in the different water masses and within a specific water column, extensive knowledge of the influence of light intensity and nutrients on pigment/Chl a ratios of different phytoplankton species is needed. Since the majority of phytoplankton pigment studies are from oligotrophic oceanic waters (Wright et al., 1996; Rodríguez et al., 2002; Zapata et al., 2004; Rodríguez et al., 2005), the acquisition of new data on pigment ratios is particularly important for more eutrophic, coastal marine areas (Schlüter et al., 2000; Henriksen et al., 2002).
Furthermore, inter-species variation in pigment/Chl a ratios within a individual phytoplankton group can be quite pronounced (Schlüter et al., 2000; Henriksen et al., 2002). Therefore, pigment/Chl a ratios to be used in CHEMTAX should come from the more abundant phytoplankton species native to the studied phytoplankton communities (Mackey et al., 1996; Lewitus et al., 2005) and has led to the general conclusion that screening by microscopy is essential to avoid significant mistakes and misinterpretations of HPLC data (Irigoien et al., 2004; Havskum et al., 2004; Develi et al., 2008).
In this study, pigment to Chl a ratios were obtained for different algal species abundant in Portuguese coastal waters, using cultures isolated from local populations. Furthermore, the effects of varying irradiance and sampling in exponential or stationary growth phase on pigment to Chl a ratios were studied and the adequacy of using these ratios on chemotaxonomic approaches discussed.
Chapter 2
14
Material and Methods
Algal Cultures
Dunaliella salina (Dunal) Teodoresco 1905 (IO 85-01), Tetraselmis suecica (Kylin)
Butcher 1959 (IO 063-01), Amphidinium carterae Hulburt 1957 (IO 017-01),
Gymnodinium catenatum L.W. Graham 1943 (IO 013-16), Rhodomonas sp. Karsten
1898 (IO 55-01), Cylindrotheca closterium (Ehrenberg) Reimann & J.C.Lewin 1964 (IO 19-01), and Phaeodactylum tricornutum Bohlin 1897 (IO 108-01) were obtained from the Algae Collection (ALISU) at the University of Lisbon, Center of Oceanography. All cultures except G. catenatum were grown on f/2 medium (Guillard & Ryther, 1962), salinity 35. G. catenatum was grown on GSe medium (Doblin et al., 1999). D. salina, T. suecica , A. carterae and G. catenatum were maintained in a culturing cabinet at 19 ºC ± 1 (Fitoclima 750E, Aralab, Portugal), under cool white fluorescent light of 20 µmol photons m-2 s-1 (18 Watts, Osram, Germany), on 14:10 light:dark cycle. Rhodomonas sp., C. closterium, and P. tricornutum were maintained under the same light regime in a culturing cabinet at 15 ºC ± 1 (Fitoclima S600, Aralab, Portugal). All parent cultures were clonal but not axenic and were grown in conical flasks.
Growth of all cultures was followed in 75 ml batch cultures using culturing flasks (NUNC ref. 5510200) under the conditions described above. A dilution ratio of approximately 1:1 was used and after 4 days 5 ml of sample were collected and fixed in Lugol's iodine solution. A new dilution ratio of 1:10 was done and every day over 18 days, between 15 and 16 p.m., three samples of 0.5 ml were collected and fixed with Lugol's iodine solution in three different glass flasks.
Phytoplankton pigment ratios
15
Microscopy and Cell Counting
Cells were counted at a magnification of 200x or 400x by light microscopy (Olympus BX50, Japan) using a Palmer-Maloney (G. catenatum and C. closterium) and Neubaeur improved counting device (other species) (Guillard & Sieracki, 2005). A minimum of 400 cells were counted, except at lag growing phase of larger species (e.g. G.
catenatum) where 200-300 cells were counted. Cell length and width were measured
using AxioVs40 software (Ver. 4.8.0.0, Carl Zeiss, Germany). Growth rate and doubling time were calculated according to Wood et al. (2005).
Exponential vs. Stationary Growth Phase
Once the growth curve was established new cultures were prepared in the same conditions as above using six replicas. Three replicas were sampled at mid-exponential phase and three replicas at stationary phase for HPLC analysis (see Fig. 1). Sampling occurred between 15 and 16 p.m., half-way through the day period. Variable volumes (depending on culture cell density) were filtered onto 25 mm Whatman GF/F with a nominal pore size of 0.7 µm. Filters were immediately frozen in liquid nitrogen and kept at -80 ºC for HPLC pigment analysis. For each replica, 5 ml of sample were also collected and fixed in Lugol's iodine solution for cell counting.
Irradiance Levels
The dinoflagellate A. carterae, the diatom C. closterium and the prasinophyceae T.
suecica were grown in glass conical flasks on 14:10 light:dark cycle at 17 ºC in f/2
medium, salinity 35, under three different light intensities: low light (LL) 10 µmol photons m-2 s-1; medium light (ML) 100 µmol photons m-2 s-1; and high light (HL) 400 µmol photons m-2 s-1. Triplicates were used for each of the light intensities. The algal
Chapter 2
16 cultures were prepared on the same conditions as described above. Light intensity was measured using a quantum meter (QMSW-SS, Apogee, USA). For HPLC pigment analysis, replicates were sampled at mid-exponential growth phase and filtered onto 25 mm Whatman GF/F. To ensure that pigment composition reflected the experimental LL, ML, and HL conditions, filters were immediately frozen in liquid nitrogen and kept at -80 ºC. For each replica, 5 ml of sample were collected and fixed in Lugol's iodine solution for cell counting.
HPLC Pigment Analysis
Photosynthetic pigments were extracted with 95% cold-buffered metanol (2% ammonium acetate) for 30 min at -20 ºC in the dark. Samples were sonicated for 1 min in the beginning of the extraction period and then centrifuged at 2800 g for 15 min at 4 ºC. Extracts were filtered (Fluoropore PTFE filter membranes, 0.2 μm pore size) immediately before injection in the HPLC to remove cell and filter debris.
Pigment extracts were analyzed using a HPLC system (Shimadzu, Japan) with a photodiode array detector (SPD-M10 ADVP). The chromatographic separation of pigments was achieved using a monomeric octylsilica (OS) C8 column for reverse phase
chromatography (Waters Symmetry: 150 x 4.6 mm, 3.5 µm particle size, 100 Å pore size). Mobile phase was constituted by: solution A = metanol:acetonitrile:aqueous pyridine solution (50:25:25 v/v/v); and B = acetonitrile:acetone (80:20 v/v). The aqueous pyridine solution (0.25 M) pyridine was adjusted to pH 5.0 with acetic acid. The solvent gradient followed Zapata et al. (2000) with a flow rate of 1 ml-1, an injection volume of 100 µl and a run duration of 40 min. Pigments were identified from absorbance spectra and retention times and concentrations calculated from the signals in
Phytoplankton pigment ratios
17 the photodiode array detector in comparison with pure crystalline standards from DHI (Institute for Water and Environment, Denmark).
The de-epoxidation state (DPS) of the cells, a measure of the production of photo-protective pigments involved in the xanhophyll cycle, was calculated as:
DPS = DT / (DD + DT) or
DPS = (Ant + Zea) / (Vio + Ant + Zea)
where DT is diatoxanthin, DD is diadinoxanthin, Ant is antheraxanthin, Zea is zeaxanthin, and Vio is violaxanthin.
To assess differences between the production of xanthophyll cycle pigments relative to Chl a, the ratios DD+DT/Chl a (A. carterae, G. catenatum and C. closterium) and Vio+Ant+Zea/Chl a (VAZ/ Chl a; D. salina and T. suecica) were calculated.
Statistical Analysis
Student's t-test was applied in order to evaluate differences between pigment concentrations and pigments to Chl a ratios due to growth phase. Kruskal-Wallis non-parametric test were applied to test differences between pigments and pigments to Chl a ratios for different light intensities. Tukey tests were done for comparisons among pairs of means. All the statistical analyses were carried out using Statistica 9.0 (StatSoft Inc., USA).
Chapter 2
18
Results
Growth Patterns
Growth curves for all studied cultures showed a sigmoid shape with clear exponential (ExpP) and stationary (StaP) phases (Fig. 1). Mean values of cell length and width, growth rate, doubling time and initial cell density are shown in Table 1 for the different studied phytoplankton species. Larger species like C. closterium and G. catenatum presented lower mean growth rates (k) and higher doubling times (T2), compared to
Phytoplankton pigment ratios
19
Fig. 1. Growth curves (mean cell counts ± standard deviation) for Amphidinium carterae, Gymnodinium
catenatum, Dunaliella salina, Tetraselmis suecica, Cylindrotheca closterium, Phaeodactylum tricornutum
and Rhodomonas sp. ↑ indicates sampling at mid-exponential and stationary phases for pigment analysis. A. carterae Time (Days) 0 2 4 6 8 10 12 14 16 18 20 C el l co u n ts ( ce ll . m l-1 ) 0 2e+5 4e+5 6e+5 8e+5 Cell Counts G. catenatum Time (Days) 0 2 4 6 8 10 12 14 16 18 20 C el l co u n ts ( ce ll . m l-1 ) 0 2e+2 4e+2 6e+2 8e+2 1e+3 D. salina Time (Days) 0 2 4 6 8 10 12 14 16 18 20 C el l co u n ts ( ce ll . m l-1 ) 0 1e+6 2e+6 3e+6 4e+6 5e+6 6e+6 7e+6 8e+6 T. suecica Time (Days) 0 2 4 6 8 10 12 14 16 18 20 C el l co u n ts ( ce ll . m l-1 ) 0 5e+5 1e+6 2e+6 2e+6 3e+6 3e+6 C. closterium Time (Days) 0 2 4 6 8 10 12 14 16 18 20 C el l co u n ts ( ce ll . m l-1 ) 0.0 2.0e+3 4.0e+3 6.0e+3 8.0e+3 1.0e+4 1.2e+4 1.4e+4 1.6e+4 P. tricornutum Time (Days) 0 2 4 6 8 10 12 14 16 18 20 C el l co u n ts ( ce ll . m l-1 ) 0.0 2.0e+6 4.0e+6 6.0e+6 8.0e+6 1.0e+7 1.2e+7 1.4e+7 1.6e+7 Rhodomonas sp. Time (Days) 0 2 4 6 8 10 12 14 16 18 20 C el l co u n ts ( ce ll . m l-1 ) 0.0 2.0e+5 4.0e+5 6.0e+5 8.0e+5 1.0e+6 1.2e+6 1.4e+6 1.6e+6
Chapter 2
20
Table 1. Mean cell length and width (n = 40), growth rate (k), doubling time (T2) and initial density for the different studied phytoplankton species.
A. carterae G. catenatum D. salina T. suecica C. closterium P. tricornutum Rhodomonas sp.
Length (µm) 15.2 41.1 12.4 11.2 74.7 13.9 10.5
Width (µm) 10.5 36.6 6.9 1.4 9.9 3.8 5.4
k (d-1) 0.274 0.091 0.278 0.241 0.171 0.438 0.347
T2 (d) 3.7 11.0 3.6 4.1 5.9 2.3 2.9
Phytoplankton pigment ratios
21
Exponential vs Stationary Growth Phase
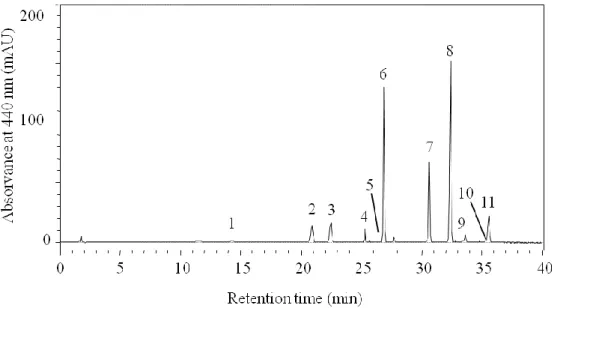
A total of 25 pigments were separated and identified in the studied phytoplankton species sampled at ExpP and StaP. Fig. 2 shows the HPLC chromatogram at 440 nm for
D. salina, sampled at ExpP. Concentrations of some pigments (e.g. chlorophyllide a and b) were extremely low and are not shown. Concentrations of pigments for which a
standard was not available were not calculated (e.g. peridininol, dinoxanthin). The pigment concentrations (pg cell-1) and pigment/Chl a ratios for the other identified pigments, as well as DPS, VAZ/Chl a and DD+DT/Chl a ratios, for the different studied phytoplankton species in ExpP and StaP, are shown in Tables 2 and 3.
Consistently higher concentrations of light-harvesting photosynthetic pigments per cell were found at ExpP compared to StaP (Table 2). Among these photosynthetic pigments were Chl c1 and Chl c2, peridinin (Per), fucoxanthin (Fuc), neoxanthin, (Neo),
violaxanthin (Vio), Alloxanthin (Alo), diadinoxanthin (DD), Chl b, and Chl a. On the contrary, concentrations of photo-protective pigments such as diatoxanthin (DT) were higher at StaP for G. catenatum and C. closterium (Table 2). The same pattern was observed for the concentrations of photo-protective pigments antheraxanthin (Ant) and zeaxanthin (Zea) for D. salina and T. suecica (Table 2). Consistently higher pigment/Chl a ratios were found at StaP compared to ExpP (Table 3). There were few exceptions like higher Vio/Chl a ratios for D. salina and T. suecica at ExpP.
Marker pigment/Chl a ratios and changes in these ratios due to growth phase showed differences between species within the same phytoplankton group. For diatoms, Fuc/Chl
a ratio in C. closterium was constant and independent of growth phase (ca. 0.6),
whereas in P. tricornutum this ratio increased more than 2-fold from ExpP to StaP (from 0.6 to 1.4). Both A. carterae and G. catenatum are Per containing dinoflagellates.
Chapter 2
22 Per/Chl a ratio increased less than 25% from ExpP to StaP, ranging from 0.554 and 0.625 in A. carterae and 0.350 and 0.429 in G. catenatum (Table 3).
Vio/Chl a ratios were about 2-fold higher in prasinophyceae T. suecica (0.162-0.127) than in chlorophyceae D. salina (0.067-0.052), whereas changes in these ratios due to growth phase were lower than 30%. Lutein/Chl a (Lut/Chl a) ratios were higher in D.
salina than in T. suecica at corresponding growth phases. Changes in Lut/Chl a from
ExpP to StaP were 58% in T. suecica and were more than 2-fold higher in D. salina at StaP. Chl b/Chl a ratios were more constant (ca. 0.55), with the exception of the lower ratio for D. salina at ExpP (0.37). Zea/Chl a ratios were also significantly affected by growth phase, being 2.5 and 10.5-fold higher at StaP for T. suecica and D. salina, respectively. For the cryptophyceae Rhodomonas sp., growth phase also affected the Alo/Chl a ratio, changing from 0.374 at ExpP to 0.475 at StaP (Table 3).
All ratios based on xanthophyll cycle pigments to Chl a (VAZ and DD+DT) changed significantly with growth phase. Consistently higher VAZ/Chl a or DD+DT/Chl a ratios were observed under StaP (Table 3). DPS ratios were also consistently higher under StaP (Table 3, Fig. 3). For P. tricornutum, these ratios were not calculated because DT was below detection limits, whereas for Rhodomonas sp. photo-protective pigments were not identified.
Phytoplankton pigment ratios
23
Table 2. Mean values of pigment (picograms per cell) at exponential (Exp) and stationary (Sta) growth phase for the different studied phytoplankton species. *, **, *** values significantly different at p < 0.05, p < 0.01, p < 0.001, respectively. n. d., Not Detected.
A. carterae G. catenatum D. salina T. suecica C. closterium P. tricornutum Rhodomonas sp.
Pigments (pg.cell-1) Exp Sta Exp Sta Exp Sta Exp Sta Exp Sta Exp Sta Exp Sta
Chl c2 2.43 ** 0.742 23.6 * 14.8 - - - - 1.34 *** 0.572 0.050 *** 0.022 0.257 ** 0.072 Chl c1 - - - 1.75 *** 0.722 0.026 *** 0.013 - - Peridinin 2.91 ** 0.965 28.9 ** 14.9 - - - - Fucoxanthin - - - 9.37 *** 3.32 0.248 *** 0.125 - - Neoxanthin - - - - 0.029 *** 0.018 0.061 0.046 - - - - Violaxanthin - - - - 0.035 *** 0.010 0.118 * 0.073 - - - - Antheraxanthin - - - - 0.015 ** 0.022 0.009 * 0.024 - - - - Zeaxanthin - - - - 0.012 *** 0.048 0.013 * 0.025 - - - - Lutein - - - - 0.126 * 0.104 0.139 0.174 - - - - Alloxanthin - - - 0.434 ** 0.164 Diadinoxanthin 1.09 ** 0.448 11.6 ** 5.70 - - - - 1.16 ** 0.62 0.046 * 0.038 - - Diatoxanthin 0.164 0.117 0.840 * 1.22 - - - - 0.050 ** 0.076 n. d. n. d. - - Chl b - - - 0.195 ** 0.104 0.408 0.329 - - - - Chl a 5.28 ** 1.54 82.9 ** 35.1 0.528 *** 0.190 0.733 0.578 15.0 *** 5.43 0.404 *** 0.089 1.16 ** 0.347 β-Carotene 0.079 ** 0.008 1.65 * 0.427 0.026 ** 0.012 0.032 0.049 0.213 ** 0.015 0.008 *** n.d. 0.020 0.009
Chapter 2
24
Table 3. Mean values of pigment/Chl a ratios at exponential (Exp) and stationary (Sta) growth phase for the different studied phytoplankton species. *, **, *** values significantly different at p < 0.05, p < 0.01, p < 0.001, respectively. n. d., Not Detected.
A. carterae G. catenatum D. salina T. suecica C. closterium P. tricornutum Rhodomonas sp.
Ratios (Pigment/Chl a) Exp Sta Exp Sta Exp Sta Exp Sta Exp Sta Exp Sta Exp Sta
Chl c2 0.459 0.479 0.285 * 0.424 - - - - 0.089 ** 0.105 0.124 *** 0.221 0.221 0.208 Chl c1 - - - 0.117 *** 0.133 0.064 *** 0.148 - - Peridinin 0.554 ** 0.625 0.349 0.429 - - - - Fucoxanthin - - - 0.625 0.611 0.614 *** 1.401 - - Neoxanthin - - - - 0.055 ** 0.094 0.084 0.079 - - - - Violaxanthin - - - - 0.067 * 0.052 0.162 * 0.127 - - - - Antheraxanthin - - - - 0.029 *** 0.117 0.014 *** 0.041 - - - - Zeaxanthin - - - - 0.024 *** 0.252 0.017 *** 0.042 - - - - Lutein - - - - 0.239 ** 0.553 0.191 *** 0.302 - - - - Alloxanthin - - - 0.374 ** 0.475 Diadinoxanthin 0.207 *** 0.291 0.140 0.163 - - - - 0.077 ** 0.114 0.115 *** 0.423 - - Diatoxanthin 0.032 ** 0.078 0.010 ** 0.035 - - - - 0.003 *** 0.014 n. d. n. d. - - Chl b - - - - 0.370 *** 0.547 0.557 * 0.569 - - - - β-Carotene 0.015 ** 0.005 0.019 0.012 0.049 ** 0.065 0.044 ** 0.083 0.014 ** 0.003 0.019 *** 0.002 0.017 0.025 VAZ/Chl a - - - - 0.119 *** 0.421 0.193 0.211 - - - - (DD + DT)/Chl a 0.238 *** 0.368 0.150 * 0.197 - - - - 0.081 ** 0.128 - - - - DPS 0.132 ** 0.211 0.068 *** 0.176 0.438 *** 0.877 0.160 *** 0.399 0.041 *** 0.109
Phytoplankton pigment ratios
25
Fig. 2. HPLC chromatogram at 440 nm of D. salina at exponential growth phase: 1 - Chlorophyllide a, 2 - Neoxanthin, 3 - Violaxanthin, 4 - Antheraxanthin, 5 - Zeaxanthin, 6 - Lutein, 7 - Chlorophyll b, 8 - Chlorophyll a, 9 - Pheophytin a, 10 – β,ε-carotene, 11 – β,β-carotene.
Fig. 3. De-epoxidation state (DPS; mean ± standard deviation) for A. carterae, G. catenatum, D. salina, T.
suecica and C. closterium in exponential and stationary growth phases.
Species A. carte rae G. caten atum D. salina T. suecic a C. closte rium D PS 0.0 0.2 0.4 0.6 0.8 1.0 Exponential Stationary .
Chapter 2
26
Irradiance Levels
The pigment concentrations (pg cell-1) and pigment/Chl a ratios, as well as DPS, VAZ/Chl a and DD+DT/Chl a ratios, for A. carterae, C. closterium, and T. suecica cultured under different irradiance levels are shown in Table 4.
Consistently higher concentrations of light-harvesting photosynthetic pigments per cell were observed under low light (LL), intermediate for medium light (ML) and lower for high light (HL). Among these photosynthetic pigments were Chls c1 and Chl c2, Per,
Fuc, Neo, Vio, DD, Chl b, and Chl a. On the contrary, concentrations of photo-protective pigment DT were higher under HL, intermediate for ML and lower under LL, for both A. carterae and C. closterium. (Table 4). For T. suecica, concentrations of photo-protective pigment Zea were lower under LL. No differences were found for Ant between light treatments (Table 4).
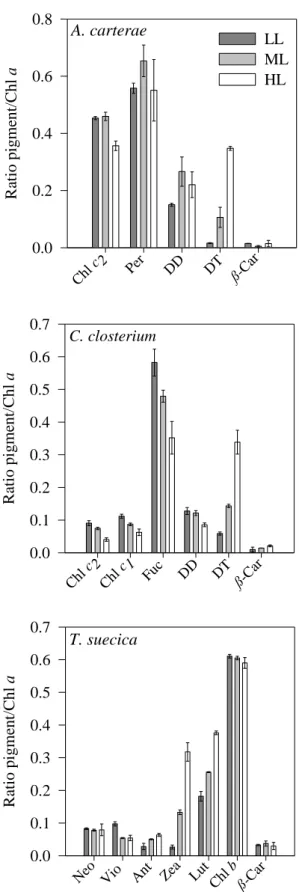
There were negligible effects of light treatments for most photosynthetic pigment/Chl a ratios (Table 4, Fig. 4). This was the case for marker pigment/Chl a ratios such as Per/Chl a for A. carterae and Neo, Vio and Chl b/Chl a for T. suecica. On the contrary, Fuc/Chl a in C. closterium showed significant differences between light treatments, ranging from 0.582 under LL and 0.352 under HL (Table 4, Fig. 4). Lut/Chl
a ratios increased significantly with light intensity for T. suecica doubling from LL to
HL (0.182 to 0.376). More pronounced was the change in Zea/Chl a for T. suecica with a 12-fold increase from LL to HL (Table 3, Fig. 4).
All ratios based on xanthophyll cycle pigments to Chl a (VAZ, and DD+DT) changed significantly with light treatment. Consistently higher ratios were observed under HL, intermediate for ML and lower for LL (Table 3). DPS ratios were also consistently higher under HL, intermediate for ML and lower for LL (Table 3).
Phytoplankton pigment ratios
27
Table 4. Mean pigment concentrations (picograms per cell) and pigment/Chl a ratios for A. carterae, C.
closterium and T. suecica grown under low light (LL, 10 µmol photons m-2 s-1), medium light (ML, 100 µmol photons m-2 s-1), and high light (HL, 400 µmol photons m-2 s-1). a, b, c values significantly different at p < 0.05.
A. carterae C. closterium T. suecica
Pigments (pg.cell-1) LL ML HL LL ML HL LL ML HL Chl c2 3.295a 1.140b 0.436b 0.726a 0.472b 0.196c - - - Chl c1 - - - 0.896a 0.550b 0.304c - - - Peridinin 4.063a 1.616b 0.668b - - - - Fucoxanthin - - - 4.659a 3.035b 1.704c - - - Neoxanthin - - - 0.152a 0.073b 0.025c Violaxanthin - - - 0.180a 0.051b 0.017b Antheraxanthin - - - 0.052 0.047 0.020 Zeaxanthin - - - 0.049a 0.125b 0.101b Lutein - - - 0.334a 0.239b 0.121c Diadinoxanthin 1.097a 0.650b 0.266c 1.023a 0.768b 0.416c - - - Diatoxanthin 0.117a 0.269ab 0.427b 0.472a 0.908b 1.641c - - - Chl b 1.121a 0.566b 0.190c Chl a 7.265a 2.488b 1.228b 8.045a 6.335b 4.864b 1.835a 0.934b 0.321c β-Carotene 0.107a 0.013b 0.018b 0.083 0.091 0.103 0.061a 0.035b 0.010c Ratios (Pigment/Chl a) - - - - Chl c2 0.453 0.459 0.356 0.091a 0.075b 0.040c - - - Chl c1 - - - 0.112 a 0.087b 0.063c - - - Peridinin 0.558 0.654 0.551 - - - - Fucoxanthin - - - 0.582a 0.479b 0.352c - - - Neoxanthin - - - 0.083 0.078 0.079 Violaxanthin - - - 0.098 0.054 0.054 Anteraxanthin - - - 0.028a 0.050b 0.064b Zeaxanthin - - - 0.027a 0.133b 0.318c Lutein - - - 0.182a 0.256b 0.376c Diadinoxanthin 0.150a 0.266ab 0.220b 0.128 0.122 0.086 - - - Diatoxanthin 0.016a 0.106b 0.348c 0.059a 0.143b 0.339c - - - Chl b - - - 0.590 0.605 0.611 β-Carotene 0.015 0.005 0.014 0.010 0.014 0.021 0.033 0.037 0.030 VAZ/Chl a - - - 0.152a 0.238b 0.436c (DD + DT)/Chl a 0.167a 0.372b 0.568c 0.187a 0.265b 0.424c - - - DPS 0.097a 0.287b 0.615c 0.316a 0.542b 0.798c 0.356a 0.772b 0.876b
Chapter 2 28 A. carterae R at io pi g m ent /C hl a 0.0 0.2 0.4 0.6 0.8 LL ML HL Chl c 2 Per DD DT ß-Car R at io pi g m ent /C hl a 0.0 0.1 0.2 0.3 0.4 0.5 0.6 0.7 C. closterium T. suecica R at io pi g m ent /C hl a 0.0 0.1 0.2 0.3 0.4 0.5 0.6 0.7 Chl c 2 Chl c 1 Fuc DD DT ß-Car Neo Vio Ant Zea Lut Chl b ß-Ca r
Fig. 4. Pigment/Chl a ratios (mean ± standard deviation) for A. carterae, C. closterium and T. suecica at low (LL), medium (ML), and high light (HL).
Phytoplankton pigment ratios
29
Discussion
Regarding their function in the cell, pigments can be divided into light-harvesting or photosynthetic pigments and photo-protective pigments. The first are involved in the transfer of energy to reaction centers in photosynthesis, while the second help prevent damages to the chloroplasts from excess light energy. Effects of growth phase and irradiance on phytoplankton pigment to Chl a ratios were different for light-harvesting and photo-protective pigments.
Effects of Growth Phase
Generally, pigment concentrations per cell decreased from ExpP to StaP, as nutrients became limiting for growth and cells aged. The exceptions were higher DT for diatoms and higher Ant and Zea for D. salina and T. suecica at StaP. This shows that photo-protective pigments tend to increase when cell growth becomes stationary, possible due to its involvement in preventing cell photo-oxidative damages.Latasa (1995) and Latasa and Berdalet (1994) found increased DT and DT/Chl a ratios in dinoflagellate
Heterocapsa sp. and diatom Thalassiossira weissflogii at StaP under low and high
irradiances and speculated that DT accumulation may also indicate a change in cellular metabolism independent of irradiance.
Generally, the decrease in cellular Chl a was more pronounced than for other pigments resulting in increased pigment/Chl a ratios from ExpP to StaP. Henriksen et al. (2002) also found consistently increased pigments to Chl a ratios from ExpP to StaP in marine phytoplankton species. Schlüter et al. (2000) found pigment/Chl a ratios within the same range for both growth phases in coastal and estuarine species, with some exceptions such as the 2-fold increase of Fuc/Chl a ratio in StaP of the diatom
Chapter 2
30 result of nutrient limitation, may be related to the fact that carotenoids do not contain nitrogen and changes in intracellular concentrations are smaller than for Chl a. However, this was also the case for Chl b/Chl a in D. Salina and Chl c1/Chl a and Chl
c2/Chl a for C. Closterium and P. tricornutum and Chl c2/Chl a for G. Catenatum.
The most dramatic changes in marker pigment/Chl a ratios from ExpP to StaP were observed for Fuc/Chl a in P. tricornutum and Zea/Chl a in D. salina. However, results indicate that even within the same taxonomic group the effect of growth phase may vary between species, since for the diatom C. closterium Fuc/Chl a ratios were constant. Usually, pigment/Chl a ratios used in CHEMTAX are obtained from phytoplankton cultures in ExpP and therefore do not take into consideration changes that may occur later in growth. The experimental results on algal cultures for StaP have been neglected for chemotaxonomical purposes probably because of extreme nutrient and light limitation. However, such conditions may mimic to some extend natural occurring situations such as bloom decline and relevance for coastal, more eutrophic areas cannot be ruled out.
Schlüter and Mølenberger (2003) proposed that chlorophytes and prasinophytes without prasinoxanthin could be distinguished by their relative Lut/Chl b ratios. This ratio in D. salina ranged from 0.65 at ExpP and 1.0 at StaP, within the range 0.30-1.77 reported for chlorophytes by Schlüter and Mølenberger (2003). However, Lut/Chl b ratios for T. suecica ranged between 0.34 at ExpP and 0.53 at StaP, much higher than the range 0.00-0.18 found by Schlüter and Mølenberger (2003) for prasinophytes.
Effects of Irradiance
Pigment concentrations on per cell basis decreased with increasing irradiance, as cells photo-acclimate regulating the size of the light harvesting antennae. As expected, the
Phytoplankton pigment ratios
31 exceptions to this trend were the photo-protective pigments DT, Zea and Ant. Xantophyll de-epoxidation of Vio to Zea via Ant and DD to DT allows the regulation of excess energy through heat dissipation, enabling the protection of the photosynthetic apparatus (see review by Goss and Jakob, 2010).
Changes in photosynthetic pigment/Chl a ratios were negligible between light treatments for dinoflagellate A. carterae (Per/Chl a) and prasinophyceae T. suecica (Neo, Vio and Chl b/Chl a). Pigments that have a light-harvesting photosynthetic function and that are embedded in light-harvesting complexes tend to co-vary with Chl
a (Goericke & Montoya, 1998; Schlüter et al., 2000; Rodríguez et al., 2005), leading to
the constancy of pigment/Chl a ratios under different irradiances. Exception to this trend was the reduced Fuc/Chl a in C. closterium under HL. Schlüter et al. (2000) and Henriksen et al. (2002) reported relatively constant Fuc/Chl a ratios for diatoms P.
tricornutum and D. brightwellii grown under different light intensities.
Increased Zea/Chl a in T. suecica was observed under HL. Similar results were observed for prasinophyte Pseudoscourfieldia marina (Rodríguez et al., 2005). Zea plays an important role in photo-protection and is expected to change in algal cells as a result of different light treatments. In the case prasinophytes may contribute significantly to Zea concentrations in natural samples, microscopic cell counts is probably essential to discriminate between this group and cyanobacteria as the dominant source of marker pigment Zea (Rodríguez et al., 2005). Although Lut is not a xantophyll cycle pigment, increased Lut/Chl a in T. suecica under HL was observed. Lut is known to be linked to photo-protection, as previously reported for prasinophytes T. suecica (Borghini et al., 2009), P. marina and Bathycoccus prasinos (Rodríguez et al., 2005).
Chapter 2
32
Concluding Remarks
This study shows that growth phase and light intensity have significant effects on pigment/Chl a ratios, including many marker pigments, and this should be taken into account in the application of chemotaxonomical approaches to phytoplankton natural communities. Construction of the initial matrices for the application of CHEMTAX should carefully consider the characteristics of the studied marine system in respect to the availability of light and nutrients.
Schlüter et al. (2000) found that interspecies variation in pigment/Chl a ratios within a individual phytoplankton group were more pronounced than variations caused by the different growth conditions. This indicates that the ratios chosen for CHEMTAX calculations should reflect the dominant phytoplankton species present in the targeted environment (Mackey et al., 1996; Lewitus et al., 2005). Differences in pigment/Chl a ratios for species within the same phytoplankton group observed in the present study support these observations and underline the importance of obtaining pigment data from regional isolates. The use of HPLC pigment analysis is a powerful tool for estimating the quantitative contribution of different phytoplankton groups to total Chl a in natural communities and this has lead to the inclusion of this technique in many monitoring programs. However, screening by microscopy is recommended since it reduces the risk of misinterpretation of HPLC pigment data.
Acknowledgements
35
Physiological vs. behavioral photo-protection
37
Physiological versus behavioral photo-protection of intertidal epipelic and
epipsamic microalgae benthic communities
Abstract
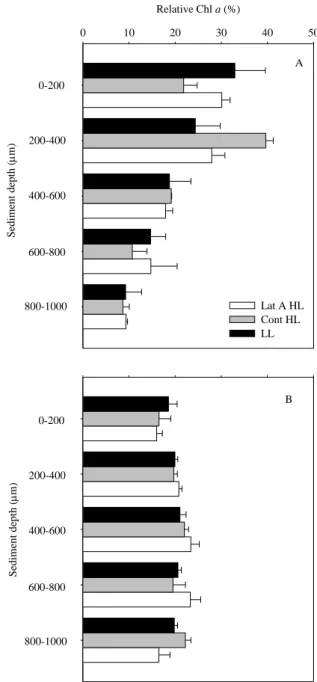
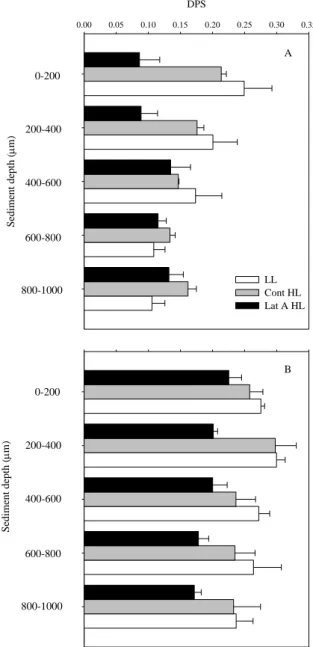
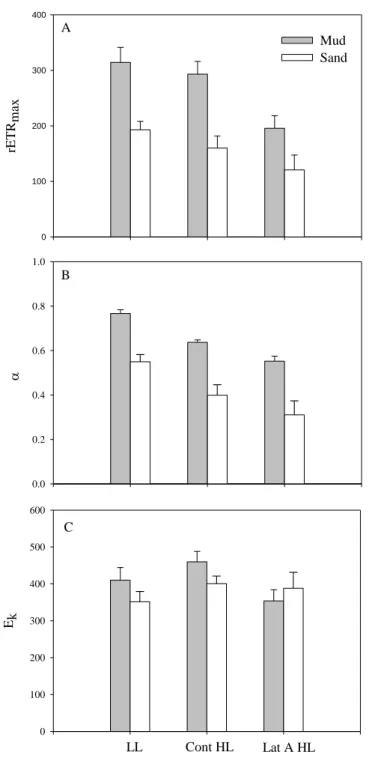
Physiological and behavioral photo-protection of intertidal epipelic and epipsamic microphytobenthos (MPB) communities were compared with high vertical resolution using High Performance Liquid Chromatography (HPLC) pigment analysis, and Pulse Amplitude Modulated (PAM) fluorescence. Downward cell movement from the surface 200 μm mud sediment layer was observed in epipelic MPB communities upon exposure to high light (HL). Differences in rapid light curve (RLC) parameters α (initial slope of the RLC) and rETRmax (relative maximum electron transport rate) between migratory and non-migratory epipelic biofilms, obtained after the addition of lantruculin A (Lat A) diatom motility inhibitor, strongly indicates that photo-phobic migration of benthic diatoms has a direct protective role – behavioral protection. This photo-protective mechanism was absent in epipsamic MPB communities of sandy sediments. Increased de-epoxidation state (DPS, DT/DD+DT) was observed in both epipelic and epipsamic MPB biofilms after exposure to HL. In the mud, this was observed in the 0-400 μm sediment layers, whereas for the sand it was found throughout the sediment profile up to 1 mm, due to deeper light penetration in the latter type of sediment. The two diatom communities showed different photo-regulatory strategies: the epipelic community of muddy sediments photo-regulated using both physiological and behavioral photo-protection, while the epipsamic community of sandy sediments used exclusively physiological mechanisms.
Chapter 3
38
Keywords: diatoms, microphytobenthos, migration, photo-protection, xanthophyll
cycle
Introduction
Benthic microalgae inhabiting intertidal mud and sand flats of estuaries and shallow coastal zones – microphytobenthos (MPB) – have been identified as one of the most important primary producers in these ecosystems (MacIntyre et al., 1996; Underwood & Kromkamp, 1999). MPB is largely dominated by diatom species, although other groups of microalgae occur frequently, such as cyanobacteria and euglenids.
MPB free-living diatoms characteristic of muddy sediments – referred to as epipelic – are known to exhibit partially endogenous vertical migratory rhythms synchronized with diurnal and tidal cycles (Round & Palmer, 1966; Admiraal, 1984; Serôdio et al., 1997; Consalvey et al., 2004). These microalgae accumulate at the surface of the sediment during diurnal low tides, forming dense, highly productive biofilms, and migrate downwards before tidal inundation or night. The movement of epipelic diatoms within the sediment matrix is associated to the excretion of polymeric substances (Paterson, 1989). Diatoms attached to the particles of sandy sediments – referred to as epipsamic – do not shown such migratory patterns (Round, 1979; Admiraal, 1984; Jesus et al., 2009).
The vertical movements of epipelic diatoms have also been associated with external stimuli such as irradiance, as diatoms position themselves at the sediment depth of optimum light environment, while avoiding photoinhibitory light levels – behavioral photo-protection (Admiraal, 1984; Kromkamp et al., 1998; Perkins et al., 2001; Serôdio
Physiological vs. behavioral photo-protection
39 et al., 2006). Additionally, diatoms use the xanthophyll cycle, the reversible de-epoxidation of pigment diadinoxanthin (DD) into the energy dissipating form diatoxanthin (DT) as a physiological photo-protection mechanism. This non photochemical quenching (NPQ) mechanism diverts excessive light energy from photosystem II reaction centers limiting damage to the photosynthetic apparatus (see review by Goss & Jakob, 2010).
The development of an exceptional high capacity for rapid and large non-photochemical quenching induction under light stress has been shown for planktonic diatoms (Lavaud et al., 2002; Ruban et al., 2004) and cell suspensions of benthic diatoms (Serôdio et al., 2005). In undisturbed benthic diatom communities, the characterization of photo-physiological responses to high light as been hampered by the interference of vertical migration and depth-integration on the analysis of variable chlorophyll fluorescence (Serôdio et al., 1997; Perkins et al., 2002; Serôdio, 2004; Jesus et al., 2006a). Recently, Cartaxana & Serôdio (2008) used a diatom movement inhibitor – Latrunculin A (Lat A) – to demonstrate the importance of vertical migration in regulating light exposure. Using the same method, Perkins et al. (2010) have compared behavior and physiological down regulation in an epipelic diatom community and concluded that vertical cell movement was the primary response to increasing light dose.
Although many studies have dealt with the photo-physiology of intertidal epipelic diatoms (e.g. Serôdio et al., 1997; Perkins et al., 2001; Cartaxana & Serôdio, 2008; Perkins et al., 2010) much less is known for epipsamic communities (Jesus et al., 2009). It was the objective of this study to compare physiological and behavioral photo-protection of intertidal epipelic and epipsamic communities of the Tagus estuary mud and sand flats. If migration and behavioral photo-protection are absent in epipsamic
Chapter 3
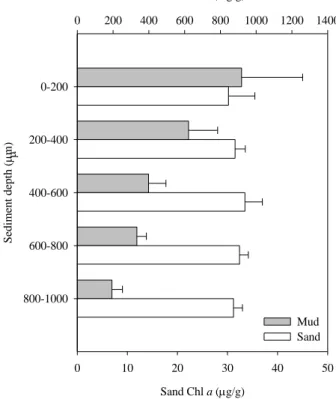
40 diatoms, it is hypothesized that physiological processes are more important in these communities. On the other hand, the application of Lat A allowed the comparison of undisturbed non-migratory, depending exclusively on physiological processes, and migratory biofilms under different irradiances. This study compared sediment profiles using High Performance Liquid Chromatography (HPLC) pigment analysis performed on 200 µm sediment depth layers, to analyze behavioral versus physiological processes with high vertical resolution.
Materials & Methods
Experimental design and sampling
Sediment cores (8 cm diameter) were collected on the 7th and 9th of April 2008 from Alcochete mud and sand flats, located on the eastern shore of the Tagus Estuary (38 44' N, 9 08' W). Two sites were sampled: a mud site with 97% particles <63 μm, on the first day, and a sand site composed of a mixture of very fine to coarse sand, between 125 and 1000 μm (for details see Jesus et al., 2006b), on the second day (hereafter called mud and sand, respectively). All experimental measurements were carried out on the following day of sampling. The sediment was left overnight in the laboratory with a shallow depth of site water (± 2 cm), carefully added so as not to re-suspend the sediment.
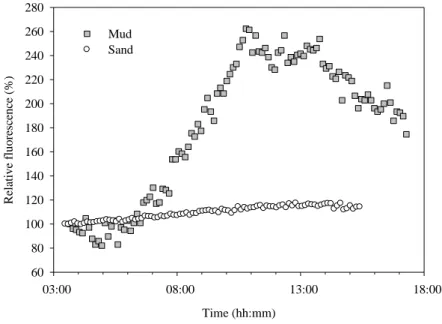
The following morning, the water from one core was removed and the minimum fluorescence (F0) measured every 7 min using a Pulse Amplitude Modulated (PAM)
fluorometer (Diving PAM, Walz, Germany), in total darkness to detect and follow endogenous vertical migration rhythms. In another core, light attenuation throughout the