TESTING INFORMATION EFFICIENCY IN THE
PORTUGUESE STOCK MARKET
Ricardo Emanuel Sarmento Correia
A Dissertation presented in partial fulfillment of the Requirements for the Degree of Master in Finance
Supervisor:
Pedro Leite Inácio, Instituto Superior de Ciências do Trabalho e da Empresa – Instituto Universitário de Lisboa
Ao meu Irmão Ao meu Pai À mulher da minha vida
i
Abstract
This study attempts to discuss information efficiency based on empirical evidence about the Portuguese stock market. We examine the abnormal returns surrounding earnings announcements for all available data on I/B/E/S for the Portuguese stock market and conclude that the evidence partly support the previous studies. Furthermore, our results show persistence of the abnormal returns in the pre-event window and on day zero (i.e. one trading day before the announcement was made public), two anomalies that were previously documented. This fact lead us to argue that the Portuguese stock market is not informational efficient.
In addition, our findings about forecast bias suggest to some extent the existence of forecast optimism in Portuguese stock market for Earnings Per Share (EPS), Dividend Per Share (DPS) and Cash Flow Per Share (CPS). Our study points out that the forecast optimism is limited when one proceed to the correction of a currency code bias (CCB) present in I/B/E/S. Since this CCB could significantly influence the results we suggest that studies about European countries that adopted the Euro must account for this issue. In this work, we also compare some of the most known available financial databases to analyze the daily trading volume of the listed firms on Euronext Lisbon and we present the limitations of the available data. According to our conclusions there are a small number of thinly traded stocks considering all available data about these firms.
Keywords: Market Efficiency, Event Studies, Earnings Announcements, Abnormal Returns, Thin Trading, Forecast Optimism, Efficient Market Theory, Behavioral Finance, Corporate Finance.
ii
Resumo
Este estudo pretende discutir a eficiência informacional baseando-se em evidência empírica para o mercado accionista português. Neste trabalho analisamos as rendibilidades anormais em torno dos anúncios de resultados para a totalidade de dados existentes na I/B/E/S relativamente a este mercado e corroboramos parcialmente a literatura existente. De acordo com os resultados obtidos verificamos a persistência de rendibilidades anormais na janela anterior ao evento e no dia 0 (i.e. na sessão de bolsa anterior ao anúncio ser efectuado), duas anomalias previamente documentadas. Estes factos permitem-nos afirmar que o mercado accionista português não é eficiente em termos informacionais.
Adicionalmente, os resultados obtidos sobre o enviesamento das previsões dos analistas financeiros sugerem uma evidência parcial de que o mercado accionista português apresenta um efeito de optimismo nas previsões dos analistas relativamente aos Earnings Per Share (EPS), Dividend Per Share (DPS) e Cash Flow Per Share (CPS). O nosso estudo demonstra que este optimismo nas previsões é influenciado pela correcção do enviesamento do código cambial (ECC) existente na I/B/E/S. Dado que o ECC pode influenciar significativamente os resultados consideramos que estudos sobre países europeus que adoptaram o euro devem ter em conta esta limitação. Neste trabalho, comparamos ainda algumas das mais conhecidas bases de dados financeiras na análise do volume diário de transacções para as empresas cotadas actualmente na Euronext Lisbon e documentamos as principais limitações. Segundo a nossa análise existe um pequeno número de empresas que não são frequentemente transaccionadas, considerando todos os dados existentes para as referidas empresas.
Palavras-chave: Eficiência de Mercado, Estudo de Eventos, Anúncios de resultados, Rendibilidades Anormais, Thin Trading, Optimismo de Previsões, Teoria da Eficiência do Mercado, Finanças Comportamentais, Corporate Finance.
iii
Acknowledgments
I am indebted to my supervisor Pedro Leite Inácio for all the suggestions and comments provided. I would like to acknowledge insightful comments and help from Professor José Paulo Esperança, Professor João Pedro Pereira, and also from my colleagues and friends Sandra Nave, Ana Costa, Diogo Moreira and Ricardo Vilares.
I am very grateful to the Portuguese researchers that previously performed studies about related subjects.
I also thank Susete Lourenço, from the library of the CMVM (Comissão de Mercado de Valores Mobiliários), for the remarkable help in the preliminary research about this issue in the Portuguese stock market.
I also would like to thank INDEG/ISCTE (Instituto para o Desenvolvimento da Gestão Empresarial do ISCTE), ISCTE – IUL (Instituto Superior de Ciências do Trabalho e da Empresa – Instituto Universitário de Lisboa) and FCT (Fundação para a Ciência e a Tecnologia) for making available all the databases and the majority of the papers used in this work.
Finally, special thanks are due to Professor José Dias Curto, Professor José Gonçalves Dias and Professor Vivaldo Mendes for helpful discussion, ideas, application of methodologies and patience.
Any omissions and errors, inevitably present in this work, are the responsibility of the author.
iv
Contents
1 Introduction ... 1
2 Efficient Markets and Behavioral Finance ... 3
2.1 Efficient Market Hypothesis (EMH) ... 3
2.2 Behavioral Finance ... 7
2.3 EMH and Behavioral Finance - Where do we stand? ...10
3 Event Studies ...14
3.1 Event Studies – Publications over the last decade ...14
3.2 Event Studies - Introduction ...15
3.3 Event Studies – Portuguese background ...16
4 Data and methodology procedures ...19
4.1 Data ...19
4.2 Measurement of abnormal returns ...20
4.3 Time line of the event study ...25
4.4 Thin trading ...27
4.4.1 Databases analysis ...29
4.4.1.1 Datastream ...29
4.4.1.1 Bloomberg ...32
4.4.1.2 Limitations of the available data ...34
5 Results ...35
6 Limitations of the results ...39
7 Bias in analysts’ forecasts...41
8 Conclusions ...46
v
Tables
Table 1 -Papers about "Information and Market Efficiency; Event Studies" (1998-2008)……….
Table 2 -Number of papers about General Financial Markets (G1) in 2008 -
disaggregation by secondary level of classification ...15
Table 3 -Some background on event studies in Portuguese stock market ...18
Table 4 - Comparison of event period and estimation window employed in event studies literature ...26
Table 5 - Trading frequency of the actual Portuguese listed companies using Datastream’s volume data ...31
Table 6 - Trading frequency of the actual Portuguese listed companies using Bloomberg’s volume data ...33
Table 7 -Results of AAR and CAAR of EPS announcements – Bad and Good News……….… ...36
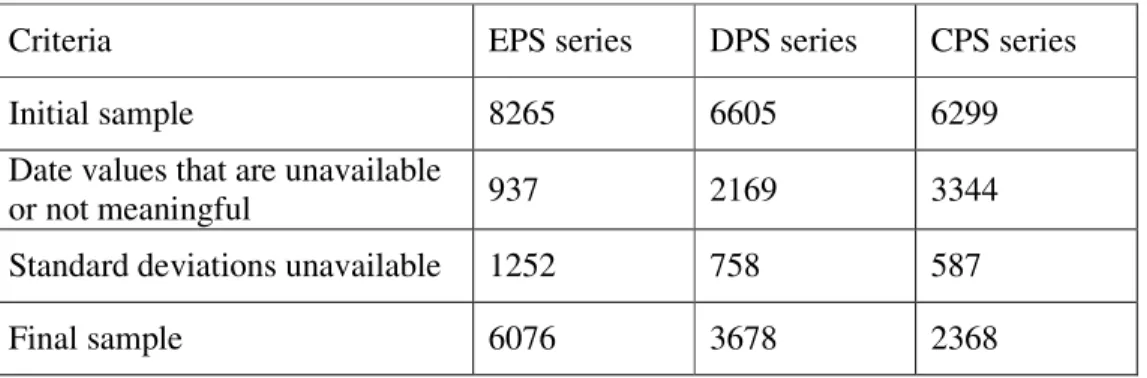
Table 8 - Final samples of FE after application of selection criteria ...42
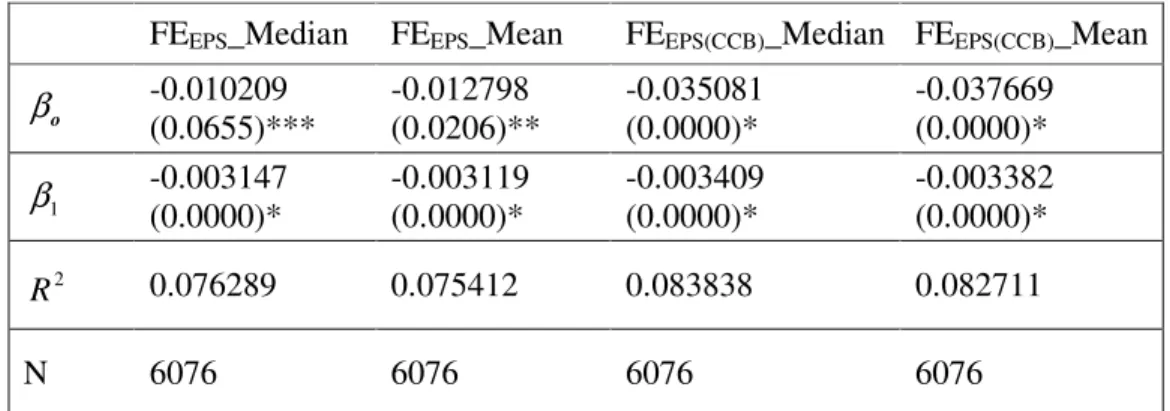
Table 9 - Forecast error regressions of Earnings Per Share (EPS) ...43
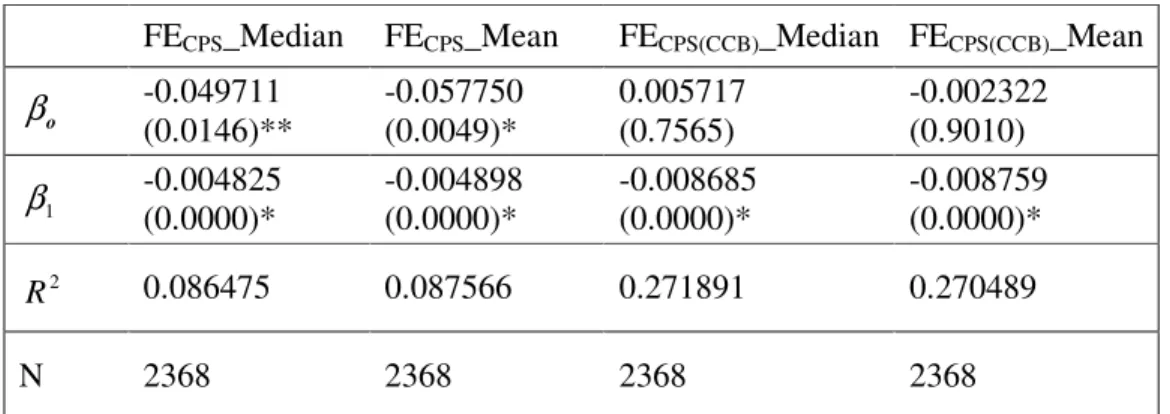
Table 10 - Forecast error regressions of Dividends Per Share (DPS) ...44
Table 11 - Forecast error regressions of Cash Flows Per Share (CPS) ...44 14
vi
Figures
Figure 1 - The EMH view ...11 Figure 2 - The Behavioral Finance view ...11
vii
Abbreviations
AR - Abnormal Returns
AAR - Average Abnormal Returns CPS - Cash Flow Per Share
CMVM - Comissão de Mercado de Valores Mobiliários CAR - Cumulative Abnormal Returns
CAAR – Cumulative Average Abnormal Returns CCB - Currency Code Bias
DPS - Dividends Per Share EPS - Earnings Per Share
EMH - Efficient Market Hypothesis EUR - Euro
I/B/E/S - Institutional Brokers Estimate System JEL - Journal of Economic Literature
OLS - Ordinary Least Squares PTE - Portuguese Escudo
viii
Abbreviations of papers cited
BOP - Bartholdy, Olson and Peare (2007) DMS - Diether, Malloy and Scherbina (2002) DRS - Dombrow, Rodriguez and Sirmans (2000) FFJR - Fama, Fisher, Jensen and Roll (1969)
ix
Commonly used Notations
it
R - Return of i-th stock for period t.
mt
R - Market return for period t.
m
R - Mean market return over the estimation window.
i
R - Arithmetic mean of the i-th stock’s return over the estimation window. )
(Rit
E - Expected or normal return of i-th stock on day t.
i
α - Intercept term.
i
β - Regression coefficient for the market return variable.
it
ε - Error term or regression residual.
i
∧
α andβ∧i - Estimated regressions coefficients of the market model. 2
i ε
σ - Variance of the i-th stock regression residuals. ) ( 2 it AR σ - Conditional variance of ARit. ) (Rm
Var - Variance of the market return over estimation window. L- Length of the estimation window.
it
AR - Abnormal return (AR) of i-th stock on day t.
t
AAR - Average abnormal return (AAR) on day t. )
(AARt
Var - Asymptotically variance of the AARt. )
, (t1 t2
CARi - Cumulative AR of the i-th stock between period t1and t2. )
, (1 2 2 t t
i
σ - Asymptotically variance of CARi(t1,t2) . )
, (t1 t2
CAAR - Cumulative AAR between period t1and t2.
) , ( (CAAR t1 t2
Var - Asymptotically variance of the CAAR(t1,t2). it
FE - Forecast error (FE) of variable in analysis on an annual basis. it
disp - Dispersion of forecasts between the analysts. o
β - Intercept term of the forecast error regression. 1
1
“Yes, (…) you can occasionally find markets that are ridiculously inefficient – or at least you can find them anywhere except at the finance departments of some leading business schools”. Warren Buffett, Berkshire Hathaway 2007 Shareholders' Letter, 2008, p. 17.
1 Introduction
A central theme in the finance and economic theory is market efficiency and, according to financial literature, one of the best available methodologies to analyze this issue is event studies. Brown and Warner (1980: 205), in their first classical paper about this issue, state that event studies “provide a direct test of market efficiency”. Thus, the primary intent of this study is to test information efficiency using the conventional methodology of event studies.
This study attempts to determine if the Portuguese stock market (hereafter Portuguese market) is efficient in the semi-strong form, finding evidence that supports the results of previous studies (e.g. Isidro (1998), and Duque and Pinto (2004)) for a larger period of analysis, since there is lack of evidence for more than a five year period. Using a sample of all Earnings Per Share (EPS) of listed firms in Euronext Lisbon (i.e. the Portuguese market) reported on I/B/E/S we tested the abnormal returns surrounding the earnings announcement date.
In the Portuguese market there is the conception that the market had historical thin trading (i.e. stocks with no trading). In Section 4 we pursue a narrower question: is the Portuguese market a thin trading market according to historical available data? We use two financial databases to elaborate this analysis: Datastream and Bloomberg. Finally, in section 7 we examine the analysts’ forecasts for three different variables in order to study the rationality of analysts.
2
The remainder of this thesis is organized as follows. Section 2 presents the review of the current literature about market efficiency and behavioral finance. Section 3 briefly presents event studies and the main papers about market efficiency and event studies produced in the last decade. Section 4 describes the data sample, the statistical and econometric techniques used to study the data, and also discusses the thin trading in the Portuguese market. Section 5 and 6 lay out the findings and examine their implications and limitations. Section 7 analyzes the evidence for analysts’ forecasts. Finally, section 8 concludes.
3
2 Efficient Markets and Behavioral Finance
2.1 Efficient Market Hypothesis (EMH)
The Efficient Market Hypothesis (hereafter EMH) is a widely accepted paradigm and has become part of financial and economic mainstream since at least the late 1950’s. As Jensen (1978) points out in the financial field this concept is under the category of the “theory of random walks” and “rational expectations theory” in the economic field. Although the concept is generally attributed to Fama (1970) the creator of the concept was Harry Roberts. At least in the late 1950s1 Roberts (1959) has implicit references to these concepts in his paper, although not defining the forms of efficiency.
When Roberts (1959: 1) states that “In extreme form such theories maintain that only the patterns of the past need to be studied, since the effect of everything else is reflected “on the tape” (…)” he clearly refers to a weak-form of EMH. Additionally Roberts (1959) made reference to the knowledge and skills of financial analysts, the statistical knowledge and the others skills of obtaining information about a stock, which is related to the concept of strong form of EMH and pointed out the importance of private information.
In general terms Roberts (1959: 7) presents market efficiency stating that “If the stock market behaved like a mechanically imperfect roulette wheel, people would notice the imperfect roulette wheel, people would notice the imperfections and by acting on them, remove them”.
1 LeRoy (1989) and Shiller (1999), among others, stated that the three forms of market efficient were presented by Harry Roberts (1967) in “Statistical Versus Clinical Prediction of the Stock Market”, an unpublished document presented in a seminar.
4
In the late 1960s, Ball and Brown (1968) and Fama, Fisher, Jensen and Roll (1969) (hereafter FFJR) developed the event study methodology more commonly used in financial literature and their results advocated the existence of information efficiency in the stock market2.
After that, Fama (1970) in an influential survey paper systematizes the three forms of market efficiency, stating that the market is efficient considering information set θ , if it is impossible to obtain economic profits on trades based t on information set θ , assuming that economic profits are risk adjusted returns t minus all the costs.
In the mid-1970s Rubinstein (1975: 812) defined three types of efficiency related to securities markets:
a) Exchange efficiency: The market is exchange efficient if “(…) participants are not motivated to create exchange arrangements not already provided by the market.”
b) Production efficiency: Production efficiency occurs when “(…) value-maximizing firms make Pareto optimal production decisions.”
c) Information efficiency: The market is efficiency in an informational sense if current security prices are costless known by market participants “(…) and information about future security prices is “fully reflected” in these present prices.”
That paper made several interesting points, such as the ambiguity of the concept of market efficiency under nontrivial context, the potential coexistence of
2 Ball and Brown (1968) find an anticipation effect where most of information within the annual reports is anticipated (i.e. known) by the market before the earnings announcement. The authors argue that market is efficient based on the fact that efficiency is determined by the quality of sources.
5
market efficiency with non-optimal behavior (i.e. non-optimal speculative trading) and the use of “highly specialized and unrealistic models of equilibrium” (Rubinstein (1975: 821)).
Jensen (1978) also mentions flaws related to the previous definition of market efficiency, namely a special mention to the fact that information publicly available at time “t” could be different from all information publicly available in that exact date3.
Fewer years later Beaver (1981: 23) argues that market efficiency problem “(…) is not simply that concepts are difficult to test empirically, a pervasive phenomenon not unique to the efficient market literature, rather, the problem is that, at a conceptual level, prior to empirical testing, it is unclear what is meant by the term market efficiency.” LeRoy (1989) and Beaver (1981), among other researchers, criticize the “fair game” model of Fama (1970) showing that it is tautological4.
In order to remove this implicit ambiguity in the term “information set” Beaver (1981: 28) introduced two new concepts of efficiency:
a) Signal efficiency (y-efficiency): “A securities market is efficient with respect to a signal ´'
t
y if and only if the configuration of security prices {Pjt} is
the same as it would be in an otherwise identical economy (i.e. with an identical configuration of preferences and endowments) except that every individual receives ´'
t
y as well as yit”.
3 Jensen (1978) also noticed that mainstream financial researchers show reluctance to discard the notion of semi-strong market efficiency even if the empirical results are inconsistent with the concept.
4 For more details about the debate involving this issue, see also LeRoy (1976) and Fama (1976).
6
b) Information system efficiency (η -efficiency): “A securities market is efficient with respect to ´'
t
η , if and only if y-efficiency holds for every signal (y´'t)
from ´'
t
η ”.
So in general terms, it can be stated that Beaver (1981), in line with the above comment of Jensen (1978), presents a detailed distinction of market efficiency between two information sets: with and without universal access to an information system of interest. The author also presents a new notion of efficiency with respect to an information set, claiming the existence of efficiency when prices act as if everyone knows that specific information set. However, half year early Grossman and Stiglitz (1980) present a paper that contested information efficiency and try to redefine it.
The authors suggested that costless information is not just sufficient, but necessary for “(…) prices “fully reflect” available information (…)” (Fama (1970: 384)). Thus, Grossman and Stiglitz (1980: 404) point out that the notion of EMH is a reducto adabsurdum, “(…) since price systems and competitive markets are important only when information is costly (…).” This fact is known in literature as the paradox of market informational efficiency.
In a sequel of the first paper about the EMH, Fama (1991) mentioned that despite the limitations to infer about market efficiency, especially the joint-hyphotesis problem, the empirical research about EMH is still an interesting field. Furthermore, this issue significantly influences market agents and generates a new financial landscape.
In the late 1990s, Fama (1998) discusses market efficiency and Behavioral Finance and discards the notion of market inefficiency related to long-term returns (probably the most consistent field of Behavioral Finance) mainly by two reasons: (1) overreaction is as frequent as underreaction and (2) long-term returns
7
anomalies are inconsistent when tested with alternative methodologies. So, as mentioned by Loughran and Ritter (2000), Fama’s argumentation focused on data-mining and in accordance to his analysis, since no reliable predictability is proven, informational market efficiency still is a robust paradigm.
2.2 Behavioral Finance
Kahneman and Tversky (1979) in one of the most cited paper ever of Econometrica criticize the expected utility theory and the rational choice paradigm. Although in the mid-1970s they have identified some important heuristics and bias of human behavior under uncertainty5, this article is by far the major influence in the change of the economic and financial conceptual framework established in the mainstream and in the growing field of Behavioral Finance.
Shefrin (2000: 3) in an influential book defines Behavioral Finance as “the application of psychology to financial behavior – the behavior of practitioners.” The author explains that practitioners are all people involved with financial activities, such as portfolio and firm managers, investors, brokers, analysts, traders, advisers, financial planners. These people are susceptible to make mistakes, based on rules of thumb, as well as to be influenced by the financial decision framework. Supported by these two arguments Behavioral Finance literature advocated that bias in judgments (also known as heuristic-driven bias) and framing effects lead to deviations of market prices from fundamentals.
5 Kahneman and Tversky (1974) identify at least three major bias of human behavior: (1) representativeness, (2) availability and (3) adjustment and anchoring. For detailed analysis of this issue vide Kahneman, Slovic and Tversky (1982).
8
One strong argument against market efficiency, presented by Shiller (1981) and LeRoy and Porter (1981) is the evidence of higher volatility in aggregate stocks price than the predicted by the efficient market theory.
Another issue that remains a puzzle is the equity premium. Written in 1979, only six years later Mehra and Prescott (1985) published their paper “The Equity Premium: A Puzzle” due to the skeptical position of mainstream financial economists. In the last two decades several papers try to explain this anomaly with non-based and based risk explanation, but no individual resolution provides fully satisfactory answers to this puzzle, as presented in Mehra (2003) and Mehra and Prescott (2008a, 2008b).
In the mid-1980s De Bondt and Thaler (1985, 1987) showed indubitable evidence of the overreaction in the stock market. The empirical evidence collected unequivocally showed that abnormal returns can be achieved with strategies that buy past “losers” (i.e. stock with poor returns) and sell past “winners” (i.e. stock with higher returns) over a 3- to 5-year period. Fama (1991: 1581) denominated this fact as “(…) an aggressive empirical attack on market efficiency (…)” and the “battle” is not over yet.
Another well-known stylized fact in stock markets is the “noise trading” presented by Black (1986). Also known in some literature as “irrational trading”, since investors trade based on noise, this seminal work leads to the evidence that noise traders obtain higher expected returns than informed traders and that noise trading could persist in the stock market. In the beginning of the 1990s, is consensual that daily and weekly future returns can be predicted on the basis of past return, thereby the market is inefficient, in this sense6.
6 Fama (1991: 1580) states that the work related to noise trading “(…) rejects the old market efficiency-constant expected returns model on a statistical basis”.
9
Moreover, LeRoy (1989: 1616) points out that various researchers on cognitive psychology “(…) have documented systematic biases in the way people use information and make decision.” The author also claims that several of “(…) these biases are easy to connect, at least informally, with securities market behavior”.
Research by Jegadeesh and Titman (1993, 2001) shows extremely robust evidence about another market anomaly: momentum profits. According to the authors momentum investment strategies that buy (sell) “winners” (“losers”) over the previous three to twelve months are profitable. Furthermore, they find robust evidence that these strategies persist over time, using out-of-sample tests7. In other words, the results supported the predictability of future returns in stock markets based on past performance.
The existence of bubbles related to asset prices (i.e. unexplained asset price movements according to their fundamental value) is another argument against market efficiency8. Furthermore, the P/E anomaly (i.e. price-earnings ratio anomaly), where, on average, years with low P/E had systematically higher returns than years with high P/E, and the January effect (also known as turn-of-the-year effect), where the average monthly returns of New York Stock Exchange stocks are greater in January, are two anomalies among other findings that are inconsistent with the economics and financial paradigms (e.g. Thaler (1987) and Shiller (2000)).
7 The criticism of data-mining suggested by some literature (see, for example, Fama (1998)) is therefore rejected. These results also suggest that this anomaly did not disappear with its disclosure, contrasting with the standard argument presented by market efficient literature that disclosure of an anomaly leads to a correction of the market and therefore trading strategies based on anomalies are not profitable.
8 See Shiller (2000) and LeRoy (2004) for detailed discussion about irrational and rational bubbles.
10
In general, one can state that Behavioral Finance field is conquering more and more space in financial literature. Thaler (1999) suggested that in recent years the field of Behavioral Finance became less controversial with the acknowledgement of the influence of human behavior in stock prices. More recently, this field is gaining ground in economic and financial models and becoming an acceptable paradigm in financial literature. In a recent paper about Behavioral Finance, Kim and Nofsinger (2008: 1) state that “The academic finance community has only recently accepted it as a feasible paradigm to explain how financial market participants make decisions and, in turn, how these decisions affect financial markets”.
Although it is not our intent to document all anomalies present in the last decades in financial literature, the empirical evidence briefly reviewed in this section allows us to comprehend the growing interest on this field. In line with this trend, there are nowadays several papers and textbooks that provide excellent literature review about this issue (see, for example, De Bondt and Thaler (1995), Shiller (2000), Shleifer (2000), and Barberis and Thaler (2003)).
2.3 EMH and Behavioral Finance - Where do we stand?
Comparing these two paradigms, it can be stated in general terms that Behavioral Finance advocates that market shows historical evidence of anomalies and Traditional Finance, or market efficient literature, despite recognizing these phenomena, rejects the validity of these findings supported by methodological argumentation, i.e. criticizes the fragility of the empirical results when subjected to alternative methodologies.
11
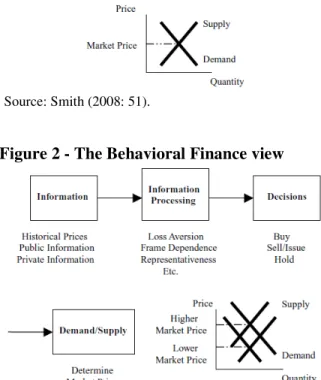
Using the diagrams suggested by Smith (2008) we can differentiate EMH and Behavioral Finance as follows:
Figure 1 - The EMH view
Source: Smith (2008: 51).
Figure 2 - The Behavioral Finance view
Source: Smith (2008: 52).
So the major difference in the two diagrams is the information processing box that reflects factors which can affect decisions and thereby price can fully reflect available information as well as the heuristic-driven bias.
Nowadays the EMH is broadly accepted due to the inability to reject the semi-strong form of market efficiency in the majority of the studies developed. This
12
fact led to the assumption of market efficiency as a stylized fact. According to Summers (1986), despite this fact some papers presented evidence that asset prices are not related to economic realities, in a rational way. Nevertheless these findings are discarded since they ultimately imply exploration of profit opportunities.
In a paper discussing Behavioral Finance, Thaler (1999) advocates that although behavior of the stock market often deviates from an efficient market, the exploration of these anomalies does not allow to obtain abnormal returns. This could appear contradictory, but it is not. In a clarifying example Thaler (1999: 14) states: “A drunk walking through a field can create a random walk, despite the fact that no one would call his choice of direction rational. Still, if asset prices depended on the path the drunk adopted, it would be a good idea to study how drunks navigate”. So one important point is that anomalies are not necessarily equal to profit opportunities, and thereby the same is applicable for evidence of market inefficiency.
Fama (1991: 1575) suggested that “(…) the market efficiency per se is not testable” and therefore it is imperative to have a model of equilibrium. The author also stated that the joint-hypothesis problem does not allow exact inference about the form of market efficiency. Furthermore, in the review of market efficiency and behavioral finance empirical research Fama (1998), as presented before, criticizes the anomalies literature arguing that these evidences are spurious results and that these empirical evidences are fragile. In terms of event studies he criticized that post-event systematic abnormal returns are about as frequent as post-event reversal.
Notwithstanding, recent papers (e.g. Khotari (2001)) made a clear point that the market efficiency could (and should) be tested, although the appropriation of the hypotheses and the tests applied are crucial conditions for a consistent research. In addition, it is also important to notice the existence of a
13
differentiation within the “inefficient literature”. Some authors argue its existence, but suggest that it is not possible to obtain advantage by the creation of trading rules (e.g. Black (1986)). In the order hand, there are researchers that besides stating the existence of inefficiency, also advocate the possibility of significant profit opportunities (e.g. Jegadeesh and Titman (1993, 2001)).
In conclusion, there are two types of literature, one mainstream scientific literature that advocates information efficiency in securities markets (e.g. Fama (1991, 1998)) and, in the other hand, a non mainstream literature (at least nowadays) that supports the existence of anomalies and sometimes also the inefficiency (e.g. LeRoy (2004)) or the information inefficiency (e.g. Kothari (2001)) of securities markets. Of course, there are several approaches to testing market efficiency, but one of the most accepted is event study methodology. We will discuss this issue in the next section.
14
3 Event Studies
3.1 Event Studies – Publications over the last decade
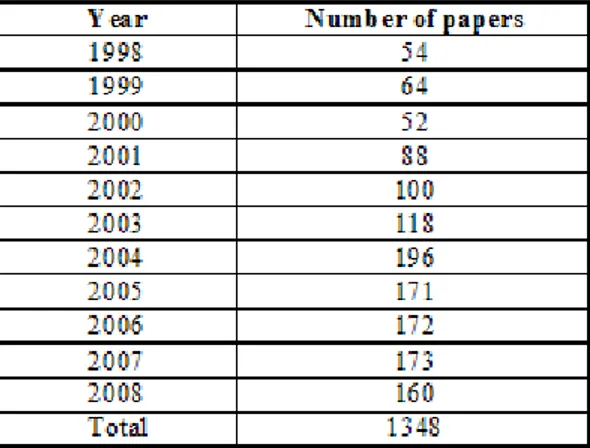
Over the last decade academics produced several papers (i.e. journal articles and working papers) on market efficiency and event studies. With the purpose of obtaining a picture about the number of papers on this specific topic we analyze the number of papers available in Research Paper in Economics (RePEc) database9 between 1998 and 2008. We chose the JEL (Journal of Economic Literature) code G14 – “Information and Market Efficiency; Event Studies” and correct the available information from replication and undated problems in the papers. Table 1 summarizes these numbers.
Table 1 - Papers about "Information and Market Efficiency; Event Studies" (1998-2008)
Source: Author’s analysis based on RePEc. (http://ideas.repec.org/j/G14.html). Data extract on 01-02-2009.
9 According to our research this database is the best proxy available to analyze the number of papers on a specific area of research. RePEc has papers from 65 countries, including United States and the majority of European countries, according to the last available update, 6th February 2009. Furthermore major participants in RePEc are top publishers and institutions: Elsevier, Wiley Blackwell, Springer, Federal Reserve System, National Bureau of Economic Research, American Economic Association and many others.
15
The number of papers about this issue has risen significantly in the last decade, according to RePEc data. The year of 2004 was the year with more papers in this decade, almost 200. The total number of papers reporting market efficiency and event studies is 1348. This number provides an important proxy for the size of the literature in the last decade. According to the table below it is possible to see that this topic is one of the most used within the General Financial Markets in 2008.
Table 2 - Number of papers about General Financial Markets (G1) in 2008 - disaggregation by secondary level of classification
Source: Author’s analysis based on RePEc’s website. Data extract on 01-02-2009. n/a – not available.
3.2 Event Studies - Introduction
Event studies are the most disseminated way of analyzing EMH in financial literature. Brown and Warner (1980: 205) define event studies as “(…) a direct test of market efficiency”. If there is evidence of systematic “(…) nonzero abnormal security returns (…)” in a specific event the EMH is inconsistent as well as the “(…) hypothesis that security prices adjust quickly to fully reflect new information.” More recently, Fama (1991: 1577) classify event studies as “semi-strong-form tests of the adjustment of prices to public announcements”. So event studies allow at least the testing of the semi-strong form of market efficiency.
In a review of the research about event studies Binder (1998) mentioned that event studies had mainly two applications: (1) analyze if the market incorporates
16
the information in the announcements in an efficient way and (2) measure the impact of an event on the returns and ultimately in the wealth of the shareholders.
The event studies attracted considerable interest in the literature namely due to the fact that they allow simple test to informational market efficiency. This trend is reflected on the event study surveys that were developed during the 1990s (e.g. Thompson (1995), MacKinlay (1997), and Binder (1998)). More recently, the survey of Kothari and Warner (2006) present a review of econometric issues related to event study methodology, with special focus to the limitations of long-horizon events studies, and it is an example of the persistent interest of this research field in financial literature.
3.3 Event Studies – Portuguese background
According to the review made about event studies in the Portuguese market the current available evidence advocates that the market is efficient in the semi-strong form. The three previous studies we present here had periods of less than five years, with Isidro (1998) studying the largest period in this review: 4 years and a half, starting nearly in the moment of the creation of the PSI 20 Index.
The findings of Isidro (1998) are completely unexpected since besides the existence of statistically significant abnormal returns on event day (day “0”), the main results also suggested consistent abnormal returns on days -18, -17 and -16 of the event period and also on days -15, -14 and -13. In accordance to the author this anomaly could be explained by a group of practitioners that know the earnings before information has been made public, and as a reaction to this fact a second group probably based on the observation of the first group generated the abnormal returns presented before. In addition, this study also presented empirical evidence of abnormal returns on the post-event period (i.e. the days after the event), which may reflect adjustments of the investor’ portfolios, according to the
17
author’ explanation. The empirical results obtained from this study are in favor of the semi-strong form of market efficiency in the author’s view, since the abnormal return on day “0” and an increase of the abnormal returns’ variance shows that the information in the earnings’ announcement is not fully known on the event day. Nevertheless, Isidro (1998) also advocates that these results suggest an anticipation effect of earnings.
The second study examined was Wilton (2000) and the main empirical evidence suggested is that trading volume does not show a significant reaction to earnings announcements, although stock prices change significantly for approximately 29% of the observations. In addition, other key fact is the underestimation of the importance of earnings’ announcements by the listed firms. Finally, Duque and Pinto (2004) documented statistically significant abnormal returns for the event day (day “0”) for both good and bad news and therefore state that the market is efficient in the semi-strong form. The authors also mentioned that this announcement should occur when the market is closed, so we should expect theoretically that significant abnormal returns happen on day “1”. They attributed this fact to two main reasons: (1) the announcement could occur during the session if there is a necessity of quick information transmission and (2) the announcements could be a correction of information already disseminated in the market. Thus, their findings suggest the existence of information asymmetry leading them to propose the possibility of market inefficiency in the semi-strong form. Furthermore, the results also show statistical significant cumulative abnormal returns for good and bad news in the days after the event and abnormal trading volumes until the third day after the event day.
The mainly characteristics of the most recent event studies in Portuguese market presented above are summarized in table 3.
18 Table 3 - Some background on event studies in Portuguese stock market
Study Event(s) Time line of event window Estimation window Variables analyzed Number of stocks Period of analysis Model (Stock return model) Main Results (EMH) Isidro
(1998) Annual earnings announcements 51 days (-20, +30), All trading days excluding event windows
- Abnormal
returns 51 stocks January 1993 to June 1997 One factor market model Semi-strong form of EMH
Wilton
(2002) Annual and quarterly earnings announcements
10 days
(-5;+4) 10 days (5 days before and 5 days after the event window) - Returns - Volume - Number of trades 30 stocks (20 stocks from PSI20 and other 10 stocks) December 2001 and the first three quarters of 2002 Hypothesis
testing No direct mention to EMH Duque and Pinto (2004) “Price Sensitive Events” and “Others Events / Communications”10 11 days
(-5;+5) All trading days excluding event windows - Abnormal returns - Volume 37 stocks January 2000 to December 2002 One factor
market model Semi-strong form of EMH
Sources: Isidro (1998); Wilton (2002) and Duque and Pinto (2004).
10 This classification is derived from CMVM – Comissão de Mercado de Valores Mobiliários (Portuguese Securities Market Commission). CMVM (2000), Santos
19
4 Data and methodology procedures
4.1 Data
The sample consists of all available data relative to earnings analysts’ forecasts reported on Institutional Brokers Estimate System (I/B/E/S) for Portugal, namely the Earnings Per Share (EPS) series, and the price and volumes series are collected from Bloomberg. The initial sample period of firms’ yearly earnings announcements goes from 1990 to 2008, which represents all available data about earnings announcements in the Portuguese market on an annual basis11.
According to I/B/E/S (1998) the data obtained in the detail file appears on a split adjusted basis. It is also important to notice that we decided to use I/B/E/S Ticker as company identifier because it is unique instead of the others identifiers (such as CUSIPs and company name) that could change over time.
Analysts’ forecasts are in two different currencies because before 01/01/99 the forecasts are in Escudos and thereafter in Euros, we convert all the series to Euros at the promulgated fixed exchange rate12. However, we detect that the currency code for data from 1998 fiscal year had a misspecification, since forecasts for this fiscal year that are expressed before 1999 had a currency code in Euros, when in reality the forecasts were expressed in Escudos. We proceed to the correction of this currency code bias in the median and mean forecasts series13.
11 Even if the majority of the studies about earnings announcements uses quarterly data from I/B/E/S, the scarcity of earnings observations on a quarterly basis for the Portuguese market lead us to analyze the annual data.
12 The irrevocable conversion exchange rate between the Euro and the Portuguese escudo is 200.482 PTE = 1 EUR. This exchange rate was obtained from the EURO Exchange Rate File from the I/B/E/S data set.
13
The reference to the currency code bias in this work means a misspecification where the forecasts made on 1998 related to1998 fiscal year are incorrectly classified as Euros, when in reality the database
20
Since the major intent of this study is to investigate informational market efficiency based on event study methodology we will follow the conventional methodology adopted in the empirical literature about market efficiency, which we present in the next subsection.
4.2 Measurement of abnormal returns
We adopted an announcements categorization in line with the concepts suggested by Christie, Corwin and Harris (2002), also applied in previous Portuguese event studies (Duque and Pinto (2004)), and distinguished three types of “news” (i.e. announcements) as follows:
- Bad news: the price change (i.e. return) of a specific security i is negative in the event day.
- Good news: the price change (i.e. return) of a specific security i is positive in the event day.
- No news: the price does not change and therefore the returns are zero.
We selected daily data as suggested by generally accepted event studies literature (e.g. Brown and Warner (1985), Fama (1991), Thompson (1995), MacKinlay (1997), and Khotari and Warner (2006)).
In the 1980s, event studies literature (e.g. Brown and Warner (1980, 1985)) recommended the use of market model, or even less complex methodologies, like market adjusted returns model, over more sophisticated methods (such as control portfolio method). In the following decade, other empirical studies (e.g. Lee and Varela (1997)) advocated that the market model is superior in specification and power to other types of model applied in event studies. Thus, we selected market model as the primary
gives forecasts in Escudos and actual values in Euros. Detailed evidence about this bias is provided in section 7.
21
model for this study. Our analysis excluded the use of multifactor models, because of their limitations in testing EMH14. Moreover, we selected the ordinary least squares (OLS) estimation of the market model as parametric procedure 15.
The market model for a stock i is defined as:
it
R = α + i βi Rmt+ ε (1) it Where,
it
R - Actual return of i-th stock for period t.
mt
R - Actual return of market portfolio for period t (i.e. market return for period t).
i
α - Intercept term.
i
β - Regression coefficient for the market return variable.
it
ε - Error term, with E(εit) = 0.
Our choice in the calculation of market model were the PSI Geral, a market capitalization weighted price index, for Rmt, since it represents all stocks listed on
Portuguese market.
In general terms, the stock i’s abnormal return on day t (ARit) is the difference
between the stock i’s actual return on day t (Rit) and the stock i’s expected or normal return on day t (E(Rit)), as follows:
it
AR = Rit- E(Rit) (2)
14 MacKinlay (1997) mentioned that multifactor models have limited gains over other procedures. More recently, Loughran and Ritter (2000), for example, argue that this type of model test patterns in returns and has no power to test EMH.
15 The use of OLS has been widely discussed. There are some researchers that advocated alternatives methods (e.g. Collins and Dent (1984), Chandra and Balachandran (1992), and Dombrow, Rodriguez and Sirmans (2000) (hereafter DRS)). DRS (2000), for example, suggest Theil’s approach, an interesting alternative to OLS, although it implies the exclusion of outliers, which could be relevant. In the other hand, some literature shown empirical results that support the use of OLS or at least that more complex methods have little gains (e.g. Malatesta (1986), McDonald (1987), and Lee and Varela (1997)). In the absence of a consensus we will follow the conventional event study methodology (i.e. OLS).
22
More specifically, with the application of the market model:
it AR = Rit- ( i ∧ α +β∧i Rmt) (3) Where, i ∧
α andβ - Estimated regressions coefficients of the market model. ∧i
In addition, it is important to notice that ARit is equal to the error term or
regression residual (ε ) which captures the unexplained deviation of the stock it i’s return from the market on day t.
Under the null hypothesis, that the abnormal return is equal to zero, the distribution of the sample abnormal returns of a specific observation is:
it
AR ~N(0,σ2(ARit)) (4) With the conditional variance equal to:
− + + + = )) ( ( ) ( 1 1 ) ( 2 2 2 m m mt it R Var L R R L AR i ε σ σ (5) Where, 2 i ε
σ - Variance of the i-th stock regression residuals.
m
R - Mean market return over the estimation window. L- Length of the estimation window.
) (Rm
Var - Variance of the market return over estimation window.
The common procedure adopted after the calculations of abnormal returns are aggregation of this data though a period of time for all stocks with the aim of infer about the event in analysis (e.g. Ball and Brown (1968), FFJR (1969), MacKinlay (1997)).
23
Abnormal returns (AR) are aggregated using the arithmetic mean of the abnormal returns (or average abnormal returns (AARt)), with N equal to the total number of AR
on day t:
∑
= = N i it t AR N AAR 1 1 (6) With the asymptotically variance of the AARt equal to:∑
= = N i t t N AAR Var 1 2 2 1 ) ( σ (7) εIn this case the event study methodology is designed to test the following hypotheses:
0
H - Mean or average abnormal returns (AARt) of all events at period t is equal to
zero. 1
H - Mean or average abnormal returns (AARt) of all events at period t is not equal
to zero.
After that the cumulative abnormal returns are computed. Considering the null hypothesis the distribution of the i-thstock cumulative abnormal returns between period
1
t and t2(CARi(t1,t2)) is given by:
) , (t1 t2
CARi ~N(0,σi2(t1,t2)) (8) With the asymptotically variance of CARi(t1,t2) equal to:
2 1 2 2 1 2( , )) ( 1) i t t t t i σε σ = − + (9)
24
Cumulative average abnormal returns (CAAR) are the aggregation of the sampleAARt. So for estimation windows starting at t1and ending at t2the arithmetic mean will be as follows:
∑
= = 2 1 ) , (1 2 t t t t AAR t t CAAR (10)With the asymptotically variance of the CAAR(t1,t2) equal to:
∑
= = 2 1 ) ( )) , ( ( 1 2 t t t t AAR Var t t CAAR Var (11)The hypotheses underlying the test are:
0
H - Average daily cumulative abnormal return (CAAR(t1,t2)) between period t1 and period t2 is equal to zero.
1
H - Average daily cumulative abnormal return (CAAR(t1,t2)) between period t1 and period t2 is not equal to zero.
In order to test the hypotheses related to AAR and CAAR assuming large samples, the following statistics should be applied, in accordance with previous event study literature (e.g. MacKinlay (1997)):
1 Θ = ~ (0,1) )) (var(AAR 1/2 N AAR t t (12) 2 Θ = ~ (0,1) ))) , ( (var( ) , ( 2 / 1 2 1 2 1 N t t CAAR t t CAAR (13)
Alternatively, the literature also suggests the application of conventional t-test to study AAR and CAAR, with the estimate variable divided by the square root of variance of this variable, which is divided by the number of observations (N). In this case, we have a student t-distribution with N-1 degrees of freedom, as suggested by Collins and Dent (1984) and Lee and Varela (1997).
25
Since event study evidences are sometimes criticized for the inconsistent of results though alternative methodologies (e.g. Fama (1998)), we cross-check our results using mean adjusted model and market adjusted model. According to the definitions presented in Brown and Warner (1985) the mean adjusted model and the market adjusted model are showed in equation 14 and 15, respectively:
it
AR = Rit- Ri (14)
Where,
i
R - Arithmetic mean of the i-th stock’s daily return over the estimation window.
it
AR = Rit- Rmt (15) Where,
mt
R - Market return for period t (i.e. for day t), as presented above.
4.3 Time line of the event study
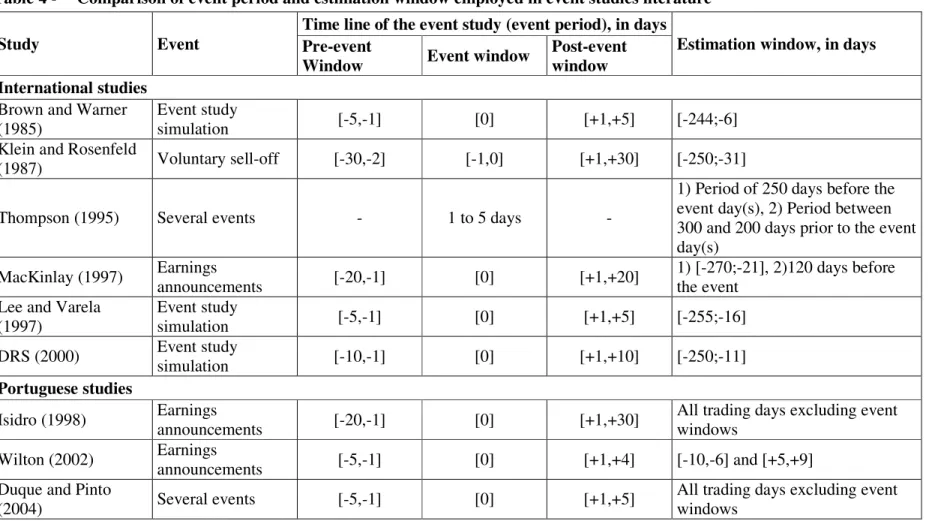
A convention in event study methodology is that the event time is kept relative to the announcement (i.e. event day). Nevertheless, this seems the unique convention, since the literature is not consensual when defining event period (i.e. pre-event window, event window and post-event window) and also estimation window, in accordance with table 4. Our choice was 230 days for the estimation window (-250 through -21) and an event period of 41 days (days -20 through +20). The choice of this event period, in line with MacKinlay (1997) and Isidro (1998), is mainly due to the fact that Isidro (1998) found abnormal returns in the first days of the event period. Thus, the application of a shorter event period could be excluding some important evidence for Portuguese market.
26
Table 4 - Comparison of event period and estimation window employed in event studies literature
Study Event
Time line of the event study (event period), in days
Estimation window, in days Pre-event
Window Event window
Post-event window International studies
Brown and Warner
(1985) Event study simulation [-5,-1] [0] [+1,+5] [-244;-6] Klein and Rosenfeld
(1987) Voluntary sell-off [-30,-2] [-1,0] [+1,+30] [-250;-31] Thompson (1995) Several events - 1 to 5 days -
1) Period of 250 days before the event day(s), 2) Period between 300 and 200 days prior to the event day(s)
MacKinlay (1997) Earnings announcements [-20,-1] [0] [+1,+20] 1) [-270;-21], 2)120 days before the event Lee and Varela
(1997) Event study simulation [-5,-1] [0] [+1,+5] [-255;-16] DRS (2000) Event study simulation [-10,-1] [0] [+1,+10] [-250;-11]
Portuguese studies
Isidro (1998) Earnings announcements [-20,-1] [0] [+1,+30] All trading days excluding event windows Wilton (2002) Earnings announcements [-5,-1] [0] [+1,+4] [-10,-6] and [+5,+9]
Duque and Pinto
(2004) Several events [-5,-1] [0] [+1,+5]
All trading days excluding event windows
27
4.4 Thin trading
The thin trading problem is generally discarded in the event study methodology. As point out by Bartholdy, Olson and Peare (2007: 228) (hereafter BOP) “nontrading, and the subsequent problem of missing return observations, is not encountered in most event studies”. Although there is literature that suggested that the adjustment for thin trading is practically irrelevant (see, for example, the comments about thin trading of MacKinlay (1997) for further detail), a significant body of literature in finance argues the opposite (e.g. Cowan and Sergeant (1996), and BOP (2007)).
In the first paper to analyze the effects of thin trading on event study test statistics using daily volume data Cowan and Sergeant (1996) argue that thin trading may originate poorly specification of the statistical tests. The authors point out that higher presence of zero returns in thinly traded stocks increase the probability of non-normal returns distributions in these stocks. At the conclusion, they report that there is not a clear superior test to analyze the thin trading and the correct application of a test will depend on the conditions of the study and the return distribution.
More recently BOP (2007: 244) analyze the data from the Copenhagen Stock Exchange and some of their main findings are: that in presence of thin trading trade to trade returns are recommended, that there is a restriction on detecting robust abnormal returns if the sample does not include stocks with thickly trading (i.e. stocks with high levels of liquidity) and that with the combination of four factors, namely “(…) non-normality, event induced variance, unknown event day, and problems of very thin trading(…)” there is not a superior test statistic.
In the current literature about event studies in the Portuguese market there is scarce reference to this issue16 and to correction methodology that deals with potentials misspecifications of market model. With this purpose we analyzed the available volume
16
28
time series of the 57 constituents of PSI Geral Index. Since PSI Geral Index is a market index of all eligible companies listed on Euronext Lisbon (i.e. Portuguese stock market) the use of the 57 constituents allows us to analyze the universe of listed companies and not only a sample.
BOP’s research suggested four different techniques for dealing with this issue: a) Simple returns for consecutive prices: This adjustment is applied by the calculation of the stock’s simple returns only for days with successive prices. The second step is to remove the market return for these days and finally compute daily abnormal return.
b) Lumped returns: Since stock exchanges, in general, list the close price of the previous trading session if the stock did not trade, the calculation of daily returns for these non-trading days will be zero returns.
c) Uniform Method (or Uniform returns): This method is based on two steps, first the calculation of aggregated return and the average daily return for each interval between trading days and second the allocation of the average daily return to each day over their specific interval.
d) Trade to trade returns: The first step is to calculate an individual stock’s return between the days when transactions actually take place. Then, trade to trade returns for the market index are calculated over the same period as for the stock. These two sets of trade-to-trade returns are used to estimate the market model to obtain abnormal returns for the stock over this period.
This last technique is the best adjustment for thin trading, in accordance to their results. The authors state that although the information about non-trading days is omitted, this disadvantage is more than compensated by the unbiased characteristics of this method. So, in short, simple returns for consecutive prices is not recommended to deal with thin trading; uniform returns and lumped returns have similar performance, although the uniform method as the disadvantage of giving no emphasis on the days in
29
each interval; and, finally, trade to trade returns appears to be the method with best performance among the others.
According to the definitions suggested by BOP (2007: 230) there are three kinds of trading frequency, in a yearly basis: thick, medium and thin trading. Thick traded stocks are defined as stocks trading “(…) on more than 80% of trading days, or an average of more than four days per week.” Medium trading occurs when a stock is traded “on 40% to 80% of all trading days, or about two to four days per week.” Thin trading takes place when a stock trade on less than 40% of all trading sessions or, in alternative, less than two trading sessions per week. Following BOP (2007), we will analyze this issue using alternative databases in the next subsection.
4.4.1 Databases analysis
The Portuguese market has several limitations when it comes to obtain data about stock market especially volume data for the first years after its creation. Thus, since there are several databases we will briefly examine their advantages and disadvantages. We chose to use the most known and broadly available databases in Portugal: Datastream and Bloomberg17. Our selection criteria are selection of the 57 listed companies in the Portuguese stock exchange (Euronext Lisbon) and starting at the first trading day available for each firm.
4.4.1.1 Datastream
Datastream defines volume as the number of shares traded for a particular stock on a specific day and is expressed in thousands of shares. This data is on a daily basis and is adjusted for capital changes. Datastream also states that the default volumes represented the volumes from the primary stock exchange of the country, which can be different from the “home” stock exchange, except for volumes of US stocks where the
17 One also briefly examine Reuters 3000 Xtra Hosted Terminal Platform, but since the volume data has the same characteristics of Bloomberg and has the disadvantage of having fewer historical data, further analysis does not provide significant gains. In this analysis it seems importance to notice that all three databases have some differences in volume and price series, especially in data from the 1990s.
30
data is consolidated across all stock exchanges. Since Portugal nowadays has just one stock exchange (Euronext Lisbon), the volumes are the total volumes for the Portuguese stocks on PSI Geral Index. Nevertheless, it is important to notice that due to the fact that some Spanish listed firms are listed in Euronext Lisbon, the volumes for these firms are from their primary stock exchange (Bolsa de Madrid), in this case. Thus we exclude these stocks from the Datastream’ analysis and therefore the databases are not comparable.
This data set ranging from 5th January 1988 to 31st December 2008 is based on the Portuguese stock exchange trading sessions for the 53 listed companies available18 on this database. Table 5 shows the division of these listed companies19 by trading activity through time. According to the data the thin trading problem, also known as liquidity problem, seems to be overstated for Portuguese stock market, at least taking into account the Portuguese listed companies at the time of this study. The liquidity is “(…) the matching of buyers and sellers (…)” that is “(…) intertemporal in nature and it is not necessarily linked to price discovery” (O’Hara (2003: 1338)). Although the concept of liquidity allows to define the liquidity problem as the thin trading problem, it seems that sometimes liquidity problem in Portugal is addressed to the fact that some stocks have low levels of trading, which is different from no trades.
Looking into the results obtained by this database the evidence suggests that only a small number of companies experience thin trading. The biggest number of stocks with thin trading occurred in 2003 and 2008 with five stocks showing yearly trading frequency below 40% of the total trading sessions in a year. The majority of the Portuguese stocks were actively traded with the yearly average trading frequency over the last decade ranging between 97% and 99%.
18 Portuguese stock market has 57 listed companies from which 4 are Spanish listed companies that are also listed in Euronext Lisbon.
19
Table 5 does not contain 53 listed firms in 2008, as expected, since one of these firms does not have volume data for 2008.
31
Table 5 - Trading frequency of the actual Portuguese listed companies using Datastream’s volume data
Number of stocks Average trading
frequency Number of stocks
Average trading
frequency Number of stocks
Average trading frequency 1988 1 100.0% 1 77.0% 1 36.4% 3 1989 3 93.5% 1 66.4% 0 - 4 1990 4 100.0% 0 - 0 - 4 1991 1 96.3% 4 67.1% 0 - 5 1992 3 93.4% 2 69.1% 1 32.9% 6 1993 13 91.3% 6 69.7% 2 20.4% 21 1994 14 92.0% 6 68.2% 3 19.3% 23 1995 16 93.6% 7 57.7% 4 24.4% 27 1996 18 93.3% 5 62.8% 4 23.3% 27 1997 23 97.5% 4 60.1% 2 15.9% 29 1998 30 97.9% 6 67.6% 0 - 36 1999 32 97.1% 6 60.1% 1 23.2% 39 2000 37 98.0% 4 68.3% 1 14.6% 42 2001 35 98.9% 6 55.4% 1 10.1% 42 2002 32 99.0% 7 65.4% 3 27.1% 42 2003 34 97.4% 4 60.6% 5 26.6% 43 2004 33 98.2% 7 64.9% 4 27.8% 44 2005 37 97.3% 4 63.9% 4 26.1% 45 2006 39 97.5% 5 54.0% 2 18.4% 46 2007 40 98.5% 7 65.0% 3 13.0% 50 2008 40 98.8% 7 61.2% 5 20.9% 52
Thick trading Medium trading Thin trading
Total number of stocks Year
32
4.4.1.1 Bloomberg
Bloomberg describes volume as the number of shares traded on a security at a specific day and is expressed in units. In accordance to Bloomberg’s definition if the stock exchange sends the last trade price without a volume, the value will be zero.
The volume data for the constituents of PSI Geral Index starts on 3rd February 1993, exclusively with thirteen stocks20: BCP, Cires, Corticeira Amorim, Estoril Sol, Grupo Soares da Costa, Inapa, Jerónimo Martins, Mota Engil, Papelaria Fernandes, Reditus, SOC Comercial Orey Antunes, Sonae and Toyota Caetano Portugal.
This data set ranging from 3rd February 1993 to 31st December 2008 is based on the 57 Portuguese stocks available on Bloomberg’s database, considering the dates from the PSI Geral price series as proxy to the trading sessions. So one important difference is that this database allows obtaining the trading volumes for the Spanish listed companies in the Portuguese stock exchange, mentioned before.
The figures shown in table 6, although not comparable, support the findings obtained from Datastream’s volume data. The results suggest that only a small number of companies presented thin trading. The year of 2008 was the year with the largest number of thinly traded stocks, seven stocks.
This also supports the conclusion that the majority of the Portuguese stocks were actively traded and that over last decade the yearly average trading frequency of the thickly traded stocks range approximately between 97% and 99%.
20
33
Table 6 - Trading frequency of the actual Portuguese listed companies using Bloomberg’s volume data
Number of stocks Average trading
frequency Number of stocks
Average trading
frequency Number of stocks
Average trading frequency 1993 0 - 17 60.5% 1 31.5% 18 1994 9 89.1% 9 67.8% 3 15.7% 21 1995 14 94.2% 7 57.4% 4 23.9% 25 1996 17 92.4% 4 61.9% 4 22.6% 25 1997 22 98.1% 4 60.0% 2 15.9% 28 1998 27 97.9% 6 67.2% 0 - 33 1999 30 98.0% 6 62.0% 0 - 36 2000 38 98.1% 3 64.5% 0 - 41 2001 36 98.5% 7 57.6% 0 - 43 2002 32 99.1% 9 65.3% 2 36.4% 43 2003 35 97.6% 4 60.0% 4 32.0% 43 2004 33 98.3% 9 62.8% 3 36.0% 45 2005 38 97.4% 5 62.9% 4 31.3% 47 2006 42 97.6% 5 54.0% 3 26.2% 50 2007 44 98.5% 7 65.0% 3 27.6% 54 2008 43 98.7% 7 61.2% 7 25.2% 57 Thick trading Year
Medium trading Thin trading
Total number of stocks