Study on the Stock Market Evolution of Companies Listed
on Bucharest Stock Exchange
Iulia-
Oana Ş
tefan (Belcic-
Ş
tefan)
11University of Craiova
Abstract. The present study pursues highlighting the perspective of the Romanian stock market on the value of listed companies during a period fully marked by the presence of the global financial crisis. To this purpose I have analyzed 36 companies listed on Bucharest Stock Exchange for a reference period of 5 years, i.e. 2009-2013. The study aimed to determine the level of the most relevant stock exchange indicators, respectively, the Price to Earnings Ratio, Price to Book Value and Dividend Yield and their evolutionary analysis, including by comparison with the average levels of the activity sectors that the companies which form the structure of the sample belong to.
Keywords: Price to Earnings Ratio, Price to Book Value, Dividend Yield, Romanian stock market, sectors of activity, average value
JEL Classification: G10, G35, G01
1. Introduction
Although a company may record unfavorable levels of the economic and financial performance indicators, not infrequently the market seems to "ignore" this aspect and assign the company a higher value than the actual one, the reverse situation being, in turn, possible. In fact, one of the major advantages posed by the status of a stock exchange listed company consists of the constant existence of an actual price for its shares, price which, however, is not always consistent with the economic and financial situation of the company. For these reasons it is essential to study the stock exchange results of listed companies, as a way of reflecting their performance through the capital market.
Determining the economic and financial performance of companies listed on the exchange in order to finalize the future structure of the portfolio is a particularly laborious activity, involving the gathering and processing of a considerable amount of information, as well as experience and intuition in their interpretation. To select the appropriate shares to be acquired, investors use two methods of analysis: fundamental analysis and technical analysis, plus information from the market likely to influence in the future the stock quote of the shares in question.
Referring to the two types of analysis, Spulbăr (2010, p.75-76) believes that fundamental analysis is "a method of investment that seeks to forecast the future dynamics of the price of a financial instrument based on the determination and evaluation of the economic factors affecting the financial instrument concerned ", while technical analysis can be defined as "studying the market through charts to determine the future price direction." In other words, fundamental analysis makes use of the information provided by the company’s financial statements, on account of which are determined a number of performance indicators, while technical analysis is, in fact, a statistical method for assessing changes in share price based on their previous developments, represented by graphs on prices and volumes of traded securities.
depending on the time horizon considered by the investor. Thus, if it is desired to carry out a long-term investment the two types of analysis should be used cumulatively as through the fundamental analysis the investor can determine whether the company can create value in the future, so whether or not it is indicated to buy its shares, while using technical analysis the investor determines which is the opportune moment to enter the market for the respective securities.
In the case of listed companies, fundamental analysis, based on the usual indicators of financial performance, may be completed using specific indicators that meet the interests of both shareholders and investors in the financial market. The most important of these indicators include:
Price to Earnings Ratio (PER) is an indicator of how profits are evaluated on the market by comparing the market price of a share (PPA) with earnings per share (EPS).
� � =����
To carry out relevant assessments regarding the evaluation of the state of companies, there can be used the average PER indicators of the sectors of activity to which they belong. Thus, an optimal level of the average PER for the industries of developed economies is situated, according to some authors at the value of 7 (Halpern, Weston and Brigham, 1998 p.118), according to others the value is considerably higher, of 12.5 (Brigham, Gapenski and Ehrhardt, 1999, p.87), so that, more recently, the value to be located at 13.8 (Brealey, Myers and Allen, 2006, p.790).
Price to Book Value (PBV) is determined as the ratio of the market price of the share (PPA) and its accounting value (VCA):
� � =���
Within analyses there can be used a reference level of average PBV for developed industries, a level that is either more reduced, as the one mentioned by Halpern (1998), of 0.9, or higher, of 1.6 according to Brealey (2006) or even of 1.7 according to Brigham (1999).
Dividend Yield (DIVY) measures the gain obtained by shareholders from investing in the shares of a company and is determined as the ratio between dividend per share (DPS) and the market price of a share (PPA) or as the ratio of total dividends (DIV) and market capitalization (KB).
��� =����∗
��� = ��
� ∗
Manufacturing (Vrancart, Rompetrol Rafinare, Antibiotice, Biofarm, Zentiva, Artego S.A Tg Jiu, Romcarbon S.A Buzau, Teraplast, Stirom S.A Bucuresti, Alro, TMK-Artrom, Electromagnetica S.A Bucureşti, Electroargeş S.A Curtea de Argeş, Retrasib S.A Sibiu, Mecanica Ceahlău, Altur, Compa, Aerostar, Turbomecanica), Electricity, gas, steam and air conditioning supply (Amonil, C.N.T.E.E Transelectrica, S.N. Nuclearelectrica S.A), Constructions (Impact Developer & Contractor, Condmag), Wholesale and retail trade (Alumil Rom Industry, Ropharma S.A Braşov), Transportation (Conpet, S.N.T.G.N Transgaz), Storage (Oil Terminal, Socep), Professional, scientific and technical activities (Electrica), Hotels and restaurants (Turism Felix S.A Băile Felix).
For the 36 companies were extracted data from the annual financial statements but also from other published sources as well as from the records of Bucharest Stock Exchange, from where there were taken also the stock quotations of securities.
2. Interpretation of the indicators
The values of the three stock exchange indicators were determined for each analyzed company in the time frame 2009-2013, their individual level being detailed as follows.
In order to draw conclusions that are as relevant as possible, I considered opportune to also present the average value of each indicator by sectors of activity and at the level of the entire stock market for the years 2010-2013. Concerning the year 2009, for reasons of data availability, it could only be presented the value related to the entire stock market.
Table no. 1 The evolution of Price to Earning Ratio on activity sectors and for the entire
stock market
Activity Sector PER
2009 2010 2011 2012 2013
Mining and quarrying - 9,15 8,02 6,30 7,80
Manufacturing - 11,75 5,88 10,41 9,71
Electricity, gas, steam and air
conditioning supply - - 8,08 - 62,48
Constructions - 15,29 9,75 34,44 20,37
Wholesale and retail trade - 12,52 18,44 16,24 14,78
Transportation and storage - 8,91 7,10 8,42 7,43
Hotels and restaurants - 16,30 10,15 30,22 19,11
Total market 14,42 10,74 8,39 7,64 9,54
Source: author processing based on the monthly bulletins of Bucharest Stock Exchange available on-line at http://www.bvb.ro/TradingAndStatistics/Publications /MonthlyReports
transportation and storage recorded the most favorable evolution.
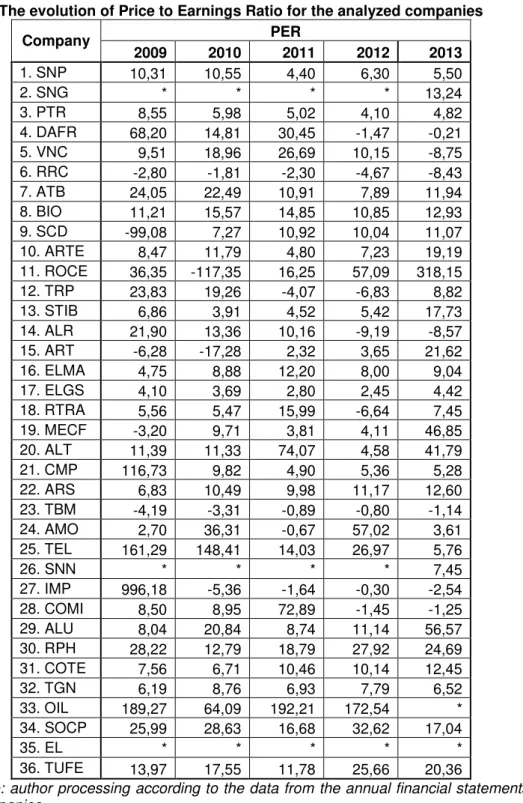
Table no. 2 The evolution of Price to Earnings Ratio for the analyzed companies
Company PER
2009 2010 2011 2012 2013
1. SNP 10,31 10,55 4,40 6,30 5,50
2. SNG * * * * 13,24
3. PTR 8,55 5,98 5,02 4,10 4,82
4. DAFR 68,20 14,81 30,45 -1,47 -0,21
5. VNC 9,51 18,96 26,69 10,15 -8,75
6. RRC -2,80 -1,81 -2,30 -4,67 -8,43
7. ATB 24,05 22,49 10,91 7,89 11,94
8. BIO 11,21 15,57 14,85 10,85 12,93
9. SCD -99,08 7,27 10,92 10,04 11,07
10. ARTE 8,47 11,79 4,80 7,23 19,19
11. ROCE 36,35 -117,35 16,25 57,09 318,15
12. TRP 23,83 19,26 -4,07 -6,83 8,82
13. STIB 6,86 3,91 4,52 5,42 17,73
14. ALR 21,90 13,36 10,16 -9,19 -8,57
15. ART -6,28 -17,28 2,32 3,65 21,62
16. ELMA 4,75 8,88 12,20 8,00 9,04
17. ELGS 4,10 3,69 2,80 2,45 4,42
18. RTRA 5,56 5,47 15,99 -6,64 7,45
19. MECF -3,20 9,71 3,81 4,11 46,85
20. ALT 11,39 11,33 74,07 4,58 41,79
21. CMP 116,73 9,82 4,90 5,36 5,28
22. ARS 6,83 10,49 9,98 11,17 12,60
23. TBM -4,19 -3,31 -0,89 -0,80 -1,14
24. AMO 2,70 36,31 -0,67 57,02 3,61
25. TEL 161,29 148,41 14,03 26,97 5,76
26. SNN * * * * 7,45
27. IMP 996,18 -5,36 -1,64 -0,30 -2,54
28. COMI 8,50 8,95 72,89 -1,45 -1,25
29. ALU 8,04 20,84 8,74 11,14 56,57
30. RPH 28,22 12,79 18,79 27,92 24,69
31. COTE 7,56 6,71 10,46 10,14 12,45
32. TGN 6,19 8,76 6,93 7,79 6,52
33. OIL 189,27 64,09 192,21 172,54 *
34. SOCP 25,99 28,63 16,68 32,62 17,04
35. EL * * * * *
36. TUFE 13,97 17,55 11,78 25,66 20,36
Regarding the price to earnings ratio recorded by each company, we can state that many of them have experienced significant fluctuations from year to year, due to market volatility. An example in this respect is the company Romcarbon, for which in 2013 investors have advanced 318 RON to get 1 RON of profit, compared to 36 RON, as they had advanced in 2009. At the same time, comparing data in tables 1 and 2 we find that the companies whose PER closely follows the average of the industry to which they belong are OMV Petrom for mining and quarrying, Artego and Aerostar for manufacturing, Transgaz for the transportation and storage sector and Tourism SA Baile Felix for the hotels and restaurants sector.
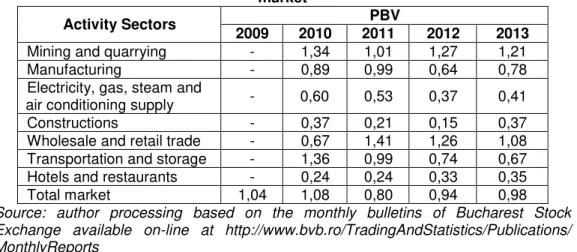
Table no. 3 The evolution of Price to Book Value on activity sectors and for the entire stock
market
Activity Sectors PBV
2009 2010 2011 2012 2013
Mining and quarrying - 1,34 1,01 1,27 1,21
Manufacturing - 0,89 0,99 0,64 0,78
Electricity, gas, steam and
air conditioning supply - 0,60 0,53 0,37 0,41
Constructions - 0,37 0,21 0,15 0,37
Wholesale and retail trade - 0,67 1,41 1,26 1,08
Transportation and storage - 1,36 0,99 0,74 0,67
Hotels and restaurants - 0,24 0,24 0,33 0,35
Total market 1,04 1,08 0,80 0,94 0,98
Source: author processing based on the monthly bulletins of Bucharest Stock Exchange available on-line at http://www.bvb.ro/TradingAndStatistics/Publications/ MonthlyReports
Continuing with the analysis of the price to book value, we find that for the entire stock market the ratio was over unit only in 2009 and 2010, a sign that in the last three years of analysis the securities of the issuers were relatively undervalued by the market. At the level of the activity sectors, only mining and quarrying recorded over unit PBV values during the entire analyzed period, while in the construction and hotels and restaurants sectors the level of the indicator was sub unit, not exceeding 0.5 in any year of the period considered.
These issues are not surprising, however, given that companies with a high return on equity and a considerable profit growth rate (as is, largely, the case of companies in the mining and quarrying industry), stimulate the interest of investors and, thus, shares tend to be overvalued.
Table no. 4 The evolution of Price to Book Value for the analyzed companies
Company PBV
2009 2010 2011 2012 2013
1. SNP 2,49 3,35 2,90 4,28 4,70
2. SNG * * * * 34,19
3. PTR 4,20 3,13 2,81 3,25 4,78
4. DAFR 1,02 1,24 0,61 0,33 0,30
5. VNC 0,67 0,74 0,67 0,67 0,69
7. ATB 6,30 5,90 3,90 3,76 5,58
8. BIO 2,01 2,05 1,93 2,09 3,02
9. SCD 6,85 10,00 8,87 7,75 10,70
10. ARTE 0,65 1,08 0,84 3,40 4,00
11. ROCE 2,72 2,36 1,67 1,49 0,63
12. TRP 6,20 4,20 2,00 2,06 1,59
13. STIB 2,00 1,82 2,16 1,80 1,64
14. ALR 4,80 5,98 6,50 4,00 2,89
15. ART 0,72 0,65 0,54 0,53 0,88
16. ELMA 4,00 3,45 2,72 1,89 2,17
17. ELGS 3,85 9,79 3,30 3,98 6,58
18. RTRA 2,30 4,20 1,90 2,10 1,55
19. MECF 1,05 0,90 1,15 1,27 1,42
20. ALT 0,30 0,41 0,34 0,30 0,43
21. CMP 2,90 4,27 3,89 5,50 5,16
22. ARS 2,38 4,04 3,09 4,49 5,00
23. TBM 0,88 0,95 0,47 0,30 0,27
24. AMO 0,19 0,14 0,14 0,07 0,05
25. TEL 1,35 1,94 1,74 1,27 1,58
26. SNN * * * * 1,12
27. IMP 0,71 0,47 0,18 0,11 0,54
28. COMI 6,80 4,59 1,63 0,87 0,76
29. ALU 10,75 7,25 5,15 5,68 5,07
30. RPH 9,30 4,78 6,90 6,70 3,49
31. COTE 9,09 9,09 10,45 10,95 13,64
32. TGN 15,70 28,00 22,33 21,80 18,53
33. OIL 2,40 2,21 1,80 1,60 1,14
34. SOCP 1,45 3,70 3,45 2,12 1,77
35. EL * * * * *
36. TUFE 2,20 1,78 1,60 1,52 1,63
Source: author processing according to the data from the annual financial statements of companies
At individual level, it is noticed that most analyzed enterprises present a price to book value higher than the average value of the activity sector they belong to. Thus, the most overvalued securities are those of companies from the transportation sector, the market price of shares of the company Transgaz exceeding 28 times their book value. Worth mentioning is also the PBV ratio of 34.19 recorded by company Romgaz in 2013, its first year of trading on the regulated market, when investor interest was clearly a high one.
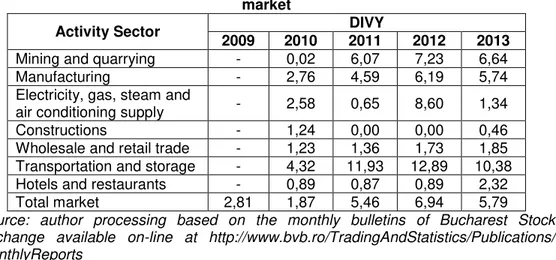
Table no. 5 The evolution of Dividend Yield on activity sectors and for the entire stock
market
Activity Sector DIVY
2009 2010 2011 2012 2013
Mining and quarrying - 0,02 6,07 7,23 6,64
Manufacturing - 2,76 4,59 6,19 5,74
Electricity, gas, steam and
air conditioning supply - 2,58 0,65 8,60 1,34
Constructions - 1,24 0,00 0,00 0,46
Wholesale and retail trade - 1,23 1,36 1,73 1,85
Transportation and storage - 4,32 11,93 12,89 10,38
Hotels and restaurants - 0,89 0,87 0,89 2,32
Total market 2,81 1,87 5,46 6,94 5,79
Source: author processing based on the monthly bulletins of Bucharest Stock Exchange available on-line at http://www.bvb.ro/TradingAndStatistics/Publications/ MonthlyReports
Concerning the evolution of dividend yield on the stock market in Romania we can notice a significant shareholder remuneration, the DIVY ratio being over unit and growing during the period 2009-2013. At sector level, the industry offering the highest dividend yield is that of transportation and storage, in the last three years of analysis the dividend paid per share outperforming its market price over 10 times. In contrast, the construction sector stands out as the area of activity with the lowest dividend yield, being 0 in 2011 and 2012, in the absence of dividend payment.
According to table 6 there are not many the companies in the current study that have remunerated their shareholders during the time period under consideration, which is why the dividend yield is mostly void.
Table no. 6 The evolution of Dividend Yield for the analyzed companies
Company DIVY
2009 2010 2011 2012 2013
1. SNP 0,00 0,05 0,11 0,07 0,07
2. SNG * * * * 0,08
3. PTR 0,04 0,05 0,10 0,09 0,06
4. DAFR 0,00 0,00 0,00 0,00 0,00
5. VNC 0,00 0,00 0,00 0,00 0,00
6. RRC 0,00 0,00 0,00 0,00 0,00
7. ATB 0,00 0,00 0,04 0,10 0,04
8. BIO 0,00 0,03 0,05 0,06 0,00
9. SCD 0,00 0,30 0,09 0,06 0,07
10. ARTE 0,06 0,00 0,11 0,07 0,04
11. ROCE 0,01 0,00 0,06 0,04 0,06
12. TRP 0,00 0,00 0,00 0,00 0,00
13. STIB 0,00 0,00 0,00 0,00 0,03
14. ALR 0,08 0,07 0,10 0,00 0,00
16. ELMA 0,00 0,01 0,01 0,02 0,02
17. ELGS 0,15 0,00 0,00 0,00 0,00
18. RTRA 0,00 0,00 0,00 0,00 0,00
19. MECF 0,00 0,00 0,00 0,05 0,00
20. ALT 0,00 0,00 0,00 0,00 0,00
21. CMP 0,00 0,00 0,00 0,00 0,00
22. ARS 0,11 0,07 0,07 0,06 0,06
23. TBM 0,00 0,00 0,00 0,00 0,00
24. AMO 0,00 0,00 0,00 0,00 0,00
25. TEL 0,00 0,01 0,06 0,03 0,14
26. SNN * * * * 0,11
27. IMP 0,00 0,00 0,00 0,00 0,00
28. COMI 0,00 0,00 0,00 0,00 0,00
29. ALU 0,04 0,00 0,00 0,00 0,63
30. RPH 0,00 0,00 0,00 0,00 0,00
31. COTE 0,07 0,13 0,07 0,09 0,08
32. TGN 0,08 0,10 0,13 0,10 0,09
33. OIL 0,00 0,01 0,02 0,01 0,00
34. SOCP 0,00 0,00 0,00 0,01 0,00
35. EL * * * * *
36. TUFE 0,00 0,00 0,00 0,02 0,03
Source: author processing according to the data from the annual financial statements of companies
However, should be mentioned certain companies that offer a satisfactory dividend yield the entire analyzed time frame, in accordance with the average value of the sector they belong to, like the enterprises from the transportation sector, Conpet and Transgaz. Other entities providing a relatively constant dividend yield, be it not very high, are Zentiva, Artego and Aerostar in the manufacturing industry and company Transelectrica, belonging to the sector of electricity, gas, steam and air conditioning supply.
3. Conclusions
Analyzing the perspective of the stock market on the value of companies listed on Bucharest Stock Exchange has allowed asserting that the shares of these companies are only moderately overvalued by the market, which is assessed as a favorable aspect. On the other hand, the investment payback period on the stock market displays significant fluctuations, while the dividend yield is, generally, a low one, both aspects affecting the market profitability of the analyzed companies’ securities. Thus, it is noticed the opportunity of the companies that form the object of this study to review their dividend policy, in order to improve its performance to show more interest among investors.
subjectivism. Meanwhile, another threat is constituted by the degradation in the stock exchange performance of the studied group of companies as a result of increasing competition for investors’ capital within the regulated market of BSE by transferring a large number of companies from the RASDAQ market.
References
Brealey, R., Myers S. and Allen F. (2006) Corporate finance, McGraw Hill, New York. Brigham, E.F., Gapenski, L.C. and Ehrhardt, M.C. (1999) Financial Management Theory and Practice, Ninth Edition, The Dryden Press, Florida.
Halpern, P., Weston, J.F. and Brigham, E.F. (1998) Finanţe manageriale, Editura Economică, Bucureşti.
Spulbăr, C. (2010) Evaluarea instrumentelor financiare, Curs, Craiova.
Todea, A. (2008) Investiţii, Casa Cărţii de Ştiinţă Publishing House, Cluj-Napoca. Bursa de Valori Bucuresti, http://www.bvb.ro/.