André Luís Teixeira Gutierres
BSc in Biochemistry
Structural and functional studies on human enzymes
involved in hydrogen sulfide breakdown
DISSERTATION FOR OBTAINING THE MASTER’S DEGREE IN BIOCHEMISTRY
Supervisor: Dr. João B. Vicente, ITQB-UNL
Co-Supervisor: Dra. Margarida Archer, ITQB-UNL
Co-Supervisor: Dr. José Artur Brito, ITQB-UNL
Copyright
in name of André Luis Teixeira Gutierres, FCT/UNL and UNL
.
Acknowledgment
After a long journey, it is time to thank who was with me. First of all, a great thank to my fathers and brother, for supporting me all this time and to make sure I gave my best.
A great thank to Professora Doutora Maria Arménia Carrondo for letting me be part of your research group.
A huge thank to the research group partner of Rhodanese and SQR work, Alessandro Giuffrè and Francesca Malagrinò for the amazing collaboration.
The same compliment to Tiago M.Bandeiras and Paulo Espirito Santo for the work on CBS. A thanks to Dr. Katsuaki Inoue for the collaboration on SAXS.
A great acknowledgement to all the people that belongs to the laboratory group, namely Denise, Karim, Patricia, Rute, Sandra and Sara.
A thank you to Dr. Pedro Matias, Dra. Elin Moe, Dr. Colin McVey, Dra. Célia Romão and Dr. Carlos Frazão for the spread of knowledge.
A thank you to Diogo, Ines and Maria from the laboratory of membrane protein crystallization.
An acknowledgement to all personal of iBet company, namely Micael, Cristiana, Joana and Andreia.
For now, I need to make a great acknowledgement to my two co-supervisors, Dra. Margarida Archer and Dr. José Brito. It was the second time that I work with both and like the first one, I really enjoy to learn from they.
For the last, to my supervisor, João Vicente, for keeping me in the right direction. Helping to understand all the methods that we used on this work, to always be concern if I understand all the steps. Not for the grease, but I learned a lot from him and I hope to see our paths cross again in the future.
In a more personal detail, I need to thank all my friends that helped me during this dissertation, each one at his own way. For that, I thank to Ana, Beatriz, Diana, Daniela, Filipa, Mariana, João D., Filipe, Hugo, David S., João S., Patrick, Mário, João R., Ricardo, Rui, João L., Tiago, Ricardo S., João G., Rodrigo.
Abstract
In human physiology, hydrogen sulfide (H2S), a small gaseous molecule that diffuses across
aqueous and hydrophobic milieu, has been shown to team up with NO and CO as the third ‘gasotransmitter’. The still growing number of physiological processes shown to be regulated by H2S
includes blood flow, cellular stress response, inflammation, immune defense, apoptosis and energy metabolism.
Consequently, disturbed H2S metabolism is associated with numerous human pathologies,
from cardiovascular and inflammatory disorders, to neurodegeneration and cancer. As any other reactive signaling molecule, H2S homeostasis requires a fine balance between its synthesis and
breakdown. One of the enzymes involved in the synthesis of H2S in humans is cystathionine β
-synthase (CBS), one key enzyme of the transsulfuration pathway. H2S breakdown relies on a
mitochondrial pathway involving a sulfide:quinone oxidoreductase (SQR), a sulfur dioxygenase, Rhodanese, and a sulfite oxidase. O2-dependent H2S consumption may be primarily controlled by its
efficient catabolism via SQR, which may be a key regulator in switching off H2S signaling by
consuming it.
Although numerous studies have focused on the functional analysis of H2S catabolism
components, there is a paucity of structural data to support i) the understanding of functional/physiological data, and ii) the discovery and design of modulatory compounds with potential pharmacological interest.
The aim of this dissertation was to characterize from a structural and functional viewpoint human enzymes involved in H2S metabolism, employing different biophysical methodologies.
Recombinant human Rhodanese was expressed in Escherichia coli and purified with a yield of 2mg/L of culture. By a combination of DSF (Differential Scanning Fluorimetry), CD (Circular Dichroism) and SAXS (Small Angle X-ray Scattering) studies, it was observed that cysteine, thiosulfate and alliin affects Rhodanese structure. This information was used into crystallization trials but without getting any Rhodanese crystals. The recombinant human SQR expression and purification was unsuccessful, precluding any further studies, and being still under development.
Resumo
Na fisiologia humana, o sulfato de hidrogénio (H2S), uma pequena molécula gasosa que
difunde pelo meio aquoso e hidrofóbico, foi demonstrado que pertence à família dos ‘gasotransmissores’ como o NO e o CO. O numero de processos fisiológicos regulados pelo H2S
continua a aumentar e entre eles inclui-se o fluxo sanguíneo, resposta ao stress celular, inflamação, imunidade, apoptose e metabolismo energético.
Consequentemente, distúrbios no metabolismo do H2S esta relacionado a muitas patologias
humanas, desde cardiovascular e desordens inflamatórias até neurodegeneração e cancro. Como outras moléculas de sinalização reativas, H2S homeostase requer um balanço perfeito entre a sua
síntese e a sua degradação. Uma das enzimas envolvidas na síntese de H2S é a cistationina β
-sintase (CBS), uma enzima chave na via anabólica. A degradação de H2S baseia-se numa vida
metabólica mitocondrial que envolve a sulfato:quinona oxidoreductase (SQR), uma dioxigenase de enxofre (Rhodanese) e uma sulfito oxidase. Os níveis de H2S podem ser controlados pela via
catabólica que envolve a SQR, que pode ser a chave no processo de sinalização pelo H2S, visto que
pode consumir a molécula.
Apesar dos vários estudos terem-se focados na analise do catabolismo do H2S e seus
componentes, há uma falta de dados estruturais que suporta i) o entendimento dos dados sobre a função e fisiologia e ii) descobrir e desenhar compostos modulatórios que possam ter um potencial farmacêutico interessante.
O objetivo desta Tese foi caracterizar de um ponto de vista estrutural e funcional enzimas humanas envolvidas no metabolismo do H2S, empregando diferentes metodologias.
Rhodanese recombinante humana foi expressa em Escherichia coli e purificada com um rendimento de 2mg/L de cultura. A expressão e purificação da SQR recombinante humana foi um insucesso, impedindo qualquer estudo posterior, estando ainda sobre desenvolvimento. Foi demonstrado por ensaios de DSF, CD e SAXS que, na presença de cisteína, tiossulfato e alliin, a Rhodanese sofre modificações na sua estabilidade global, sendo esta informação explorada para ensaios cristalográficos. Mesmo com toda esta informação, não foi possível obter cristais de Rhodanese.
Objectives
The main goal of this dissertation was to structurally characterize human enzymes involved in hydrogen sulfide metabolism.
The detailed objectives of this work were as follows:
1. Purification of recombinant human Rhodanese and sulfide:quinone oxidoreductase (SQR); 2. Screening for compounds with a structural-functional effect towards the target proteins; 3. Validating the selected compounds by biophysical methodologies;
Keywords
Hydrogen Sulfide (H2S)
Sulfide:quinone Oxidoreductase (SQR)
Rhodanese (Rhod)
Cystathionine β-synthase (CBS)
X-ray crystallography
Small Angle X-ray Scattering (SAXS)
Circular Dichroism (CD)
Abbreviations
RNA: Ribonucleic acid
3D: 3-Dimensional
PDB: Protein Data Bank
Cys: Cysteine
DNAses: deoxyribonuclease
HEPES: 4-(2-hydroxyethyl)-1-piperazineethanesulfonic acid
MgCl2: Magnesium Chloride
E.coli: Escherichia coli
Rpm: rotations per minute
NaCl: Sodium Chloride
SDS-PAGE: Polyacrylamide gel electrophoresis
DMSO: Dimethyl sulfoxide
PEG: Polyethylene glycol
ESRF: European Synchrotron Radiation Facility
Index
1 Introduction
1.1 Sulfur chemistry 2
1.2 Sulfur Cycle 3 1.3 Hydrogen Sulfide (H2S) 4
1.4 Hydrogen Sulfide formation in Human Metabolism 5
1.5 Hydrogen Sulfide breakdown in Human Metabolism 6 1.6 Human Cystathionine β-synthase (CBS) enzyme 8
1.7 Human sulfide:quinone oxidoreductase (SQR) enzyme 9 1.8 Human Rhodanese (Rhod) enzyme 10
2 Materials and Methods 2.1 Materials 12
2.2 Expression and Purification of human Rhodanese 12
2.3 Thermal Shift Assay (TSA) of Rhodanese 13
2.4 Circular Dichroism (CD) of Rhodanese 13
2.5 Crystallization of human Rhodanese 14
2.6 Bio-SAXS of Rhodanese: Data collection and Processing 15
2.7 Crystallization of cystathionine β-synthase (CBS) 15
2.8 Model building of cystathionine β-synthase (CBS) 16
2.9 Expression and Purification of Sulfide:quinone oxidoreductase (SQR) 18
3 Results and Discussion 3.1 Expression and Purification of Rhodanese 20
3.2 Biophysical characterization 23
3.2.1 Differential Scanning Fluorimetry (DSF) of Rhodanese 23
3.2.2 Far-UV Circular Dichroism (CD) spectroscopy 28
3.3 Crystallization of Rhodanese 31
3.4 Bio-SAXS of Rhodanese 33
3.5 Model building of CBS 36
Index of Figures
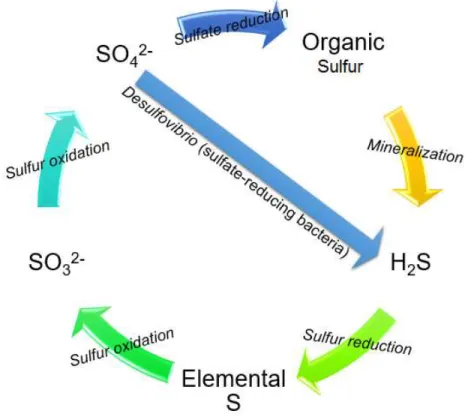
Figure 1 – Sulfur cycle. Sulfate (SO42-) is reduced in to organic sulfur or by action of gut
bacteria, converted to hydrogen sulfide (H2S). The organic sulfur can also be converted to
hydrogen sulfide by a mineralization process. Hydrogen sulfide is reduced to elemental sulfur (S0)
and the cycle goes on a sulfur oxidation to form an intermediate sulfur trioxide (SO32-) and the
final product sulfate.
Figure 2 – Completed human H2S production pathway. CBS catalyzes homocysteine
conversion to cystathionine, then CGL catalysis the cysteine formation with CAT responsible for the catalyze into 3-MP and finally MST catalyzes the conversion into H2S.
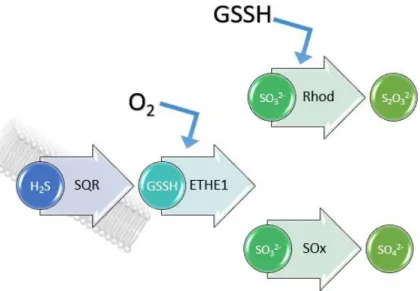
Figure 3 – H2S breakdown pathway. Starts with the formation of GSSH in the presence
of the enzyme SQR. Then oxygen dependent enzyme ETHE1 catalyzes the conversion to SO3-2
and then, two routes possible to follow: One, Rhod in the presence of GSSH catalyzes the conversion to S2O32- or SOx catalyzes the conversion to SO42-.
Figure 4 – Human SQR 3D structure modelling using the swiss-model server [45]. The template has ~19% sequence identity (SQR from Acidithiobacillus ferrooxidans, PDB code: 3szf [41]).
Figure 5 – Human Rhodanese 3D structure prediction. Using swiss-model tool [48], the template has 89,53% sequence identity (Rhodanese from Bos taurus, PDB code: 1boh [44]).
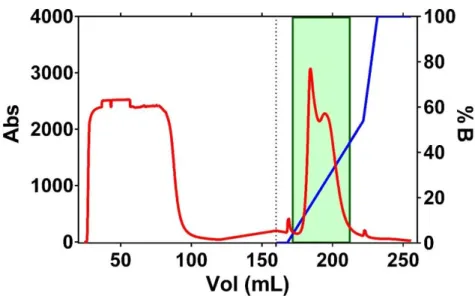
Figure 6 – Chromatogram of Rhodanese affinity chromatography. Purification conditions were: Flow 3mL/min, 10mL for fraction. Gradient start represented by dotted line, with a flow 4mL/min, 4ml for fraction. Fractions in the green box were collected. Used column with a total volume of 5mL. 5x upscale on the gradient.
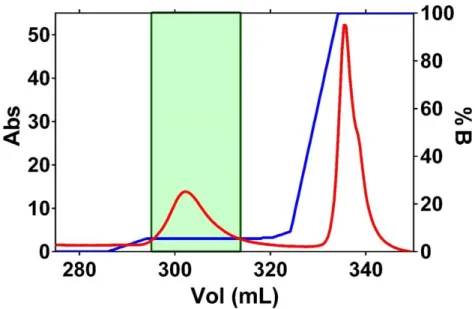
Figure 7 – Chromatogram of Rhodanese Size-exclusion chromatography. Purifications conditions were: Flow 0,8mL/min, collecting 2mL for fraction. All fraction on the green box were collected for analyze. Used column with a total volume of 120mL.
Figure 8 - Chromatogram of Rhodanese anionic-exchange chromatography. Purifications conditions were: Flow 5mL/min, collecting 2,5mL for fraction with hold on 6% bidding buffer. All fraction on the green box were collected for analyze. Used column with a total volume of 5mL. 6% bidding buffer with 2x scale.
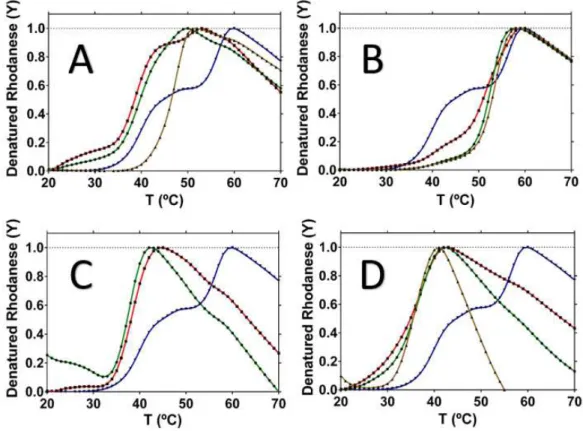
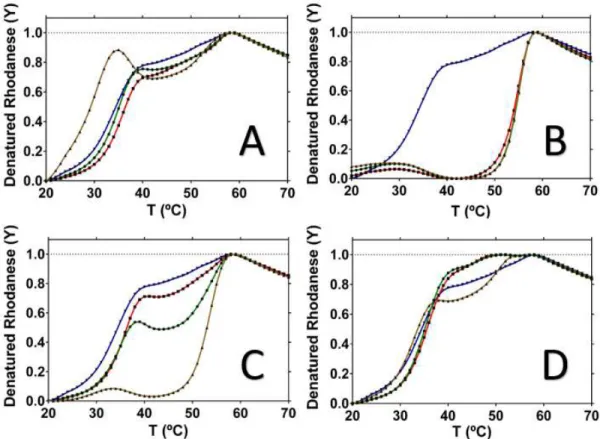
Figure 9 – DSF results with four different compounds. Panel A: Rhodanese with cysteine. Panel B: Rhodanese with thiosulfate. Panel C: Rhodanese with homocysteine. Panel D:
Figure 10 – DSF results with four different compounds. Panel A: Rhodanese with SAC. Panel B: Rhodanese with garlic oil. Panel C: Rhodanese with alliin. Panel D: Rhodanese with allyl sulfide. Rhodanese “apo” data represented by blue curve. Rhodanese was pre-incubated with the compounds at 0.1 mM or 0.001% (red line), 1 mM or 0.01% (green) and 10mM or 0.1% (brown).
Figure 11 – On the left-panel, representation of a CD curve. On the right-panel, representation of a denaturation curve. The Rhodanese concentration is 0,26mg/mL. The CD experiment parameters were: Data pitch 0,5m. d.i.t 1 sec, scanning speed 50nm/min, band with 1nm. The denaturation curve was obtained with fixed wavelength of 222nm.
Figure 12 – On the left-panel, representation of a CD curve, where the orange line is cysteine ligand alone, the green line is the Rhodanese incubated with cysteine and the blue is the difference between the two curves. On the right-panel, representation of a denaturation curve, where in blue is Rhodanese in “apo” form and in green, Rhodanese incubated with cysteine. The Rhodanese final concentration is 0.26 mg/mL and the cysteine final concentration is 1mM. The CD experience parameters were: Data pitch 0.5 m. d.i.t 1 sec, scanning speed 50nm/min, band with 1nm. The denaturation curve was obtained with fixed wavelength of 222nm.
Figure 13 – On the left-panel, representation of a CD curve, where the orange line is thiosulfate ligand alone, the brown line is the Rhodanese incubated with thiosulfate and the blue is the difference between the two curves. On the right-panel, representation of a denaturation curve, where in blue is Rhodanese in “apo” form and in brown, Rhodanese incubated with thiosulfate. The Rhodanese final concentration is 0,26mg/mL and the thiosulfate final concentration is 1mM. The CD experience parameters were: Data pitch 0,5m. d.i.t 1 sec, scanning speed 50nm/min, band with 1nm. The denaturation curve was obtained with fixed wavelength of 222nm.
Figure 14 – On the left-panel, representation of a CD curve, where the orange line is alliin ligand alone, the red line is the Rhodanese incubated with thiosulfate and the blue is the difference between the two curves. On the right-panel, representation of a denaturation curve, where in blue is Rhodanese in “apo” form and in red, Rhodanese incubated with alliin. The Rhodanese final concentration is 0,26mg/mL and the alliin final concentration is 1mM. The CD experience parameters were: Data pitch 0,5m. d.i.t 1 sec, scanning speed 50nm/min, band with 1nm. The denaturation curve was obtained with fixed wavelength of 222nm.
25
28
28
29
Figure 16 – SAXS analysis of human Rhodanese. On the panel A, raw SAXS curves recorded in the “apo” form (green) or presence of cysteine (purple) and thiosulfate (blue). Inset, corresponding Kratky plot (with same color code). The panel B, are the fitted curves (parameters in the Table 3.3).
Figure 17 – SAXS structural models of human Rhodanese. Panel A, molecular shape of “apo” human Rhodanese (blue carton representation corresponds to 3D model based on the bovine Rhodanese structure, PDB code: 1boh). Panel B, bead models of human Rhodanese in the absence (magenta) or presence of cysteine (green). Panel C, bead models of human Rhodanese in the absence (magenta) or presence of thiosulfate (blue).
Figure 18 – Cartoon representation of mutant CBS P49L, highlighting the heme group, the PLP co-factor and the residue 49 (local of the mutation).
Figure 19 – Cartoon representing the superimpose of mutant CBS P49L with a published structure, with the PDB code: 1JBQ
Figure 20 – Chromatogram of SQR affinity chromatography. Purification conditions were: Flow 2mL/min, 2mL for fraction. Two step gradients at 6% and 30%. Fractions in the green box were collected. Used column with a total volume of 5mL. 50x downscale.
Figure 21 – Chromatogram of SQR anionic exchange chromatography. In the left panel the chromatogram of Fraction A and on the right panel the chromatogram of Fraction B. Purification conditions were: Flow 2mL/min, 4mL for fraction. Fractions in the green box were collected. Used column with a total volume of 5mL. In the chromatogram of the right, upscale when gradient start 5x.
Figure 22 – Chromatograms of SQR molecular exclusion chromatography. In the left panel the chromatogram of Fraction A1 and on the right panel the chromatogram of Fraction B1. Purification conditions were: Flow 0,6mL/min, 1,5mL for fraction. Fractions in the green box were collected. Used column with a total volume of 120mL.
Figure 23 – Chromatograms of SQR ResourceQ chromatography. Purification conditions were: Flow 1mL/min, 1mL for fraction. Used column with a total volume of 5mL. Dotted line represent the start of the gradient, that is upscale 5x.
Index of Tables
Table 1 – Data collection and refinement statistics
Table 2 –Melting points of Rhodanese in “apo” form and with several different effectors. n.t means “not tested”. “---“ represents the absence of results.
Table 3 –Melting points of Rhodanese in “apo” form and incubated with three different ligands. The concentration values are the final concentration in the sample Rhodanese+Ligand. “---“ represents the absence of results.
Table 4 – SAXS data collection of Rhodanese and Rhodanese incubated with ligands cysteine and thiosulfate.
16
26
30
1.
–
Introduction
1.1
–
Sulfur chemistry
Sulfur, represented by the atomic symbol S and with an atomic number of 16 in the Periodic Table of the elements [1], has an atomic weight of 32.06 [2]. Sulfur is the 16th more abundant element
in Earth’s crust, with a percentage of 0.034% [3] and exists in different valence states from -2 (as in H2S) to +6 (as in SO4-).
From the biological point of view, sulfur is present in vitamins, hormones and the amino acids methionine and cysteine. Hence, it is one of the most important compounds in human biology belonging to the group CHNOPS – Carbon, Hydrogen, Nitrogen, Oxygen, Phosphors, Sulfur – considered the six more important chemical elements in human life [4]. In human physiology, sulfur plays a major role in some specific metabolic processes. Regarding the two amino acids mentioned above that contain sulfur in its composition, methionine cannot be synthesized by the human body, so it has to be taken up through the diet. On other hand, cysteine can be synthesized de novo. Since the human body is not capable of storing sulfur, it needs to be oxidized to sulfate, excreted in the urine or stored in the form of glutathione (GSH), a powerful body antioxidant [5].
1.2 - Sulfur Cycle
The sulfur cycle (Figure 1.1) comprehends 3 major steps: firstly, the mineralization of organic sulfur into inorganic species, like hydrogen sulfide (H2S); secondly, the oxidation to sulfate (SO42-);
and, finally, the re-reduction to H2S.
Sulfur in the presence of oxygen yields sulfur dioxide (SO2). This compound reacts with water,
producing sulfuric acid (H2SO4) that evaporates to the atmosphere and returns in the form of acid
rain, to be absorbed by plants and restart the cycle [7]. Microorganisms have an important role in the sulfur cycle since they are responsible for the converting of organic sulfur into inorganic.
1.3
–
Hydrogen Sulfide (H
2S)
Hydrogen sulfide (H2S) plays an important role in human physiology since it acts as a
signaling molecule regulating multiple physiological processes [8]. Different studies have demonstrated that H2S, besides being a toxic gas, is an important molecule in human physiology.
H2S is in equilibrium with hydrosulfide (HS-) and sulfide (S2-), as shown by the pKa1~7(H2S/HS-) and
pka2~19(HS-/S2-), at 25ºC. In human blood, where the pH is 7.4, HS- is the more abundant specie
(70-80%), whereas H2S is only around 20-30% and S2- is present in negligible quantities. From now
on, the term “H2S” and “sulfide” are related to each other as the H2S/HS- pair [9].
H2S is considered a gasotransmitter molecule like nitric oxide (NO) and carbon monoxide
(CO) [10], all the three with major roles in physiological processes. Studying the mechanisms of hydrogen sulfide synthesis, its regulation and distribution across cells and tissues was useful to further understand various pathologies directly related to H2S metabolism (like colon cancer,
atherosclerosis and diabetes) [11]. There are two major pathways for H2S production: through
endogenous enzymes, and through the gut microbiota.
In the endogenous pathway, there are three enzymes responsible for the H2S production: the
methionine metabolism cystathionine β-synthase (CBS), cystathionine ỿ-lyase (CGL) and 3-mercaptopyruvate sulfurtransferase (MST) [12]. Regarding gut microbiota, sulfate-reducing bacteria (SRB) represent approximately 50% of the microbial colonization of human gut [13]. These bacteria (including members of the genus Desulfovibrio) consume H2 or organic compounds and the electrons
from that reaction are used for the reduction of sulfate into H2S. SRB are associated with inflammatory
bowel diseases, and there is recent evidence that H2S generated by SRB mediates the inflammation
1.4
–
Hydrogen Sulfide formation in Human Metabolism
Human H2S metabolism is mostly related with the methionine cycle. This cycle starts with the
methionine conversion to S-adenosylmethionine (SAM or AdoMet), catalyzed by the enzyme methionine adenosyltransferase (MAT) [15]. SAM is the methyl donor for virtually all methylation reactions in human physiology. Once it donates the methyl group through various methyltransferases, it is converted into S-adenosylhomocysteine (SAH). In the next step, SAH loses its adenosyl group through a hydrolysis reaction catalyzed by SAH hydrolase. After this step, homocysteine can either enter the transsulfuration pathway or be re-methylated back to methionine. The transsulfuration pathway produces cysteine through enzymes CBS and CGL (Figure 1.2).
CBS catalyzes the condensation of homocysteine with serine to form cystathionine (details for the CBS protein are given below). CGL catalyzes the breakdown of cystathionine into cysteine and α-ketoglutarate. CGL belongs to the pyridoxal 5’-phosphate (PLP)-dependent enzymes, constituted by two main domains, a large PLP-binding domain (the active site) and a smaller domain [17]. It is known for this CGL enzyme the capability of generating H2S using cysteine alone or together
with homocysteine [18]. Noteworthy, CBS can also use the same compounds to generate H2S [16].
The CGL gene may suffer some mutations that can cause cystathioninuria, a disease related to the accumulation of cystathionine in blood or tissues and that may contribute to mental disorders [19].
Besides H2S-generating enzymes of the transsulfuration pathway, another pathway leads to
H2S synthesis. Cysteine can be converted to 3-mercaptopyruvate (3-MP) by cysteine
aminotransferase (CAT), a PLP-dependent enzyme also named glutamate oxaloacetate transaminase (GOT). The last enzyme is 3-mercaptopyruvate sulfurtransferase, MST, that catalyzes the conversion of 3-mercaptopyruvate into H2S, through a cysteine active site [20]. This enzyme
belongs to the family of sulfurtransferases, has 60% sequence similarity with another enzyme involved in the H2S breakdown (Rhodanese), and a molecular weight of 34 kDa. MST has two
domains and the local active site where 3-MP binds is located between these two domains [21].
1.5
–
Hydrogen Sulfide breakdown in Human Metabolism
Since high H2S levels can be harmful to human welfare, a sulfide breakdown pathway is
necessary [22]. This catabolic pathway is known as the sulfide oxidizing unit (SOU) and its main objective is the conversion of H2S into thiosulfate (S2O32-) and/or sulfate (SO42-) in order to be
eliminated from the body in the urine. There are four known enzymes involved in this pathway: Sulfide:Quinone Oxidoreductase (SQR), Sulfur Dioxygenase (ETHE1), Rhodanese (Rhod) and Sulfite Oxidase (SOx). All these enzymes are within the mitochondria and SQR may, under special conditions, supply electrons for the mitochondrial oxygen respiration electron transfer chain [23]. The SQR enzyme, a flavoenzyme, catalyzes the conversion of H2S and glutathione into glutathione
persulfide (GSSH) [24] while transferring the electron equivalents to ubiquinone [25]. These electrons can then be fed into complexes III and IV. SQR can be related to oxygen respiration and the enzyme is essential to the human H2S breakdown so this enzyme plays an essential role of maintaining H2S
levels in a restricted range, since at lower concentration it feeds the mitochondrial electron transfer chain involved in oxygen respiration. Higher levels of H2S can leaves to all complex inhibition.
The second enzyme in the pathway, ETHE1, is a 54 kDa metalloenzyme that catalyzes the conversion of GSSH into sulfite (SO32-) using oxygen as co-substrate [26]. Mutations in the
ETHE1-encoding gene are directly related to the disease ethylmalonic encephalopathy (that affects mainly the nervous system). SO32- can then follow two different routes [27], one of which is catalyzed by
Rhodanese (Figure 1.3) to produce S2O32- (also using GSSH as co-substrate). Rhodanese is an
Figure 1.3 – H2S breakdown pathway. Starts with the formation of GSSH in the presence of the enzyme SQR.
Then oxygen dependent enzyme ETHE1 catalyzes the conversion to SO3-2 and then, two routes possible to
follow: One, Rhod in the presence of GSSH catalyzes the conversion to S2O32- or SOx catalyzes the conversion to SO42-.
SO32- can also be oxidized to SO42- by SOx (Figure 1.3). In the human body, this enzyme
functions as a homodimer. On the N-terminus, a heme b cofactor is present while in the C-terminus is present a molybdopterin cofactor (with a molybdenum center), the site of sulfite oxidation [30].
This project focuses on the structural and functional studies of three enzymes that are part of the H2S metabolism: Cystathionine β-synthase (CBS), sulfide:quinone oxidoreductase (SQR) and
1.6
–
Human Cystathionine β
-synthase (CBS) enzyme
CBS is the first enzyme of the transsulfuration branch of methionine metabolism, catalyzing the conversion of homocysteine and serine to cystathionine [31]. Human Cystathionine β-synthase (hCBS) is considered an homotetrameric enzyme, each subunit having a molecular weight of 63 kDa, and with three major domains: The N-terminal region harboring a b-type heme, one catalytic core with the cofactor pyridoxal-5’-phosphate (PLP) and a regulatory C-terminal domain responsible for enzyme allosteric regulation [32]. The C-terminal domain has a major role on the activation or inhibition of this enzyme, containing a pair of CBS motifs (conserved structural domains) where the activator S-adenosylmethionine (AdoMet) binds. This region is also called “Bateman module” because of the assumed shape and it is considered to be responsible for CBS tetramerization [33].
The structural conformation of the basal form of CBS hampers substrate access to the catalytic core. When the activator AdoMet binds to the regulatory domain, the enzyme changes its domain arrangement and the catalytic core opens to substrate binding. Low CBS activity can cause some disturbances on the normal pathway and can lead to certain diseases like thrombosis and vascular disease [34]. The cbs gene can suffer some mutations that alter enzyme activity and protein folding and stability [35] and can cause classical homocystinuria, a disorder in the metabolism of methionine that affects the nervous and vascular systems [36]. Some CBS mutations also affect AdoMet activation, either by increasing the rate of activation or inhibiting its binding. Herein was studied a disease-causing variant, P49L, which affects protein function, without any influence on the AdoMet activation [37].
Despite the importance of CBS in the hydrogen sulfide metabolism, it has been demonstrated that an inhibition of CBS will not stop H2S production since CGL has the capacity to produce H2S by
itself [38]. The inhibition of CBS enzyme can be caused by the other two gasotransmitters, NO and CO [39].
1.7
–
Human sulfide:quinone oxidoreductase (SQR) enzyme
SQR belongs to the flavoprotein disulfide oxidoreductases family. Like the enzymes of this family, SQR is thought to have two redox centers: one cysteine disulfide and a flavin adenine dinucleotide (FAD), which transfers electrons to the quinone pool. SQR is bound to the mitochondrial membrane [40]. One of the objectives of this work was to obtain the crystallographic structure of human SQR. Until today, studies have demonstrated that SQR has an important role in maintaining low intracellular H2S levels below toxic [41]. Besides the conversion reaction of H2S to glutathione
persulfide (GSSH), another reaction that involves SQR is the reduction of ubiquinone into ubiquinol, using the electrons released from H2S oxidation.
Although there is no 3D structure of human SQR, there are some structures of different organisms published, as for example, from Acidianus ambivalens [42]. That information can be used to predict a model for the human SQR (Figure 1.4). Although having a low sequence similarity (~30%), the crystallographic structure of SQR from Acidithiobacillus ferrooxidans (PDB ID: 3SZF) was used as a template.
Figure 1.4 – Human SQR 3D structure modelling using the Swiss-model server [47]. The template has ~19%
1.8
–
Human Rhodanese (Rhod) enzyme
Although the crystallographic structure of human Rhodanese has not yet been reported, Rhod is an enzyme very well functionally studied. In early days, the only known role for this enzyme was the detoxification of cyanide, particularly the conversion of thiosulfate and cyanide to thiocyanate and sulfite. For this reason, it was attributed the name of thiosulfate:cyanide sulfurtransferase and can be used as an antidote for cyanide poising [44]. The role of Rhod in the sulfide oxidizing unit was only found in later studies. An interesting fact is the possibility of this enzyme to have a reversible reaction mechanism. Rhod major role is the S2O32- production but can also produce GSSH with less
efficiency. Any changes in the Rhodanese-encoding gene can be related to certain diseases like ulcerative colitis and influence the nervous system [45].
In the absence of a crystallographic structure, only predictions can be made using Rhod from different organisms with a high sequence identity. Using the structure prediction tool SWISS-MODEL [48], it was possible to generate a 3D model [49].
Figure 1.5 – Human Rhodanese 3D structure prediction. Using swiss-model tool [50], the template has 89,53% sequence identity (Rhodanese from Bos taurus, PDB code: 1BOH [46]).
2
–
Material and Methods
2.1
–
Materials
Kanamycin, sucrose and glycerol were purchased from Carl Roth. Tris, lysozyme, DNAses, imidazole, HEPES, ampicillin, gentamicin, TrisAcetate, MgCl2 and Triton X-100 were bought from
Sigma Aldrich. IPTG was bought from Apollo and protease inhibitors from Roche. All the compounds used in DSF (Differential Scanning Fluirometry) and CD (Circular Dichroism) assays were bought from Sigma.
2.2 - Expression and Purification of human Rhodanese
A pET28b-based construct containing the codon optimized synthesized gene encoding human Rhodanese cloned between the NcoI and XhoI sites was purchased from Genscript (USA). Competent E. coli BL21(DE3) cells were transformed with the Rhodanese expression plasmid. A single colony was used to inoculate 50 ml of Luria Bertani (LB) medium supplemented with 50µL of 50 mg ml-1 kanamycin, and grown overnight at 37ºC and 180 rpm. The bacterial culture (40ml) was
used to grow 4x1L in LB medium containing 4mL 50 mg ml-1 kanamycin, growing at 28ºC and 180
rpm until the O.D600 reach 0.5-0.6 (~3 hours). At this point, 400 µL of 1M Isopropyl β
-D-1-thiogalactopyranoside (IPTG) were added and temperature and stirring reduced to 16ºC and 120 rpm, respectively, for 18 h. The cells were collected by centrifugation at 7500 rpm for 5 minutes at 6ºC. The cells were stored at -20º.
After thawing, the cells were suspended in lysis solution containing 50 mM TrisHCl pH 8, 500 mM NaCl, 2,5 mg/ml Lysozyme, one tablet protease inhibitors and DNAse and sonicated on ice with a pulse sequence of 30s pulse, 30s rest with a total of 10 minutes. Cell debris were removed by centrifugation at 18000 rpm for 30 minutes at 6ºC.
The first step of purification was an affinity exchange using and HisTrap FF Crude 5ml pre-equilibrated with 50mM Tris pH8 and 500mM NaCl. The elution of Rhodanese was made with a linear gradient from 0 to 500mM of Imidazole. The fractions with Rhodanese were identified by SDS-PAGE and concentrated by ultra-filtration (Amicon®) in a benchtop centrifuge at 5000 rpm, 6ºC. A size
2.3
–
Differential Scanning Fluirometry (DSF) of Rhodanese
This technique can be used to determine the amount of denatured protein by temperature increase under different conditions [51]. To follow that denaturation, it is necessary to add a dye to the sample, named SYPRO Orange (SIGMA). When the protein starts to unfold due to the applied heat (thermal denaturation), this dye will bind to the exposed hydrophobic regions [52], increasing its fluorescence. Each well has 5µl of an effector (buffer, salt, small molecule), 20µL protein (5µg) and 25µL of SYPRO(20x), in a total of 50µL per well. Each tested condition was made in triplicate.
This 96-well screen assembles several different conditions to test. In these trials, we tested the “apo” form of Rhodanese and incubated with different compounds to compare the behavior. These trials were performed on a BioRad iQ5 RT-PCR Optical System. The different compounds tested were Glutathione, Cysteine, Homocysteine, Thiosulfate, Sulfite, Garlic oil, DMSO, Allyl Sulfide, Alliin, S-allyl-cysteine, S-methyl-cysteine and N-acetyl-cysteine.
2.4
–
Circular Dichroism (CD) of Rhodanese
Structural studies can be done with different kind of methods and CD is one of those. It is a method that is based on circular polarized light that diffracts into two different directions [53]. One of this technique purpose is to assess/analyze the secondary structure of proteins and the protein behavior under thermal denaturation. Rhodanese was tested on a range of wavelength from 205nm to 260nm to see the structural variation with the presence of ligands.
2.5
–
Crystallization of human Rhodanese
X-ray crystallography is one of the most frequent methods to determine the 3D structure of macromolecules. The theoretical concept behind X-ray crystallography is the ability of crystals of protein to diffract X-ray light [55]. However, one of the major bottlenecks of this technique is to obtain good quality, single crystals that can diffract X-rays. Only from these it is possible to obtain a good diffraction pattern to proceed with data collection and all subsequent steps (see below). The concept of crystals is to assure that protein molecules are organized in the same way in a confined space acting as a “signal amplifier” for the X-ray diffraction, where the asymmetric unit multiplied by x will form the unit cell [56]. The three dimensional arrangement of n unit cell forms the crystal. When the light targets the crystal and is diffracted, originates several diffractions spots. Each spots contain information about all atoms of the molecule, which is characterized by the amplitude (Fhkl), related
with the number of electrons that each atom contributes and by a phase (αhkl), related with the position
of the atoms in the unit cell. Besides the amplitude of each spot, also the relative angle of each spot is necessary to solve, originating the phase problem [57].
This phase problem, today, can be solved by different methods, the most common being Molecular Replacement, which consists of using a known structure to serve as base for the new data. When there is no possible to use a published structure, other methods can be applied, like MIR, MAD and SAD. MIR (Multiple Isomorphs Replacement), consist in introduce a heavy metal, like iron, in the crystal to cause different intensity variation in the diffraction and then compare that information with the without heavy metal. MAD (Multiple Anomalous Dispersion) consist in the anomalous effect caused by the heavy metal when read in different wavelengths. SAD (Single Anomalous Dispersion) is the same as MAD but only with one wavelength [58].
2.6
–
Bio-SAXS of Rhodanese: Data collection and Processing
Small-Angle X-ray Scattering (SAXS) is a method for the structural characterization of macromolecules in solution. The main information provided by this technique is the size and the shape of the protein “envelope” in solution. It is different from X-ray crystallography since the range of resolution varies between 1nm and 2nm (lower than the resolution provided by X-ray crystallography) [59]. Moreover, the macromolecule is not constrained to a limited space like in the crystal hence providing valuable information regarding mobility, domain arrangement and oligomeric state in solution. Synchrotron X-ray scattering data from human Rhodanese were collected at the B21 beamline (Diamond Light Source, Oxford, UK).
Scattering patterns were measured at protein concentrations ranging from 0.9 to 15 mg/mL. B21 beamline operates in a fixed camera length configuration (4.014 meters) at 12.4 keV, allowing measurements in a resolution range of 0.038 < s < 4.2 nm-1. Each collected frame results from a 10
second exposure at a wavelength of 1.39 Ǻ (maximum achievable resolution of 2.4 Ǻ). Each curve results from 18 scaled and merged frames, to which 18 scaled and merged buffer backgrounds frames have been subtracted. Data were processed and analyzed using the ATSAS software package [60]. The forward scattering I0 and the radius of gyration Rg were evaluated using the Guinier
approximation (Table 3.3). The maximum dimensions Dmax (Table 3.3) were calculated with SAS Data
Analysis Primusqt using AutoGNOM, also determining the distance distribution functions p(r). Low-resolution shape analysis of human Rhodanese in the absence or presence of the tested effector compounds (cysteine and thiosulfate) was performed using the ab initio program DAMMIN [61], which represents the protein as an assembly of densely packed beads.
2.7
–
Crystallization of cystathionine β
-synthase (CBS)
2.8
–
Model building of cystathionine β
-synthase (CBS)
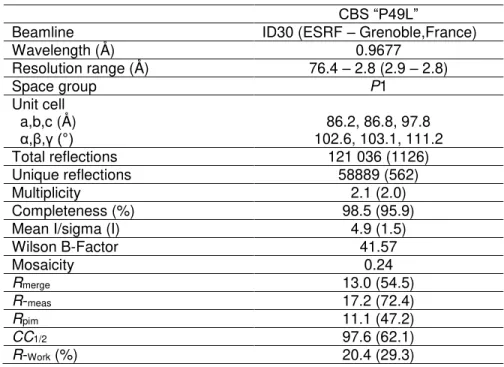
Cryoprotection conditions for diffraction experiments were achieved by transferring the crystals to a 3 µl drop of 35% PEG 2000MME, 5% glycerol, 0.15M NaBr. The crystals were flash-cooled by quick plunging into liquid nitrogen. A single crystal was used for data collection under a nitrogen-gas stream (Oxford Cryosystems 700) on beamline ID30A-3 at the ESRF synchrotron (Grenoble, France) using a PILATUS 6M detector (Dectris) at a wavelength of 0.9677 Å. After indexing and calculation of a data collection strategy using EDNA, a wedge of 360o of data was
collected using. The data set was indexed and integrated with XDS [62] space-group assignment was performed with POINTLESS [63] and scaling was performed with AIMLESS [64] all within the autoPROC data-processing pipeline [65].
At this stage an Rfree-flag set was created in each data set corresponding to 5 % of the
measured reflections for this data-set. Crystal belong to the monoclinic space group P1 with unit cell parameters a = 86.2 Ǻ, b = 86.8 Ǻ, c = 97.8 Ǻ, α = 102.6°, β = 103.1°, γ = 111.2°. Data were truncated at 2.80 Ǻ, for the P49L variant and at 2.4 Ǻ for the WT. Reduction statistics are presented in Table 2.1. The CBS P49L mutant structure was solved by molecular replacement using 1JBQ devoid of any solvent and cofactors as search model. Based on the Matthews coefficient, the search was performed for six molecules. Initial refinement rounds were carried out with BUSTER-TNT [66] using the macro that accounts for missing parts of the model.
At this point, electron density features attributed to the heme moieties were easily identified. Iterative cycles of manual model building with COOT [67] and refinement are in progress.
Table 2.1 – Data collection and refinement statistics
CBS “P49L”
Beamline ID30 (ESRF – Grenoble,France)
Wavelength (Å) 0.9677
Resolution range (Å) 76.4 – 2.8 (2.9 – 2.8)
Space group P1
Unit cell a,b,c (Å)
α,β,γ (°) 102.6, 103.1, 111.2 86.2, 86.8, 97.8 Total reflections 121 036 (1126) Unique reflections 58889 (562)
Multiplicity 2.1 (2.0)
Completeness (%) 98.5 (95.9) Mean I/sigma (I) 4.9 (1.5)
R-Free (%) 23.8 (32.4)
Number of non-hydrogen atoms Macromolecules
Ligands
16391 15781 348
Protein residues 2063
RMS (bonds) (Å) 0.013
RMS (angles) (°) 1.69
Ramachandran favored (%) 97.0 Ramachandran outliers (%) 0.8 Rotamer outliers (%) 2.1
Clashscore 2.79
Average B-Factor Macromolecules Ligands
Solvent
2.9
–
Expression and Purification of Sulfide:quinone oxidoreductase (SQR)
A pET23a-based construct containing the codon optimized synthesized gene encoding human SQR was purchased from Genscript (USA). Competent E. coli BL21 Arctic cells were transformed with the SQR expression plasmid. A single colony was used to inoculate in 50mL LB medium supplemented with 25µL of 200µM ampicillin and 25µL of 20µM gentamicin and grown overnight at 37ºC and 180 rpm. The bacterial culture (40ml) was used to grow 4x1 liters of Terrific Broth (TB) medium containing 2000 µL of 200µM ampicillin, growing at 28ºC and 150 rpm until the O.D600 reach 1.2-1.3. At this point, the bacterial culture was moved to 15ºC and 150 rpm until the
O.D600 reach 1.5-1.6. When achieved, 2000 µL of 1M Isopropyl β-D-1-thiogalactopyranoside (IPTG)
were added maintained the temperature and agitation overnight. The cells were collected by centrifugation at 7500 rpm for 5 minutes at 6ºC. The cells were stored at -20ºC.
Upon thawing, the cells were suspended in lysis solution containing 50mM Tris Acetate pH7.6, 500mM sucrose, 20mM Imidazole, 5mM MgCl2, lysozyme, DNAse and one tablet of protase
inhibitors. The cell suspension was disrupted using a French Press with 690-720 bar gap. The cell suspension was centrifuged using a JA-10 rotor at 7500 rpm and 6ºC for 10 minutes. The volume obtained was the reference to add the same volume of a solution containing 50mM KPi pH7.4, 4% (V/V) Triton X-100; 10% (V/V) glycerol and 100mM NaCl and stirring for 2 hours at 4ºC. The cell suspension was centrifuged using a rotor JA-20, 19000 rpm for 30 minutes at 6ºC. To each 100mL of cell suspension, was added 8.5mL of TrisHCL 1M, 5.8 mL of NaCL 5M and 600 µL of Imidazole 2M.
3
–
Results and Discussion
3.1 - Expression and Purification of Rhodanese
Recombinant human Rhodanese was expressed and purified as reported in Lybiad et. al [27]. Escherichia coli BL21(DE3) was the used host cell since it is one of the most common expression strains and it proved to be efficient [68]. The first purification step was a metal affinity chromatography, more precisely, a HisTrap [69]. The Rhodanese-encoding plasmid was designed to include a 6xHis-tag on the protein N-terminus, thus allowing to use this type of affinity column.
Figure 3.1 – Chromatogram of Rhodanese affinity chromatography. Purification conditions were: Flow 3mL/min, 10mL for fraction. Gradient start represented by dotted line, with a flow 4mL/min, 4ml for fraction. Fractions in the green box were collected. Used column with a total volume of 5mL. 5x upscale on the gradient.
Figure 3.2 – Chromatogram of Rhodanese Size-exclusion chromatography. Purifications conditions were: Flow 0,8mL/min, collecting 2mL for fraction. All fraction on the green box were collected for analyze. Used column with a total volume of 120mL.
The eluted fractions were analyzed by SDS-PAGE and the Rhodanese-containing fractions were pooled and designated as Fraction R1A (Appendix 2). The SDS-PAGE revealed the presence of Rhodanese with some contaminants, not completely pure for crystallization trials. So, for that reason, a third purification step it was necessary, namely an anionic exchange chromatography [72].
After dialysis to lower the ionic strength, Fraction R1A was loaded onto the anionic exchange Q-Sepharose column. A linear gradient up to 1M NaCl was employed, and at 60 mM NaCl a hold step was applied. Once the first protein peak eluted, the gradient was resumed and a second peak eluted. The two protein peaks were analyzed by SDS-PAGE, allowing to establish that the first eluted peak corresponds to pure Rhodanese (Appendix 3), whereas the second peak corresponds to the contaminant proteins. Rhodanese was concentrated and quantitated by the Bradford method [73]. Rhodanese yield is calculated as 2 mg Rhod/L of culture.
3.2 - Biophysical characterization
3.2.1 - Differential Scanning Fluorimetry (DSF) of Rhodanese
Since the initial crystallization trials were not successful, the major objective was to search some compounds that could help the crystallization of Rhodanese. To do that, DSF assays were performed in search for Rhodanese function and structure modulators. Some compounds are present in the metabolic pathway where Rhodanese is present. From the denaturation curves arising from DSF, melting temperatures can be extracted. That information can be compared between Rhodanese in “apo” form and the enzyme incubated with effectors.
The first DSF assays aimed to evaluate the effect of cysteine, thiosulfate, homocysteine and sulfite on Rhodanese stability.
Figure 3.4 – DSF results with four different compounds. Panel A: Rhodanese with cysteine. Panel B: Rhodanese with thiosulfate. Panel C: Rhodanese with homocysteine. Panel D: Rhodanese with sulfite. Rhodanese “apo” data represented by blue curve. Rhodanese was pre-incubated with the compounds at 0.1 mM (red line), 1 mM (green) and 10mM (brown).
40ºC, closer to Tm1, suggesting that cysteine affects the Rhodanese structure by destabilizing one of the two domains.
Thiosulfate has an opposite effect compared with cysteine, since it appears to stabilize Rhodanese (Figure 3.4, Panel B), making the enzyme more thermoresistant. The stabilizing effect affects the domain with the lower Tm, causing the protein to denature with a single transition closer to the ‘Apo’ Tm2. The fact that thiosulfate stabilizes Rhodanese may be related with fact that it is its reaction product.
Incubated with Rhodanese was also homocysteine (Figure 3.4, Panel C), a homologue of cysteine. Rhodanese suffers the same destabilization that cysteine caused. The melting point is only one, around 38ºC. Rhodanese in the presence of homocysteine gets completely denatured at a lower temperature, around 45ºC, a lower value compared with cysteine.
Sulfite results in the same destabilization behavior. Rhodanese incubated with sulfite (Figure 3.4, Panel D), is completely denatured at around 40ºC, with a single melting transition, with a Tm around 36ºC.
Figure 3.5 – DSF results with four different compounds. Panel A: Rhodanese with SAC. Panel B: Rhodanese with garlic oil. Panel C: Rhodanese with alliin. Panel D: Rhodanese with allyl sulfide. Rhodanese “apo” data represented by blue curve. Rhodanese was pre-incubated with the compounds at 0.1 mM or 0.001% (red line), 1 mM or 0.01% (green) and 10mM or 0.1% (brown).
Rhodanese “apo” data are different from the initial trials since the two melting transitions are not so well defined. The reason for that could be that the SYPRO [75] working concentration was wrong, since the commercial stock tends to degrade over time, which often results in an a priori protein destabilization. Nevertheless, and since DSF is essentially used as a comparative method, the effect of compounds can still be analyzed with respect to the ‘Apo’ data.
Regarding the SAC effect (Figure 3.5, Panel A), there are few changes compared to the normal behavior of Rhodanese. The denaturation of Rhodanese occurs at the same point independently of effector concentration. The only difference is in the highest effector concentration, 10mM, when the curve shows two different peaks and the melting points are affected. SAC is known to be a component of garlic extracts.
compound can do the same effect that this global effector [76]. As already demonstrated, SAC is not one of them.
Alliin, another garlic extract component (Figure 3.5, Panel C), has an identical effect. The effect is the same as the garlic oil but not so expressive. At lower concentrations (0.1mM and 1mM), Rhodanese still maintains two melting points. This effector has potential to induce some functional modifications on Rhodanese that could help the protein crystallization. Allyl sulfide (Figure 3.5, Panel D) had minor effects, despite being a garlic oil component. The effector concentration variation has influence on the stability of Rhodanese but not as much other effectors.
Table 3.1 –Melting points of Rhodanese in “apo” form and with several different effectors. n.t means “not tested”. “---“ represents the absence of results.
Effector
Concentration
Tm 1
Tm 2
Frac
Rhodanese “apo” 1
40ºC
55ºC
63%
Cysteine
0.1 mM
1 mM
10 mM
39ºC
40ºC
43ºC
---
---
---
---
---
---
Thiosulfate
0.1 mM
1 mM
10 mM
41ºC
43ºC
44ºC
51ºC
52ºC
53ºC
29%
15%
16%
Homocysteine
0.1 mM
1 mM
38ºC
37ºC
---
---
---
---
Sulfite
0.1 mM
1 mM
10 mM
33ºC
36ºC
36ºC
---
---
---
---
---
---
Glutathione
0.1 mM
1 mM
39ºC
39ºC
---
---
---
---
Rhodanese “apo” 2
33ºC
50ºC
86%
SMC
0.1 mM
1 mM
10 mM
35ºC
35ºC
34ºC
50ºC
52ºC
53ºC
80%
81%
77%
NAC
0.1 mM
1 mM
10 mM
---
39ºC
30ºC
---
---
---
---
---
---
SAC
0.1 mM
1 mM
10 mM
35ºC
34ºC
27ºC
51ºC
52ºC
53ºC
80%
82%
77%
Allyl Sulfide
0.001%
0.01%
0.1%
35ºC
35ºC
32ºC
---
47ºC
49ºC
---
96%
73%
3.2.2 - Far-UV Circular Dichroism (CD) spectroscopy
The data provided by the DSF assays were important to select some compounds that modulate Rhodanese function [77]. To further evaluate the effect of these compounds, Far-UV circular dichroism was employed to study the effect of the compounds on the Rhodanese secondary structure.
Figure 3.6 – On the left-panel, representation of a CD curve. On the right-panel, representation of a denaturation curve. The Rhodanese concentration is 0,26mg/mL. The CD experiment parameters were: Data pitch 0,5m. d.i.t 1 sec, scanning speed 50nm/min, band with 1nm. The denaturation curve was obtained with fixed wavelength of 222nm.
concentration is 1mM. The CD experience parameters were: Data pitch 0.5 m. d.i.t 1 sec, scanning speed 50nm/min, band with 1nm. The denaturation curve was obtained with fixed wavelength of 222nm.
Cysteine has a negligible effect on the spectral shape of Rhodanese, as compared to the isolated protein (Figures 3.6 and 3.7, left panel). Regarding the melting temperatures, cysteine causes a general decrease in thermal stability, with an 8ºC decrease in both Tm’s, Rhodanese becoming totally denatured below 50ºC. This is the same effect that the DSF assay showed for cysteine.
Figure 3.8 – On the left-panel, representation of a CD curve, where the orange line is thiosulfate ligand alone, the brown line is the Rhodanese incubated with thiosulfate and the blue is the difference between the two curves. On the right-panel, representation of a denaturation curve, where in blue is Rhodanese in “apo” form and in brown, Rhodanese incubated with thiosulfate. The Rhodanese final concentration is 0,26mg/mL and the thiosulfate final concentration is 1mM. The CD experience parameters were: Data pitch 0,5m. d.i.t 1 sec, scanning speed 50nm/min, band with 1nm. The denaturation curve was obtained with fixed wavelength of 222nm.
Figure 3.9 – On the left-panel, representation of a CD curve, where the orange line is alliin ligand alone, the red line is the Rhodanese incubated with thiosulfate and the blue is the difference between the two curves. On the right-panel, representation of a denaturation curve, where in blue is Rhodanese in “apo” form and in red, Rhodanese incubated with alliin. The Rhodanese final concentration is 0,26mg/mL and the alliin final concentration is 1mM. The CD experience parameters were: Data pitch 0,5m. d.i.t 1 sec, scanning speed 50nm/min, band with 1nm. The denaturation curve was obtained with fixed wavelength of 222nm.
Like the other two tested ligands, alliin also had practically null effects on the CD spectra of Rhodanese. In the CD-monitored experiments, alliin seems to alter the thermal denaturation profile without dramatically changing the thermal stability. Indeed, Rhodanese is denatured in a single transition, with a Tm of 53°C. These results also deviate from the DSF assays, although both methods indicate that alliin affects the overall Rhodanese stability.
Table 3.2 – Melting points of Rhodanese in “apo” form and incubated with three different ligands. The concentration values are the final concentration in the sample Rhodanese+Ligand. “---“ represents the absence of results.
Effector Tm 1 Tm 2
[Rhodanese]=0,26mg/mL 48ºC 58ºC
[Cysteine] = 1mM 40ºC 50ºC
[Thiosulfate] = 1mM 49ºC 54ºC
[Alliin] = 1mM 53ºC ---
3.3 - Crystallization of Rhodanese
Successful purification of Rhodanese with high purity level made possible to proceed with initial crystallization trials to get Rhodanese crystals and determine its 3D crystallographic structure. The first screenings were with Rhodanese in its “apo” state at a concentration of 15 mg/mL using the commercially available screenings PACT Premier, JCSG+, SturaFootPrint and Structure Screen 1&2 (all from Molecular Dimensions). These plates were visualized for a long time but no crystals, or any other indication of possible crystal formation (crystalline material or spherulites) were observed. However, from the observations of the drops, one conclusion was that the protein concentration could be too high as inferred from the heavy precipitate observed in most drops.
The concentration of Rhodanese was then reduced to ~7,5 mg/mL and the crystallization screenings repeated as above. Since no crystals were still observed, we placed the hypothesis that Rhodanese could have difficulties to crystalize in its apo form. So, the next step was to use the information provided by CD and DSF. The three ligands with the more promising results on that trials, cysteine, thiosulfate and alliin, can cause some modification on Rhodanese and help crystallogenesis. In the sample preparation, Rhodanese was previously incubated with the ligands, separately. The final concentration of Rhodanese was 10mg/mL and the ligand concentration was 10mM. The screenings used were the same as before (Pact Premier, Structure Screen 1&2, JCSG+ and Footprint).
Figure 3.10 – Crystal photography of a hit in the Structure Screen 1&2 screening, taken with a Leica microscope coupled with a camera. The condition is Rhodanese in the presence of cysteine ligand.
forced us to employ a new strategy, like changing the screenings conditions. For that, the next trials were made with several other screenings, namely Midas, Morpheus, PGA and Clear Strategy, all based in non-PEG screenings, providing some complementary information. It is also adequate to soluble proteins. The Rhodanese concentration and ligand concentration remained the same. All this screening come out with no crystal formation.
3.4 - Bio-SAXS of Rhodanese
For the SAXS experiments, the collected data were processed using programs from the ATSAS suite [60]. Data collection and reduction parameters are shown in Table 3.3. Three independent experiments were made: Rhodanese in its apo form, incubated with cysteine and incubated with thiosulfate. The I0 represents the intensity when the scattering angle is zero, showing
small differences between the three. The ligands themselves have a difference of 0.006 lower with thiosulfate, being thiosulfate the higher one. This could mean that Rhodanese is more dispersed on the solution. The radius-of-gyration (Rg), translates to the mass distribution of the molecule around
its gravity center. Comparing the results, Rhodanse “apo” and Rhodanese incubated with thiosulfate have a very similar Rg, indicating that both are nicely compacted around the protein center of gravity.
In case of cysteine presence, it seems to be not so compact.
One parameter that corroborates this statement is the Dmax(nm), which gives information
about the maximum distance between two appositive points (in a rough approximation, Dmax can be
translated to a diameter). The values of Dmax indicated that Rhodanese incubated with cysteine is
more elongated than with thiosulfate, where it seems more compact. This effect of cysteine corroborates the information of DSF and CD, making Rhodanese more labile to thermal denaturation. The same for thiosulfate, where the information of the biophysical methods show a Rhodanese more resistant to thermal denaturation.
Table 3.3 – SAXS data collection of Rhodanese and Rhodanese incubated with ligands cysteine and thiosulfate.
“apo” Rhodanese Rhodanese + 1mM
cysteine
Rhodanese + 1mM thiosulfate Primus Guinier Wizard
I0 0.0048 ± 1.7E-5 0.007 ±2.9E-5 0.013 ± 2.4E-5
Rg 2.06 ± 0.03 3.51 ± 0.37 2.13 ± 0.08
sRg limits 0.50 ± 1.30 0.43 – 1.25 0.34 -1.29
Fidelity 0.85 0.94 0.95
Range 73 - 214 29 – 114 42 – 205
Distance distribution (GNOM)
Dmax(nm) 6.42 (64.2Å) 6.80 (68Å) 6.29 (62.9Å)
Quality 65.03 61.94 62.84
Range 73 – 1200 210 – 1300 150 – 1349
Real space I0 0.00473 0.00401 0.01237
Real space Rg 2.042 2.266 2.026
Reciprocal space I0 0.00473 0.00401 0.01237
Reciprocal space Rg 2.041 2.261 2.026
Dammin (default settings)
Figure 3.11 –SAXS analysis of human Rhodanese. On the panel A, raw SAXS curves recorded in the “apo” form (green) or presence of cysteine (purple) and thiosulfate (blue). Inset, corresponding Kratky plot (with same color code). The panel B, are the fitted curves (parameters in the Table 3.3).
The raw curves of Rhodanese “apo” and with ligands, (Figure 3.11, panel A), confirms that Rhodanese is properly folded presenting a globular shape (also confirmed by the Kratky plot). However, the curves also suggest that the protein adopts different conformations in solution. Rhodanese incubated with thiosulfate seems to have the more compact folding.
analyzed before, the ligand models (Figure 3.12, B and C), show the same conformation. Cysteine assumes a more elongated form and thiosulfate a more compact.
3.5 - Model Building of CBS
The mutation P49L, although not one of the most frequent, can be a source to classical homocystinuria. Crystallization and structure determination of this variant of CBS could help to understand some modifications on the structure by comparison to the wild type structure. The mutation P49L is observed in all chains of CBS (Figure 3.13). This is not surprising since the presence of the mutation was already verified in the gene expression step and activity assays. The construct used for crystallization has 408 amino acids. However, some loop regions are not observed in all six chains.
Comparing the P49L structure reported herein with the previously published structure (Figure 3.14), it can be seen that the PLP moiety does not suffer any changes regarding its binding site. The same is true for the heme moiety. However, the less flexible leucine residue introduced with the mutation seems to alter the loop flexibility making it more rigid.
3.6 - Expression and Purification of SQR
SQR is a membrane protein so it requires different expression and purification methods [79]. As Rhodanese, reported expression protocol in Lybiad et.all [27] was used. The production has begun with 8L from which 56g of cell mass were obtained and then cell lysis done by French press. After the expression, the step of purification started with an affinity exchange column, since the SQR plasmid was built with the presence of a His-Tag. For pursing this purification, it was necessary to stabilize the protein since his membrane-bound proprieties. For that stabilization, was used glycerol and one detergent, in this case, Triton X-100 [80].
Figure 3.15 – Chromatogram of SQR affinity chromatography. Purification conditions were: Flow 2mL/min, 2mL for fraction. Two step gradients at 6% and 30%. Fractions in the green box were collected. Used column with a total volume of 5mL. 50x downscale.
Previous tests of this purification suggested two possible values of binding buffer where SQR elutes, one at 6% (30mM Imidazole) and the other one at 30% (150mM Imidazole) of binding buffer. Two different fractions were collected and the presence of SQR was checked by SDS-PAGE (Appendix 4) and Western Blot (Appendix 5). The fraction of 6% is considered Fraction A and the fraction of 30% is considered Fraction B.
Figure 3.16 – Chromatogram of SQR anionic exchange chromatography. In the left panel the chromatogram of Fraction A and on the right panel the chromatogram of Fraction B. Purification conditions were: Flow 2mL/min, 4mL for fraction. Fractions in the green box were collected. Used column with a total volume of 5mL. In the chromatogram of the right, upscale when gradient start 5x.
Both fractions have revealed similar results, with a little exception on the Fraction B, where are two different peaks. For that reason, all the fractions in the green box were pooled and collected to be analyzed by SDS-PAGE (Appendix 6), and Western Blot (Appendix 7). The fraction on the right is designated as Fraction B1 and the one on the left by Fraction A1. The results show the presence of SQR but with many contaminants. At this stage, already the low yield of SQR can be observed.
So far, all the purification steps were occurring with positive results, all confirmed by the SDS-PAGE and Western blot analyses. The same method proved that the SQR was not totally pure so it was necessary to do another purification step to increase the purity. The third method was a molecular exclusion chromatography.
The fraction collected on the left purification was nominated by Fraction A1A and the one on the right purification is nominated Fraction B1B. Both fractions were analyzed by SDS-PAGE (Appendix 8) and Western Blot (Appendix 9). The results show the presence of SQR but far away from a pure state. In this state, the protocol by Lybiad et.all was already done and the SQR was not pure as the authors reported. Gathering this information, another purification step was required, making another anion exchange chromatography using a ResourceQ. This type of column is more specific than the HiTrap columns used before. This time, only one fraction was purified, the Fraction B1B.
Figure 3.18 – Chromatograms of SQR ResourceQ chromatography. Purification conditions were: Flow 1mL/min,
1mL for fraction. Used column with a total volume of 5mL. Dotted line represent the start of the gradient, that is upscale 5x.
Global result was far from expected. The technique was to use a linear gradient with steps in areas when the reading absorbance had a tendency to increase. The fractions that containing that absorbance increase, were collected and characterized by SDS-PAGE (Appendix 10), and Western Blot (Appendix 11), with some interesting results. Besides the behavior of the chromatogram, that can be explained by an interfering detector, the biophysical methods show the presence of vestigial SQR with a good purity.
membrane-4
–
Conclusions and Future Work
Rhodanese purification resulted in a yield of 2mg of protein per Liter of culture media. This yield allowed us to produce enough protein for the different structural studies and biophysical methods employed in this study. Although we did not manage to get crystals of Rhod, it was possible to understand how the structure can be affected in the presence of certain modulators. Studies of DSF, CD and SAXS show that cysteine, thiosulfate and alliin have different effects on the Rhodanese structure, namely stabilizing or disturbing it. To understand more deeply the behavior of this protein, some additional experience is needed to see with other effectors can modify is function and if it helps to crystal formation.
SQR purification shows a protein very sensitive to conditions variation and, besides some results, far from the ideal. Further studies, like more steps of protein stabilization or without resorting any freezing step, are necessary to understand how the protein can be stabilized. The purification of SQR, if successful, can lead to some biochemical studies and to crystallization trials.
![Figure 1.4 – Human SQR 3D structure modelling using the Swiss-model server [47]. The template has ~19%](https://thumb-eu.123doks.com/thumbv2/123dok_br/16473394.731798/24.918.277.690.515.812/figure-human-structure-modelling-using-swiss-server-template.webp)
![Figure 1.5 – Human Rhodanese 3D structure prediction. Using swiss-model tool [50], the template has 89,53%](https://thumb-eu.123doks.com/thumbv2/123dok_br/16473394.731798/25.918.292.681.492.759/figure-human-rhodanese-structure-prediction-using-swiss-template.webp)