BJRS
RADIATION SCIENCES
05-02 (2017) 01-23Groundwater isotopic variations in a uranium mining
site: subsidies for contamination studies
V. P. de Araújo
1, G.A.N. Sobrinho
2, L. D. Freitas
2, M. R. Franklin
2* 1Instituto de Engenharia Nuclear, Divisão de Engenharia NuclearCEP 21941-906, Rio de Janeiro-RJ, Brazil
2 Instituto de Radioproteção e Dosimetria, Divisão de Radioproteção Ambiental e Ocupacional /
CEP 22783-127, Rio de Janeiro-RJ, Brazil
ABSTRACT
The Caetité Experimental Basin (CEB), located in the semi-arid region of Northeastern Brazil, faces not only the challenges associated with water scarcity but also the potential contamination processes due to mining activity. The only active uranium production center in Brazil (URA) is located in this watershed and the sustainability of mining and milling operations, as well as the survival of the local community, is highly dependent on the availability of groundwater resources. This paper analyzes the stable isotopes variation of Deuterium (2H) and Oxygen-18 (18O) in CEB’s groundwater to investigate its dynamics and mixing of water
sources as part of initial efforts to characterize the hydrogeology of this area for future contamination and recharge studies. Measurements of δ2H, δ18O, total dissolved solids (TDS), pH, and electrical conductivity (EC)
were carried out in water samples from 27 wells. A total of 98 groundwater samples were analyzed during the dry and wet seasons from 2012 to 2014. All the groundwater samples plotted below the local meteoric line toward more enriched δ18O values, an indicative of evaporation process. 2H and 18O data suggests that the main
source of groundwater recharge is local precipitation and there is no mixing of infiltrating rainwater with older groundwater. These results provide evidence that the aquifer system in the CEB has a relatively fast turnover time,which contribute to the vulnerability of the aquifer to contamination. These findings are corroborated by the low TDS and EC values indicative of short time in water-rock interaction.
1. INTRODUCTION
Mining and mineral processing operations have the potential to impact the environment especially when operational best practices are not used [1]. This situation is aggravated in the case of uranium mining where radiological risk is added. Several studies have shown that the groundwater is one of the environmental compartments most threatened of contamination due to mining and milling activities [2, 3, 4, 5, 6, 7]. These impacts are not only limited to water quality, but also to changes in the local hydrogeological pattern, since mining is a large industrial water use. The reduction of the groundwater level caused by over-abstraction has become a frequent problem in mining areas mainly in (semi-) arid regions where surface water is not abundant, and the water supplies must be obtained from groundwater [8].
The Caetité Experimental Basin (CEB) located in Bahia, a state in the northeastern region of Brazil, faces this problem since 2000 when the Uranium Concentrated Unity (URA) started its operation. The URA, operated by the Nuclear Industries of Brazil (INB), is the only uranium mining and milling facility in activity in Brazil and it was set up to run for 16 years [9].
There is an increasing debate over competing water interests between the local community and the mine operator, due to either water scarcity or radiological contamination risks.
Due to the semi-arid climatic conditions, the rivers are not perennial, and the local population is highly dependent on groundwater, which is provided by a hard rock aquifer (HRA) [10]. In this type of aquifer, the occurrence and pattern of water rely on the existence and degree of fracturing, as the water is stored and transmitted through crevices, joints and fractures [11, 12, 13]. Groundwater flow and storage in this area have always been a major issue due to its abundant heterogeneity and anisotropy, with an irregular distribution of groundwater pathways.
Studies of groundwater dynamics in HRA are very challenging because the classical extrapolations of local transmissivity values (obtained for example by pumping tests) are not suitable, since permeability may vary considerably from a place to another according to the width of fractures, their density, their spatial distribution and their degree of interconnection [11]. However, these studies are paramount, due to the increasing need of water to supply in urban centers and rural areas, especially in Brazil case, where the crystalline terrains that constitute the HRA constitute an area of about 4.6 million km2, corresponding to 53.8 % of the national territory [14].
Although the understanding of water dynamics is the main requirement for assessing recharge and pollution risks, there is still insufficient knowledge on these basic characteristics in CEB. Most of the studies in this area have focused mainly on safety analysis conducted by the operator of the
nuclear installation [15, 16, 10] or on radiological characterization and environmental impact assessment from the mining and milling activities [17, 18].
In this context, isotope techniques are effective tools for hydrological evaluation. Stable and radioactive environmental isotopes have been used for more than four decades to study hydrological systems and it has been proved that they are particularly useful for understanding groundwater dynamics [19, 20]. These tools have been applied to identify sources and mechanisms of groundwater recharge [21, 22, 23, 24], and interactions between surface and groundwater [25, 26]. The most widely used isotopes in hydrogeochemistry are the stable isotopes deuterium (2H) and oxygen-18 (18O), ideal for tracing water movement as they are components of the water molecule itself [27, 28]. Especially under the arid and semi-arid conditions, isotope techniques constitute the best approach for identification of groundwater recharge, as well as to trace the pathways and identify the source and fate of pollutants in contamination studies [29, 30, 31].
Due to lack of information about the dynamics of water on this watershed and the complexity of evaluating the water flow in fractured aquifers this study aims to analyze the variation of 2H and 18O to isotopically characterize groundwater to gain insight on its flow regime and in this way support the water management at the CEB.
This study will contribute to establish foundational data for future water supply assessment, and contaminant studies at the CEB. Such information is crucial to understand the source of pollutants, assess their scale and migration, and to plan remediation if necessary.
2. STUDY AREA
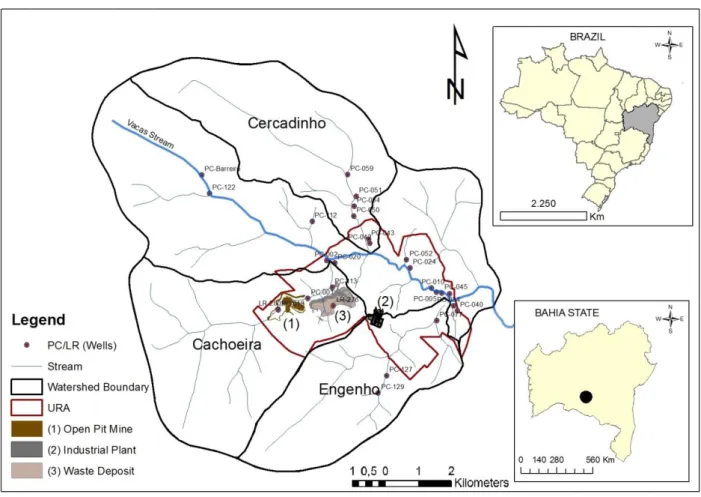
The Caetité Experimental Basin (CEB) was defined taking into account the potential sources of pollutants from the nuclear installation (Fig. 1). The Uranium Concentrate Unity (URA) is located in the center-southwestern region of Bahia state (13o56’36”S and 42o15’32”W), 40 km from the municipality of Caetité. The area of the CEB (c.a. 75 km2) is drained by the Vacas stream, which belongs to the Fundo stream basin, one of the tributaries of Contas River, which is one of the main hydrographic basins in the state of Bahia. For the purpose of this paper, the CEB is composed by the Vacas stream and three sub-basins: Cachoeira, Cercadinho, and Engenho (Fig. 1).
Figure 1: Location of the Caetíté Experimental Basin (CEB), with a highlight on the groundwater sampling points and the main source terms of the installation (open-pit mine, waste deposit, and the industrial plant).
The climate is classified as semiarid tropical (Bsh) with an average annual rainfall of 800 millimeters. The monthly average maximum of 131 mm occurring in summer (November-January), while in winter (June-August) the rainfall rate is few millimeters. The annual average temperature at CEB is 20oC, with average July and November temperatures of 16.7oC and 22.3oC, respectively. The estimated potential evapotranspiration ranges from 44.6 to 103.3 mm, and during the dry season (March-October) it is higher than the rainfall rate [32].
The surface drainage channels are tectonic fault controlled, and the creeks are ephemeral existing only for a short period following the precipitation.
The main economic activities of the local community at CEB comprise livestock and subsistence farming, highly dependent on to water resources.
The hydrogeologic setting of the study area comprises the Lagoa Real Complex (LRC) constituted by 1.7 Ga granitoids that occur along the Paramirim valley, formed by the São Timóteo Granite and a set of alkali-gneisses that were crystallized during a compressional sin-metamorphic deformation episode. The geology of the region has been investigated in detail in previous studies [17, 33, 34,
35]. The uranium mineralization is associated with albites (NaAlSi8O8) that are enclosed in the
gneisses and granites of the LRC. Thirty-eight anomalies were identified in an area of about 1200km2, but only one is being explored by INB [10].
It is estimated that approximately 200 families live in the CEB, and groundwater is used by the population not only for human consumption (including drinking water, cooking, and bathing) but also for animal watering and crop irrigation.
The main aquifer system mapped in the CEB is located in the central portion of the Vacas stream associated with intrusion of a diabase dike. This fractured and semi-confined aquifer is the primary source of water supply, and its exploitation is carried out intensively to provide water to the facility (URA) and the local population [10].
To face the water scarcity, the mine operator constructed dams and small reservoirs dug in riverbeds, and drilled the majority of the wells in the CEB. These wells are used for industrial (or monitoring) purposes or human consumption or both depending on the location, productivity, and water quality. Not all wells are under pumping regime, and some of them are dry since opening or are being depleted probably due to water abstraction. For that reason, only 27 boreholes divided in shallow wells (from 15 to 36 m) and deep wells (from 40 to 90 m) were considered for this study.
3. MATERIALS AND METHODS
3.1. Sampling and analytical methods
A total of 102 groundwater samples from 27 wells were collected from 2012 to 2014 distributed in 5 field campaigns covering dry seasons (July 2012, June 2013, and September 2014), and wet seasons (December 2012 and November 2013). In order to compare the seasonal effects on the isotopic composition, samples were collected whenever possible in the same locations for all campaigns.
The collection procedure included purging until pH, EC and temperature of the discharge water are observed to stabilize, followed by on-site water filtering using 0.45 µm filter, and storage in PTFE bottles. After collection, the samples were protected from sunlight and stored under cool conditions before their chemical and isotopic analyses. The field parameters pH and Electrical Conductivity (EC) were measured in situ using an MANTA2 EUREKA multiprobe.
The methods used in this study for obtaining field parameters and water sampling, followed the standard protocols from the International Atomic Energy Agency - IAEA [36].
Total dissolved solids (TDS) were calculated using Aquachem software (Waterloo Hydrogeologic Inc.).
3.2. Isotopic Measurements
The stable isotopes analyses were performed at the IAEA Isotope Hydrology Laboratory in Vienna, with an accuracy of 1 ‰ for δ2H and 0.1‰ for δ18O using the Liquid Water Isotope Analyzer (LWIA).
The results of the 18-oxygen and deuterium were expressed as a relative difference between the isotopic ratios (18O/16O or 2H/1H) of the sample and the isotopic ratios of the Vienna Standard Mean
Ocean Water (V-SMOW) as defined below:
Standard Standard R R R
Rsam ple sam ple
(eq.1)
Where R is the abundance ratio of the isotopic species (i.e., 2H/1H or 18O/16O), and the values are represented by δ18O and δ2H respectively. Since δ is usually a small number, it is given in ‰ (per mil) [27].
The results of δ2H and δ18O were analyzed through a diagram plotting δ2H versus δ18O relative to the V-SMOW.
The relation between 18O and 2H in precipitation is usually described by the Global Meteoric
Water Line (GMWL) developed by Craig [37] and defined as: 2H =818O + 10 (eq. 2)
Later, this relation (eq. 2) was updated using data from 219 stations from Global Network of Isotopes in Precipitation (GNIP) [38]:
2H =8.218O + 11.27 (eq. 3)
This updated GMWL equation (eq.3) was used in this study as a baseline to compare the isotopic composition of groundwater.
The linear coefficient, which is called “deuterium excess” (d), was used to assess the non-equilibrium conditions during the evaporation.
The GMWL is an average of many local or regional water lines that differ from the global line as a result of climatic and geographic factors, thus for local investigation, it is important to compare samples data with a Local Meteoric Water Line (LMWL). Factors as the origin of the vapor mass, secondary evaporation during rainfall and seasonality of precipitation can affect both slope and deuterium interception and produce different LMWL at different locations [27].
The LMWL of the study area was built based on the Brasilia GNIP monitoring station (BMWL), with 98 samples, monitored from 1965 to 1987 [39] since we do not have isotopes measured in CEB precipitation. The Brasilia station is located at 652 Km from Caetité under similar climatic conditions.
3.3. Statistical analyses
Student’s t-test and nonparametric Mann–Whitney Rank Sum tests [40] were performed to test the significance of the difference between mean values of the parameters δ18O, δ2H, EC and TDS for seasonality and well depth, and to test differences between sub-basins. The sub-basins were paired as follows for the statistical testing: Cachoeira vs Cercadinho (CCe), Cachoeira vs Vacas (CV), Cachoeira vs Engenho (CE), Cercadinho vs Vacas (CeV), Cercadinho vs Engenho (CeE), and Engenho vs Vacas (EV). The data was split into dry and wet season sub-sets for the statistical analysis.
Since parametric tests only apply to samples with normal data distribution, normality tests were first performed to determine whether parametric or non-parametric tests should be used. The normality assumption was verified for all dataset using Kolmogorov-Smirnov or Shapiro-Wilk tests [41]. For all tests a 95% confidence interval and a threshold of p < 0.05 was used to define statistical significance. All statistical analyses were performed using SPSS 20.0.
Only the wells that had samples collected in both periods (wet and dry) were considered.
4. RESULTS AND DISCUSSION
4.1. Physicochemical parameters
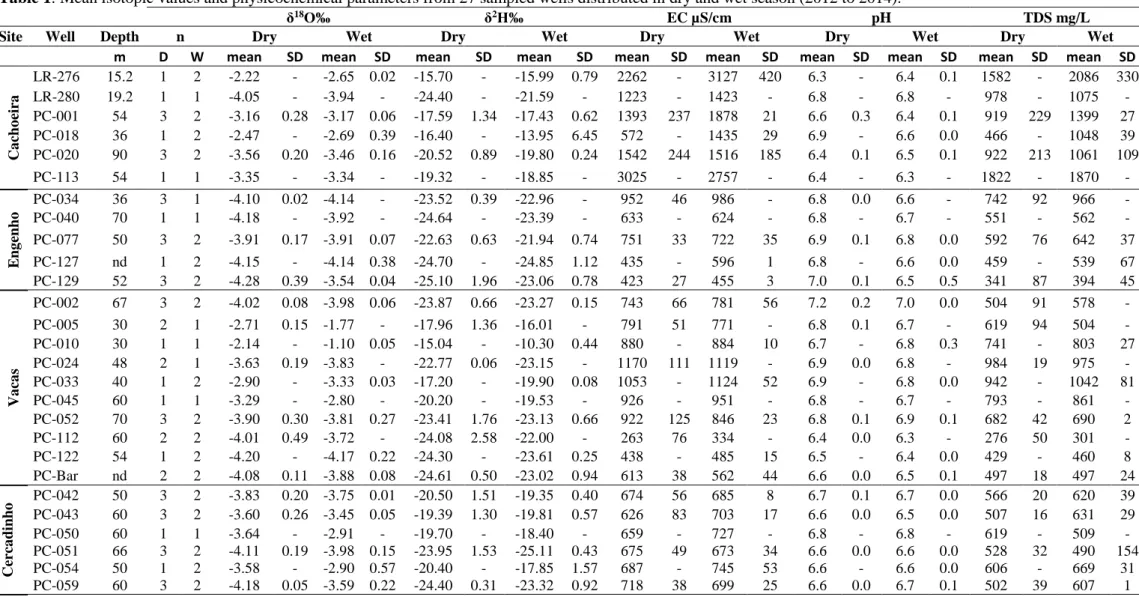
The statistical summary of physicochemical and isotopic data is presented in Table 1.
Groundwater in the study area is slightly acidic to alkaline with pH ranging from 6.0 to 7.4, with a median value of 6.65. In the absence of iron sulfide minerals, the pH values in groundwater vary between 6.5 and 8.0 and more rarely between 5.5 and 8.5 [42]. No specific trend in pH values was observed within the CEB or in each sub-basin.
The total dissolved solids (TDS) concentration in the study area ranges from 186 to 2415 mg/L with a median value of 607. Most of the samples (85%) fall under a fresh type of water (TDS <1000 mg/L) based on groundwater categorization proposed by Freeze and Cherry [43]. As a general
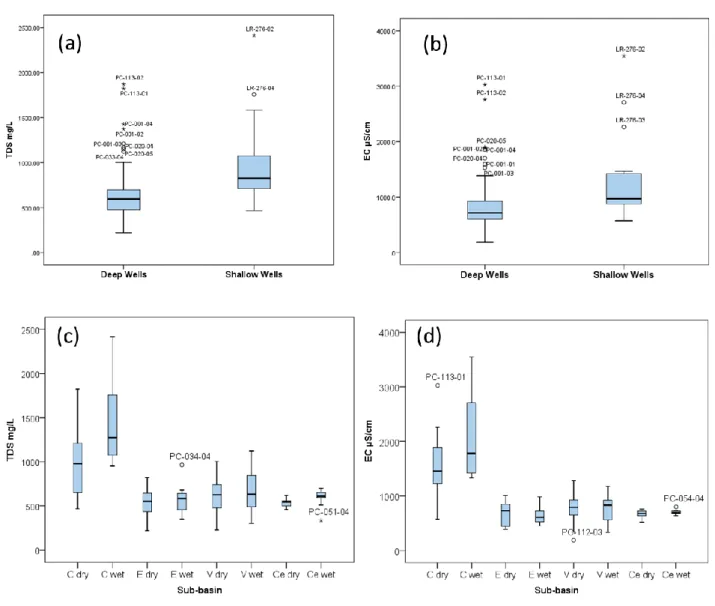
trend, the highest values were found near the surface. The median TDS values in the shallow well (depth up to 36 m) was significantly higher than the deeper wells (825 vs. 594 mg/L, U = 1145.50, p=0.002). Statistically significant differences were also observed between wet and dry seasons (651 vs. 558, Z= -3.42, p= 0.001). The distribution of TDS data can be observed in Fig. 2.
Figure 2: Box plot showing TDS and EC values for the deep and shallow wells (a, b); and for dry and wet seasons(c, d). The boxes represent the interquartile range, with the black line across each box indicating the median value.
Several hydrochemical processes can change the dissolved solids concentration in groundwater
including the movement of water through the pores or fractures in rocks, evapo-concentration processes and anthropic contamination [44, 45]. The highest TDS values found in some wells of CEB, and considered as outliers in the boxplot of Fig.2a, could be related to the evaporation of
rainwater in the infiltration process through the unsaturated zone (PC-020), percolation of
groundwater across mineralized zones (PC-001) or even associated with contamination events from uranium mine (LR-276 and PC-113).
The relatively low TDS values found in CEB suggest a short residence time of the groundwater in contact with the granitic and gneissic rocks that form the aquifer. Similar situation was found in alluvial aquifer of the Modder River catchment in Southern Africa located in a semi-arid area, where the high hydraulic conductivity associated with the non-saline aquifer materials (gravel-sand) led to a groundwater with low concentration of dissolved solids [46].
The groundwater samples showed a low to high ion content, with EC ranging from 157 and 3546 μS/cm with a median value of 730 μS/cm. Based on the electrical conductance classification propose by Sarma and Swamy [47], most of the groundwater in CEB (83%) shows medium conductivity with samples related to the type I (EC 500-1000 μS/cm – 59%) and type II (EC 1000-3000 μS/cm – 24%).
The good correlation (r2= 0.95) between the TDS and EC was expected due the low concentration of salts in the groundwater of the study area (Tab.1), making this relationship straightforward [48].The differences seen in the median value of EC between dry and wet seasons were statistically significant (731 vs. 742 μS/cm, Z= -2.19, p= 0.029), as observed for the TDS parameter.
The highest values for both TDS and EC were found at Cachoeira sub-basin ranging from 466 to 2415 mg/L and from 572 to 3546 µS/cm, respectively, reflecting processes of weathering associated with the mineralized zones in fractured terrain and the impact of the mining activities (Fig. 2c and 2d).
The high values of TDS and EC found in the deepest well of the study area (PC-020) suggest that the fracture system may be playing an important role in the mixing of surface and underground waters (Fig. 2a). The PC-20 with 90 m depth and 2 mapped fractures, is placed in gneiss of the Cachoeira sub-basin.
Love et al [49] in their studies in a fractured aquifer at Clare Valley, Australia, observed step-like changes in EC between 300–1500 µS/cm occurring over vertical distances of only 1–3 meters, and concluded that these represent locations of major groundwater inflow to the bore via fractures.
Table 1: Mean isotopic values and physicochemical parameters from 27 sampled wells distributed in dry and wet season (2012 to 2014).
δ18O‰ δ2H‰ EC µS/cm pH TDS mg/L
Site Well Depth n Dry Wet Dry Wet Dry Wet Dry Wet Dry Wet
m D W mean SD mean SD mean SD mean SD mean SD mean SD mean SD mean SD mean SD mean SD
Ca cho eira LR-276 15.2 1 2 -2.22 - -2.65 0.02 -15.70 - -15.99 0.79 2262 - 3127 420 6.3 - 6.4 0.1 1582 - 2086 330 LR-280 19.2 1 1 -4.05 - -3.94 - -24.40 - -21.59 - 1223 - 1423 - 6.8 - 6.8 - 978 - 1075 - PC-001 54 3 2 -3.16 0.28 -3.17 0.06 -17.59 1.34 -17.43 0.62 1393 237 1878 21 6.6 0.3 6.4 0.1 919 229 1399 27 PC-018 36 1 2 -2.47 - -2.69 0.39 -16.40 - -13.95 6.45 572 - 1435 29 6.9 - 6.6 0.0 466 - 1048 39 PC-020 90 3 2 -3.56 0.20 -3.46 0.16 -20.52 0.89 -19.80 0.24 1542 244 1516 185 6.4 0.1 6.5 0.1 922 213 1061 109 PC-113 54 1 1 -3.35 - -3.34 - -19.32 - -18.85 - 3025 - 2757 - 6.4 - 6.3 - 1822 - 1870 - E ng enho PC-034 36 3 1 -4.10 0.02 -4.14 - -23.52 0.39 -22.96 - 952 46 986 - 6.8 0.0 6.6 - 742 92 966 - PC-040 70 1 1 -4.18 - -3.92 - -24.64 - -23.39 - 633 - 624 - 6.8 - 6.7 - 551 - 562 - PC-077 50 3 2 -3.91 0.17 -3.91 0.07 -22.63 0.63 -21.94 0.74 751 33 722 35 6.9 0.1 6.8 0.0 592 76 642 37 PC-127 nd 1 2 -4.15 - -4.14 0.38 -24.70 - -24.85 1.12 435 - 596 1 6.8 - 6.6 0.0 459 - 539 67 PC-129 52 3 2 -4.28 0.39 -3.54 0.04 -25.10 1.96 -23.06 0.78 423 27 455 3 7.0 0.1 6.5 0.5 341 87 394 45 Va ca s PC-002 67 3 2 -4.02 0.08 -3.98 0.06 -23.87 0.66 -23.27 0.15 743 66 781 56 7.2 0.2 7.0 0.0 504 91 578 - PC-005 30 2 1 -2.71 0.15 -1.77 - -17.96 1.36 -16.01 - 791 51 771 - 6.8 0.1 6.7 - 619 94 504 - PC-010 30 1 1 -2.14 - -1.10 0.05 -15.04 - -10.30 0.44 880 - 884 10 6.7 - 6.8 0.3 741 - 803 27 PC-024 48 2 1 -3.63 0.19 -3.83 - -22.77 0.06 -23.15 - 1170 111 1119 - 6.9 0.0 6.8 - 984 19 975 - PC-033 40 1 2 -2.90 - -3.33 0.03 -17.20 - -19.90 0.08 1053 - 1124 52 6.9 - 6.8 0.0 942 - 1042 81 PC-045 60 1 1 -3.29 - -2.80 - -20.20 - -19.53 - 926 - 951 - 6.8 - 6.7 - 793 - 861 - PC-052 70 3 2 -3.90 0.30 -3.81 0.27 -23.41 1.76 -23.13 0.66 922 125 846 23 6.8 0.1 6.9 0.1 682 42 690 2 PC-112 60 2 2 -4.01 0.49 -3.72 - -24.08 2.58 -22.00 - 263 76 334 - 6.4 0.0 6.3 - 276 50 301 - PC-122 54 1 2 -4.20 - -4.17 0.22 -24.30 - -23.61 0.25 438 - 485 15 6.5 - 6.4 0.0 429 - 460 8 PC-Bar nd 2 2 -4.08 0.11 -3.88 0.08 -24.61 0.50 -23.02 0.94 613 38 562 44 6.6 0.0 6.5 0.1 497 18 497 24 Cer ca din ho PC-042 50 3 2 -3.83 0.20 -3.75 0.01 -20.50 1.51 -19.35 0.40 674 56 685 8 6.7 0.1 6.7 0.0 566 20 620 39 PC-043 60 3 2 -3.60 0.26 -3.45 0.05 -19.39 1.30 -19.81 0.57 626 83 703 17 6.6 0.0 6.5 0.0 507 16 631 29 PC-050 60 1 1 -3.64 - -2.91 - -19.70 - -18.40 - 659 - 727 - 6.8 - 6.8 - 619 - 509 - PC-051 66 3 2 -4.11 0.19 -3.98 0.15 -23.95 1.53 -25.11 0.43 675 49 673 34 6.6 0.0 6.6 0.0 528 32 490 154 PC-054 50 1 2 -3.58 - -2.90 0.57 -20.40 - -17.85 1.57 687 - 745 53 6.6 - 6.6 0.0 606 - 669 31 PC-059 60 3 2 -4.18 0.05 -3.59 0.22 -24.40 0.31 -23.32 0.92 718 38 699 25 6.6 0.0 6.7 0.1 502 39 607 1
4.2. Isotopes in Groundwater
The 18O and 2H composition in groundwater samples ranged from -4.69‰ to -1.04‰ and from -27.65‰ to -7.50‰ (Fig.3a and 3b) with mean values of -21.23‰ and -3.59‰, respectively. The most enriched isotopic values were found at Vacas sub-basin in two shallow wells (both with 30 m): PC-010 (-1.04‰ for δ18O and -10.74 ‰ for δ2H) and PC-005 (-1.77‰ for δ18O and -16.01‰ for δ2H). Such enriched values can
be related to the infiltration of evaporated water from the surface since these wells are under influence of the INB water dam, but also to the evaporative enrichment during the infiltration of rainwater by the unsaturated zone.
The importance of the unsaturated zone in changing the groundwater isotope composition can be observed in enriched values found in shallower wells (15.2 to 36 m) when compared to deeper wells. The shallow wells values ranged from -4.14‰ to -1.04‰ for δ18O and from -24.40‰ to -7.50‰ for δ 2H. While in deep wells, these values ranged from -4.69‰ to -2.33‰ and from -27.65‰ to -16.28‰ for δ 18O and δ 2H,
respectively (Fig. 3a and 3b). Statistical tests showed that the median values for δ 18O and δ 2H were
significantly higher in shallow wells than in deep wells (-2.65 vs. -3.81‰, U = 1111.5, p=0.002 for δ18O and -16.69 vs. -22.47‰, U=1139.0, p=0.001 for δ 2H). However, the shallow well LR280 (19.2 m) located at
Cachoeira sub-basin showed depleted mean values for 18O and 2H (-4.00‰ and -22.98‰), close to the weighted average Brasília rainfall (-4.27‰ and -24.27‰). Although several studies have highlighted the influence of unsaturated zone on the isotope enrichment by evaporation of the infiltrating water during the recharge process[50, 51,52,53], the higher isotopic values found in most deep wells and at LR280, is probably due to a faster infiltration by preferential paths (macropores or fractures). Thereby the short
residence time in the unsaturated zone causes the water be poorly or no evaporated, thus the rainfall isotopic signature is preserved in these wells.
In agreement with others studies in arid and semi-arid regions [54, 55, 56], seasonal fluctuations were observed in stable isotope values. The samples collected in dry season ranged from –4.69‰ to –2.14 for δ18O and from–27.65‰ to –15.04‰ for δ2H, while in the wet season, these values ranged from –4.52‰ to – 1.04 for δ18O and from –25.97‰ to –7.50‰ for δ2H. Paired tests for wells indicated that the median values for δ 18O and δ 2H were significantly different (-3.84 vs. -3.58‰, Z = -2.64, p=0.008 for δ18O) and (-22.50
vs. -21.20‰, Z=-3.17, p=0.002 for δ 2H) for dry and wet season.
Although we expected higher isotopic values in dry season, the results which were more enriched found in the wet season can be related to the long transit time of the infiltration water by loamy soils creating a time lag until this water reaches the aquifer and produces changes in the isotopic composition of the groundwater. Another possible explanation would be the mixing of more evaporated waters (longer residence time) with fresh rainwater in the unsaturated zone, which during the rainy season could be carried to the aquifer.
The isotope composition of groundwater for sub-basin collected in dry and wet season are illustrated in the Figures 3c and 3d. As a general trend, the Cachoeira sub-basin showed the highest isotope contents.
As seasonality has a great influence on the isotopic composition of the groundwater, the sub-basins were analyzed in dry and wet seasons separately. Two pairs showed distinct behavior in dry and wet season in relation to δ18O mean values: Cercadinho vs.Cachoeira (they showed different mean values in the dry season but in the wet season the mean values were statistically similar) and Cercadinho vs. Engenho (similar mean values in the dry season and different mean values in the wet season). In relation to δ2H, another two pairs presented different behavior: Vacas vs.Cachoeira (The median values were different in the dry season and similar in the wet season) and Vacas vs. Engenho (similar mean values in the dry season but different in the wet season). The results of the statistical tests are presented in Table 2.
Figure 3: Box plots showing δ18O and δ2H values for Deep and Shallow wells (a,b) and samples collected in dry and wet period (c, d) at Cachoeira (C), Engenho (E), Cercadinho (Ce) and Vacas (V) sub-basin.
Table 2: Statistical results from comparison between sub-basins in dry and wet season
Dry season Wet season
Sub-basin t p n t or U p n Cachoeira vs. Cercadinho 3.64 0.001 24 1.658 0.114 21 Cachoeira vs. Vacas 1.61 0.120 28 5.850* 0.16 28 Cachoeira vs. Engenho 4.43c 0.001 21 3.909 0.001 18 Cercadinho vs. Vacas -1.52 0.141 32 -0.617 0.544 27 Cercadinho vs. Engenho 1.897 0.070 25 2.132 0.048 19 Engenho vs. Vacas -2.81 0.009 29 -2.146 0.044 24 Cachoeira vs. Cercadinho 2.55 0.018 24 2.600 0.040 21 Cachoeira vs. Vacas 2.51 0.019 28 36* 0.107 28 Cachoeira vs. Engenho 5.12c <0.001 21 3.882 0.001 18 Cercadinho vs. Vacas 0.288 0.776 32 -0.255 0.801 27 Cercadinho vs. Engenho 2.48 0.021 25 2.138 0.047 19 Engenho vs. Vacas -2.05 0.051 29 -2.290 0.033 24
* U – Mann-Whitney test. In bold, the pairs that showed distinct behavior in wet and dry season
Figure 4 shows the comparison made between the data obtained for δ2H and δ18O in the groundwater samples with the global (GMWL) and local (BMWL) meteoric lines. This figure includes all the data obtained considering the two seasons (dry and wet). Despite the wide range in the isotopic data, it was not possible to identify clusters.
The relationship of the δ2H and δ18O contents in precipitation depends on the history of the air masses [37]. In our case, the BMWL (δ 2H =7.94 δ 18O + 12.67) was plotted above the GMWL (δ 2H = 8.2 δ 18O + 11.27),
reflecting the evaporation of the local meteoric waters producing water vapor depleted in isotopes, which could condense before reequilibrating with atmosphere and produce a depleted rainfall [38, 57]. These precipitations originate a meteoric line with a linear coefficient (deuterium excess) higher than the GMWL [58] as observed in our study case.
Figure 4: Plot of 2H versus 18O showing the LEL of groundwater, compared to the BMWL and GMWL.
All the groundwater samples plotted below the BMWL and only few samples are situated slightly above the GMWL indicating an isotopic signature near to rainfall. The samples that plotted below the GMWL are clearly evaporated and presents a gradual enrichment in δ2H and δ18O, providing a local evaporation line (LEL) with a slope lower than the GMWL (Fig.4). The decrease in the LEL slope can be explained by the isotopic enrichment that occurs during the process of evaporation [59, 60]. This is due to the differences in the vapor pressure between 2H1H16O, 1H218O and 1H216O, leading to kinetic and thermodynamic isotopic
fractionation, which could change the relationship between δ2H and δ18O values in the remaining water and in the vapor phase [27, 37].
The groundwater evaporation line for CEB was defined as δ2H = 4.79δ18O – 4.02 (r² = 0.825) (Fig.4), and it
is in good agreement with the typical LEL slope (ranging between 4 and 7) for groundwater, depending on local atmospheric conditions [60]. This behavior would be expected due to the high potential evapotranspiration (920 mm per year) found in the CEB, low relative humidity, and slow infiltration rates through the unsaturated zone.
The less evaporated samples presented isotopic composition close to the weighted average of Brasília precipitation (4.62‰ δ18O and 23.95‰ δ2H), with the isotope data evolving along of the LEL as the water
became more evaporated (Fig.4). This behavior suggests that the main source of groundwater recharge (before evaporation) is the local precipitation and the evaporation seems to be a major mechanism in
changing the groundwater isotopic composition. These findings indicate that there is no mixing of infiltrating rainwater with older groundwater, suggesting that the aquifer system in the CEB has a relatively fast turnover time. These results are in accordance with the TDS and EC data: a low mineralization in most samples is probably due to a short residence time of water (implying in a short time of water-rock interaction), indicating a fast recharge mechanism. Although a fast recharge is desirable in places where water resources are widely exploited, on the other hand, the vulnerability of the aquifer to contamination is related to how long it takes to groundwater be recharged. This dynamic flow system associated with a preferential flow through fractures increases the rate at which contaminants could move to deeper groundwater, consequently increasing the aquifer vulnerability to contamination.
6. CONCLUSIONS
Pollution of aquifers by anthropogenic contaminants and water abstraction are the great concern in management of water resources at mining sites, especially in semi-arid regions. Environmental isotopes can be an important tool used to estimate water balance and to trace the pathways of pollutants in aquifers and predict their spatial distribution and temporal changes.
The present study examined variations in groundwater isotopic composition in the Caetité Experimental Basin, in order to have insights on the water dynamics in a uranium mining site.
All the parameters studied (18O, δ2H, EC and TDS) exhibit seasonal effects in most of samples, but unlikely expected, the highest values are obtained in samples collected during the wet season. It is probably related to the rainfall percolation through the unsaturated zone by a piston-flow carrying the soil water more evaporated, thereby increasing the parameters values.
The higher values for physicochemical and isotopes data observed in shallow wells are more influenced by the processes occurring in the unsaturated zone, while in deep wells, the preferential flow through macropores or fractures seems to be the principal factor contributing to recharge.
A general trend of higher values for all parameters is observed in the Cachoeira sub-basin. However, the highest isotopic values are found in two wells located at Vacas sub-basin. The contribution from surface water cannot be discarded in this case, as these wells (PC010 and PC005) are located close to a water dam. These punctual values suggest that some mixing with this evaporated surface water probably occurred. The groundwater evaporation line intercepts the GMWL close to the value of the weighted average Brasília rainfall, reflecting a meteoric origin, with the evaporation being the key process in modifying the isotopic composition of these waters.
These results provide evidence that the main source of groundwater recharge is recent precipitation without mixing of infiltrating rainwater with older groundwater. These findings are in agreement with the low TDS values, which indicate a short time of water-rock interaction.
Finally, the physicochemical and Isotope results point to a fast turnover of this system, which causes this aquifer more vulnerable to contamination from activities in the land surface, as the contaminants could move and quickly reach the aquifer.
The combination of physicochemical data and isotope techniques showed to be an useful tool to provide key information on these water resources, as well providing broader insights into aquifer characteristics and hydrological processes.
7.
ACKNOWLEDGEMENTS
We thank the International Atomic Energy Agency (IAEA) for the financial support.
This research was developed as part of the technical cooperation project "Sustainable Water Resources Management in a Uranium Production Site - BRA7010", between the IAEA, the Institute of Radiation Protection and Dosimetry (IRD/CNEN), the Nuclear Engineering Institute (IEN/CNEN), and the Federal University of Rio de Janeiro (UFRJ).
REFERENCES
1. IAEA - International Atomic Energy Agency. Best Practice in Environmental Management of
Uranium Mining. IAEA Nuclear Energy Series NF-T-1.2 STI/PUB/1406 (ISBN:978-92-0-105909-3), 2010.
2. DONTALA, S.P.; REDDY, T.B., VADDE, R. Environmental aspects and impacts its mitigation measures of corporate coal mining. Procedia Earth and Planetary Science, 11, p. 2-7, 2015.
3. CURRELL, A.; WERNER A.; MCGRATH C.; WEBB J.A.; BERKMAN, M. Problems with the application of hydrogeological science to regulation of Australian mining projects: Carmichael Mine and Doongmabulla Springs. Journal of Hydrology, 548, p. 674–682, 2017.
4. GAJOWIEC, B., WITKOWSKI, A. Impact of lead/zinc ore mining on groundwater quality in Trzebionka mine (southern Poland). Mine Water and the Environment, volume 12, issue 1, p. 1-9, 1993. doi:10.1007/BF02914793
5. NEWMAN, C.; AGIOUTANTIS, Z.; LEON, G. B. J. Assessment of potential impacts to surface and subsurface water bodies due to longwall mining. International Journal of Mining Science and
6. RAPANTOVA, N.; LICBINSKA, M.; BABKA, O.; GRMELA A.; POSPISIL, P. Impact of uranium mines closure and abandonment on groundwater quality. Environ. Sci. Pollut. Res. 20, p. 7590–760, 2013.
7. RAZO, I.; CARRIZALES, L. DIAZ-BARRIGA, F.; MONROY. Arsenic and Heavy Metal Pollution of Soil, Water, and Sediments in a Semi-Arid Climate Mining Area in Mexico. Water, Air. Soil Pollut. 152 (1-4), 129-152, 2004.
8. APAYDIN, A. Dual impact on the groundwater aquifer in the Kazan Plain (Ankara, Turkey): sand– gravel mining and over-abstraction. Environ. Earth Sci., 65: p. 241-255, 2012.
9. GOMIERO, L.A.; MATOS, E.C.; RODRIGUEZ, P.C. Produção de Concentrado de Urânio em Caetité e BA. In: XX ENTMME e Encontro Nacional de Tratamento de Minérios e Metalurgia
Extrativa, p. 399-406, V 2, Florianópolis, 2004. In Portuguese.
10. INB - Indústrias Nucleares do Brasil SA. Safety Analysis Report (RFAS): Water Management. Internal Report. General Management of Mineral Engineering, Management of Environment and Quality, Caetité, BA, 2007. In Portuguese.
11. COOK, P.G. A guide to regional groundwater flow in fractured rock aquifers. CSIRO Land and Water, Clayton South, Australia, 2003.
12. DEWANDEL, B.; LACHASSAGNE, P.; ZAIDI, F.K.; CHANDRA, S. A conceptual hydrodynamic model of a geological discontinuity in hard rock aquifers: example of a quartz reef in granitic terrain in South India. Journal of Hydrology, 405, p. 474–487, 2011.
13. GUIHÉNEUF, N.; BOISSON, A.; BOUR, O.; DEWANDEL, B.; PERRIN, J.; DAUSSE, A.; VIOSSANGES, M.; CHANDRA, S.; AHMED, S.; MARÉCHAL, J. C. Groundwater flows in weathered crystalline rocks: Impact of piezometric variations and depth-dependent fracture connectivity. Journal of
Hydrology, 511, p. 320-334, 2014.
14. ABAS – Associação Brasileira de Águas Subterrâneas. Groundwater, what are they? Available at: <http://www.abas.org/educacao. php>. Last accessed: 10 April, 2017. In Portuguese.
15. MATOS, E.C. Sustainability of mining activities in the semi-arid of Serra Geral, at Bahia state.- The example of Lagoa Real / Caetité. In: I Seminar on Environmental Sustainability of Mining. Annals of I SSAM, Salvador, Bahia, p.49, 2003. In Portuguese.
16. MATOS, E.C., SILVA, J.R.A. AND RUBINI, L.A. Lagoa Real Uraniferous Province - Assurance of uranium concentrate supply (DUA) for brazilian needs. In: XX Geological Symposium of the Northeast, Fortaleza, Annals of XX SGN, 2003. In Portuguese.
17. CARVALHO, I.G.; CIDU, R.; FANFANI, L.; PITSCH, H.; BEAUCAIRE, C.; ZUDDAS, P. Environmental impact of uranium mining and ore processing in the Lagoa Real district, Bahia, Brazil.
Environ. Sci. Technol., 39, p. 8646-8652, 2005.
18. FERNANDES, H.M., GOMIEIRO, L.A.; PERES,V.; FRANKLIN, M.R; LAMEGO, F. Critical analysis of the waste management performance of two uranium production units in Brazil- part II: Caetité production center. Journal of Environmental Radioactivity, 88, p. 140-157, 2006.
19. DEMLIE, M.; WOHNLICH, S.; AYENEW, T. Major ion hydrochemistry and environmental isotope signatures as a tool in assessing groundwater occurrence and its dynamics in a fractured volcanic aquifer system located within a heavily urbanized catchment, central Ethiopia. Journal of Hydrology, 353, 1-2, p.175-188, 2008.
20. MADIOUNE, D. H.; FAYE, S.; ORBAN, P.; BROUYÈRE, S.; DASSARGUES, A.; MUDRY, J.; STUMPP, C.; MALOSZEWSKI, P. Application of isotopic tracers as a tool for understanding hydrodynamic behavior of the highly exploited Diass aquifer system (Senegal). Journal of Hydrology, 511, p.443-459, 2014.
21. PAYNE, B. The use of stable isotope tracers for the estimation of the direction of groundwater flow. Journal of Hydrology, 112, p. 395-401, 1990.
22. KRABBENHOFT, D.P., BOWSER, C.J., ANDERSON, M.P., VALLEY, J.W. Estimating groundwater exchange with lakes: the stable isotope mass balance method. Water Resour. Res., 26, p. 2445–2453,1990.
23. NÉGREL, P. Hydrogeochemical processes, mixing and isotope tracing in hard rock aquifers and surface waters from the Subarnarekha river basin, (east Singhbhum district, Jharkhand state India). Hydrogeology Journal, 15, p. 1535-1552, 2007.
24. NÉGREL, P., MILLOT, R., GUERROT, C., PETELET-GIRAUD, E., BRENOT, A., MALCUIT, E. Heterogeneities and interconnections in groundwaters: Coupled B, Li and stable-isotope variations in a large aquifer system (Eocene Sand aquifer, Southwestern France). Chemical Geology, 296-297, p. 83–95, 2012.
25. LIU, Y.; YAMANAKA, T. Tracing groundwater recharge sources in a mountain–plain transitional area using stable isotopes and hydrochemistry. Journal of Hydrology, 464–465, p. 116–126, 2012.
26. SURENDAR, N.; KRISHNAVENI, M. Stable isotopic characterization in surface and groundwater interaction in a hard rock terrain of a semi-arid region. IEESE Internat. Journal of Science and
Technology, 3, 2, p.8-13, 2014.
27. CLARK, I.D., FRITZ, P. Environmental Isotopes in Hydrogeology, CRC Press,Lewis Publishers, New York, 328 pp.,1997.
28. KENDALL, C.; MC DONNELL, J.J. Isotope Tracers in Catchment Hydrology. Elsevier, Amsterdam, 1998.
29. TSUJIMURA, M.; ABE, Y.;TANAKA, T.; SHIMADA, J.; HIGUCHI, S.; YAMANAKA, T.; DAVAA, G.; OYUNBAATAR. Stable isotopic and geochemical characteristics of groundwater in Kherlen River basin, a semi-arid region in eastern Mongolia.Journal of Hydrology , 333, p. 47– 57, 2007.
30. ZHU, G.F., LI, Z.Z.,SU, Y.H., MA, J. Z., ZHANG, Y.Y. Hydrogeochemical and isotope evidence of groundwater evolution and recharge in Minqin Basin, Northwest China. Journal of Hydrology, 333, 239– 251, 2007.
31. FARID, I., ZOUARI, K., TRABLESI, R., KALLALI, A. R.Application of environmental tracers to study groundwater recharge ina semi-arid area of Central Tunisia. Hydrological Sciences Journal, 59:11,
p. 2072-2085, 2014. DOI: 10.1080/02626667.2013.863424.
32. IRD - Instituto de Radioproteção e Dosimetria. Sustainable Management of Groundwater in
33. TURPIN, L.; MARUEJOL, P.; CUNEY, M. U- Pb, Rb - Sr and Sm- Nd chronology of granitic basement, hydrothermal albitites and uranium mineralization (Lagoa Real, South-Bahia, Brazil). Contrib.
Mineral Petrol. 98:139-147, 1988.
34. CRUZ, S. C. P.; ALKMIM, F. F.,. LEITE, C. M. M.; EVANGELISTA, H. J.; CUNHA, J. C.; MATOS, E. C., NOCE, C. M.; MARINHO, M. M. Geology and structural framework of the Lagoa Real Complex, Paramirim Valley, central-west of Bahia. Brazilian Journal of Geosciences, 37, p. 128-146, 2007. In Portuguese.
35. LOBATO, L. M.; PIMENTEL, M. M.; CRUZ, S. C. P.; MACHADO, N.; NOCE, C. M.; ALKMIM, F. F. U–Pb geochronology of the Lagoa Real uranium district, Brazil: Implications for the age of the uranium mineralization. Journal of South American Earth Sciences, 58, p. 129-140, 2015.
36. IAEA - International Atomic Energy Agency. Sampling procedures for isotope hydrology. Available at: http://www-naweb.iaea.org/napc/ih/documents/other/Sampling%20booklet%20web.pdf. Last accessed: 15 March 2012.
37. CRAIG, H. Isotopic variations in meteoric waters, Science, 133, p. 1702, 1961.
38. ROZANSKI, K.; ARAGUÁS-ARAGUÁS L.; GONFIANTINI, R. Isotope patterns in modern global precipitation, Climate change in continental isotope records, Geophysical Monograph, vol. 78, edited by P. K. Swart et al., p. 1 –36, AGU, Washington, D. C., 1993.
39. IAEA/WMO - (International Atomic Energy Agency/World Meteorological Organization). Global
Network of Isotopes in Precipitation. The GNIP Database. Available at: http://www.iaea.org/water. Last
accessed: 23 August 2016.
40. OTT, R.L.; LONGNECKER, M. An Introduction to Statistical Methods and Data Analysis, fifth ed. Duxbury, Pacific Grove, CA, 2001.
41. SHAPIRO, S.S.; WILK, M.B. An Analysis of Variance Test for Normality (Complete Samples).
42. CUSTÓDIO, E.; LLAMAS, M. R. Hidrología Subterránea. Barcelona. Barcelona: Ed. Omega, v. 2, 1983.
43. FREEZE, R.A.; CHERRY, J.A. Groundwater. Prentice-Hall, Englewood Cliffs, New Jersey, 1979.
44. PU, T.; HE, Y.; ZHANG, T.; WU, J.; ZHU, G.; CHANG, L. Isotopic and geochemical evolution of ground and river waters in a karst dominated geological setting: A case study from Lijiang basin, South-Asia monsoon region. Applied Geochemistry, 33, p. 199-212, 2013.
45. MONDAL, N.C.; SINGH, V.P., Hydrochemical analysis of salinization for a tannery belt in southern India. Journal of Hydrology, 405, p. 235-247, 2011.
46. NYENDE, J.; VAN TONDER, G.; VERMEULEN, D. Geological evolution of low lying areas in Uganda: Impacts of climate variability on rock weathering and consequences on groundwater quality and availability - a review. J. Environ. Sci. Water Resourc. 3 (8): 163-183, 2014.
47. SARMA, V. V. J. & SWAMY, A. N. Groundwater quality of Visakhapatnam basin, India. Wat., Air
and Soil Pollut., 16, 317-329, 1981.
48. HEM, J. D. Study and Interpretation of the Chemical Characteristics of Natural Water. 3rd ed., U.S. Geological Survey, Water Supply Paper 2254, 263 pp., 1985.
49. LOVE, A. J., COOK, P.G., HARRINGTON, G.A., SIMMONS, C.T. Groundwater Flow in the Clare Valley. Report Book DWR02.03.0002, Department for Water Resources, Adelaide, 43 pp., 2002.
50. YIDANA, S. M. The stable isotope characteristics of groundwater in the Voltaian Basin – An evaluation of the role of meteoric recharge in the basin. Journal of Hydrogeology and Hydrol. Eng., 2:2, 2013.
51. BARNES, C.J.; ALLISON, G.B. The distribution of deuterium and 18O in dry soils. Journal of
Hydrology, 60, p.141-156, 1983.
52. GAT, J.R. Oxygen and hydrogen isotopes in the hydrologic cycle. Annu. Rev. Earth Planet.Sci., 24, p.225-262, 1996.
53. STADLER, S., OSENBRÜCK, K., SUCKOW, A.O., HIMMELSBACH, T., HÖTZL, H. Groundwater flow regime, recharge and regional-scale solute transport in the semi-arid Kalahari of Botswana derived from isotope hydrology and hydrochemistry. Journal of Hydrology, 388, p. 291–303, 2010.
54. BLASH, K.W.; BRYSON, J.R. Distinguishing sources of ground water recharge by using δ2H and δ18O. Groundwater, 45, 3, p.294-308, 2007.
55. WAHI, A. K. Quantifying mountain system recharge in the upper San Pedro Basin, Arizona,
using geochemical tracers. M.S. thesis, Department of Hydrology and Water Resources, University of
Arizona, Tucson, 2005.
56. BAJJALI, W. Recharge mechanism and hydrochemistry evaluation of groundwater in the Nuaimeh
area, Jordan, using environmental isotope techniques.Hydrogeology Journal, 14, p.180–191, 2006.
57. PFAHL S.; SODEMANN, H. What controls deuterium excess in global precipitation? Clim. Past, 10, p. 771-781, 2014.
58. JOHANNESSON, K. H.; CORTÉS, A.; KILROY, K. C. Reconnaissance isotopic and hydrochemical study of Cuatro Ciénegas groundwater, Coahuila, México. Journal of South American Earth Sciences, 17, p. 171-180, 2004.
59. ROZANSKI, K., FROEHLICH, K., MOOK, W.G. Volume III: surface water. In: Mook, W.G. (Ed.),
Environmental Isotopes in the Hydrological Cycle: Principles and Application. UNESCO/IAEA, Paris,
p. 118, 2001.
60. GIBSON, J. J.; EDWARDS, T. W. D.; BIRKS, S. J.; ST AMOUR, N. A.; BUHAY, W. M.; MCEACHERN, P.; WOLFE, B. B.; PETERS, D. L. Progress in isotope tracer hydrology in Canada.