Droplet spectrum of a spray nozzle under different weather
conditions
1Espectro de gotas de uma ponta de pulverização em diferentes condições
meteorológicas
Christiam Felipe Silva Maciel2*, Mauri Martins Teixeira3, Haroldo Carlos Fernandes3, Sérgio Zolnier3 and Paulo Roberto Cecon4
ABSTRACT - The application of pesticides is always susceptible to losses through evaporation and drift of the spray droplets. With these losses, a smaller amount of pesticide reaches the target, possibly impairing the efficiency of phytosanitary control. Due to these concerns, the aim of this study was to evaluate the interference of weather conditions in the droplet spectrum produced by hydraulic spraying. To carry out the work, it was necessary to build an experimental system. This consisted of a laser particle-size analyser, hydraulic nozzle (Jacto JSF 11002), stationary sprayer, gas heater, wind tunnel, climate chamber (with the aim of maintaining the internal psychrometry similar to that of the air exiting the wind tunnel), collector, and temperature and RH sensors. The weather conditions for the study included vapour pressure deficits (VPD) of 5, 9.4, 20, 30.6 and 35 hPa, and air velocities of 2, 3.6, 7.4, 11.2 and 12.8 km h-1. A Rotatable Central Composite Design was used, and the data related using Response Surface Methodology. The wind caused such a sharp drift in the fine droplets, that it greatly affected the behaviour of the entire droplet spectrum, as well as hiding the effect of the VPD. However, the conclusion is that drift and evaporation both act on the coarser droplets.
Key words: Spraying losses. Droplet drift. Droplet evaporation. Hydraulic spraying. Laser particle-size analyser.
RESUMO - A aplicação de agrotóxico está sempre suscetível às perdas por evaporação e deriva das gotas pulverizadas. Com estas perdas do produto aplicado, menor será a quantidade de defensivo que atinge o alvo e, possivelmente, a eficiência do controle fitossanitário será prejudicada. Devido a estas preocupações, este estudo teve como objetivo avaliar a interferência das condições meteorológicas no espectro de gotas produzido pela pulverização hidráulica. Para realização do trabalho, um sistema experimental precisou ser construído, o qual foi constituído por: analisador de partículas a laser, ponta hidráulica (Jacto JSF 11002), pulverizador estacionário, aquecedor a gás, túnel de vento, câmara climática, com o objetivo de manter uma condição psicrométrica interna similar ao ar que saía do túnel de vento, bojo e sensores de temperatura e UR. As condições meteorológicas para o trabalho foram compreendidas pelos déficits de pressão de vapor (DPV) de 5; 9,4; 20; 30,6 e 35 hPa e velocidades do ar de 2; 3,6; 7,4; 11,2 e 12,8 km h-1. Foi utilizado o Delineamento Composto Central Rotacional e os dados foram relacionados por meio da Metodologia de Superfície de Resposta. O vento provocou tão acentuada deriva das gotas finas, que afetou consideravelmente o comportamento de todo o espectro de gotas, além de encobrir o efeito do DPV. No entanto, pode-se concluir que tanto deriva quanto evaporação agem sobre as gotas mais grossas.
Palavras-chave:Perdas na pulverização. Deriva de gotas. Evaporação de gotas. Pulverização hidráulica. Analisador de partículas a laser.
DOI: 10.5935/1806-6690.20180048 *Author for correspondence
Received for publication 18/05/2016; approved on 29/08/2017
1Parte da Tese do primeiro autor apresentada no Programa de Pós-Graduação em Engenharia Agrícola/DEA/UFV
2Diretoria de Patentes, Instituto Nacional da Propriedade Industrial/INPI; Rua Mayrink Veiga, 9, Centro, Rio de Janeiro-RJ, Brasil, 20.090-910,
christiammaciel@hotmail.com
3Departamento de Engenharia Agrícola, Universidade Federal de Viçosa/UFV, Av. PH Rolfs, s/n - Campus Universitário, Viçosa-MG, Brasil,
36.570-900, mauriufv@gmail.com, haroldo@ufv.br, zolnier@ufv.br
4Departamento de Estatística, Universidade Federal de Viçosa/UFV, Av. PH Rolfs, s/n - Campus Universitário, Viçosa-MG, Brasil, 36.570-900,
INTRODUCTION
The application of agricultural pesticides should always be carried out adopting strict criteria, with concern over the amount of chemical used in phytosanitary control, as well as over the weather conditions at the time of application. Although these factors are recognised in the academic environment, many farmers are still ignorant of or even disregard such concerns, as shown
by Alvarenga and Cunha (2010) and Tobi et al. (2011);
this can have serious social, economic and environmental consequences.
Adverse weather conditions can generate
considerable losses during spraying due to the drift and/
or evaporation of the spray droplets. With losses in the applied product, a smaller amount of pesticide reaches the target, possibly reducing the efficiency of phytosanitary control, a fact reported in several studies when comparing different application times, showing that at more critical moments deposition of the chemical decreased
significantly (ALVARENGAet al., 2013, BALANet al.,
2008; NASCIMENTOet al., 2012).
When considered together, evaporation and drift can generate high losses, with values that reach 45% of
the total applied (CHAIMet al., 1999). Evaporation alters
the entire spectrum of the spray droplets while they are still in the air, which has been demonstrated using both
water-sensitive labels (ALVARENGAet al., 2013, 2014)
and laser particle-size analysers (MACIEL et al., 2016;
SASAKIet al., 2016). This effect is very worrying, since
when suffering a reduction in size, the droplet can be carried over long distances via the airflow (MATTHEWS, 2000).
One of the main variables to influence drift is wind speed; consequently, the higher the value of this variable, the greater will be the drift (CARLSEN;
SPLIID; SVENSMARK, 2006; NUYTTENS et al.,
2006). In addition to wind speed, other variables are also closely related to drift, such as the droplet spectrum (ARVIDSSON; BERGSTRÖM; KREUGER,
2011; GIL et al., 2014; NUYTTENS et al.,2010), the
height of the spray bar (ARVIDSSON; BERGSTRÖM;
KREUGER, 2011; SASAKI et al., 2011), the tractor
speed (ARVIDSSON; BERGSTRÖM; KREUGER, 2011) and the vapour pressure deficit (ARVIDSSON; BERGSTRÖM; KREUGER, 2011; CARLSEN; SPLIID;
SVENSMARK, 2006; NUYTTENSet al., 2006). With so
many variables influencing the fate of airborne droplets, the person applying the pesticides should always be aware of these conditions, to minimise losses as much as possible during product application.
Due to the serious problems generated by evaporation and drift when applying pesticides, studies
are continuously carried out in this area. Within this context, the aim of this study was to analyse the droplet spectrum of a hydraulic nozzle under different weather conditions, seeking to understand the influence such conditions have on spraying.
MATERIAL AND METHODS
The work was carried out in the Pesticide Application Laboratory of the Department of Agricultural Engineering located on the Viçosa Campus of the Universidade Federal do Viçosa, in the State of Minas Gerais, Brazil.
To analyse the droplet spectrum at different vapour pressure deficits (VPD) and air speeds, it was necessary to construct an experimental system. This system consisted of the following components: climate chamber, wind tunnel, gas heater, laser particle-size analyser, stationary sprayer, hydraulic spray nozzle, collector, and temperature and relative humidity sensors.
The wind tunnel consisted of an axial fan, 0.25 m in diameter, which was used to simulate the wind during spraying. In addition, the wind tunnel comprised an air homogeniser and 2.5 m of PVC tubing, with the same diameter as the fan.
A gas heater was used in the experimental system, positioned at the air inlet of the wind tunnel, to obtain the necessary VPD values to implement the treatments. To prevent the heater flame from reaching the fan, a 1.0 m long steel-plated tunnel was constructed and fixed to the air inlet of the fan.
At the far end of the air outlet of the wind tunnel, a climate chamber was constructed with the aim of maintaining the internal psychrometry similar to that of the air exiting the wind tunnel. This ensured that heat exchanges with the spray droplets were through airflows that were always at the desired VPD values. The climate chamber was 2.0 m in length, 1.4 m in width and 1.5 m in height. The structure was made from metal angle bars, and the sides closed in by galvanised steel plates, with thermal insulation made of Styrofoam sheets, 2.5 cm thick. The upper part of the chamber, right above the particle analyser and the spray nozzle, was sealed with a double layer of glass to make it possible to observe the behaviour of the operating system.
The second set consisted of another HMP60 sensor and a digital thermometer comprising a Type K thermocouple (TD-890, ICEL), which were installed inside the climate chamber. The purpose of these sensors was to check that the internal air had the same psychrometry as the flow of air from the wind tunnel. In this way, spraying was carried out only after both sensors had been standardised and stabilised. Both sets were installed inside an acrylic box and protected with fabric to prevent the water droplets from coming into contact with the electronic sensors.
The laser particle-size analyser (Spraytec, Malvern Instruments Ltd), with a focal length of 750 mm, was used to evaluate the droplet spectrum produced by the hydraulic nozzle. The nozzle used was a Jacto model JSF-11002, with a single fan and nominal flow rate of 0.8 L
min-1. The spray bar was mounted on a metal structure and
consisted of a spray nozzle connected to a regulating valve to maintain the working pressure always at 300 kPa.
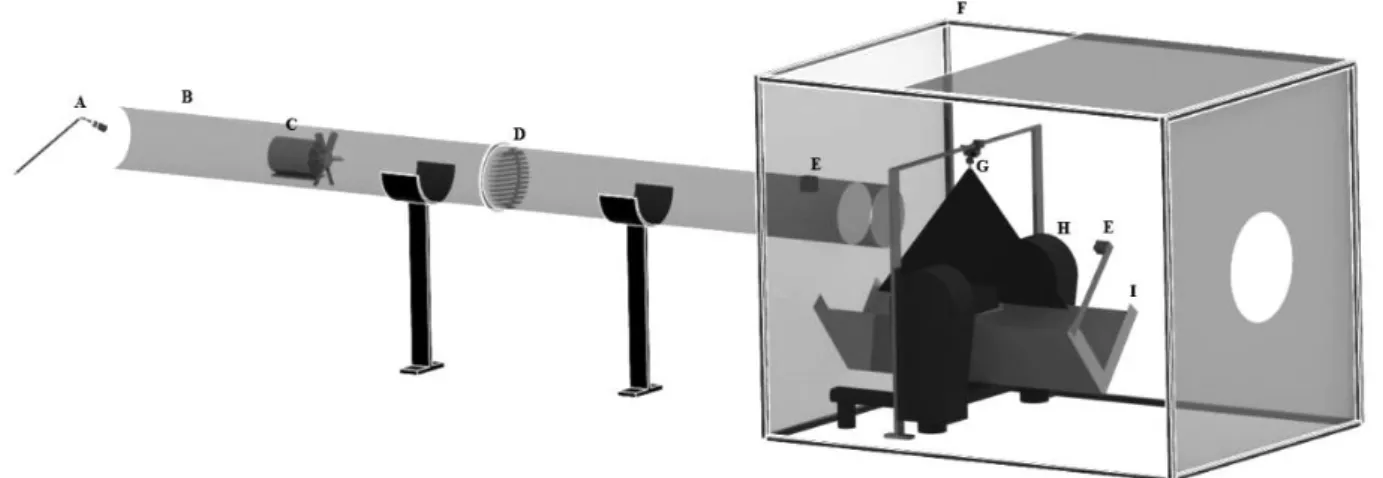
The spray nozzle in the experimental system was positioned 0.38 m away from the end, and 0.09 m above the PVC tubing. The tip was placed right over the particle analyser, 0.50 m above the laser beam. In this way, the influence of drift and evaporation on the droplet spectrum could be observed (Figure 1).
To characterise the spectrum, the particle-size analyser was configured to count droplets of 2.0 to 2000
μm at an acquisition rate of 2.5 kHz and a reading time
of 2.0 s. The study of the droplet spectrum included the following indicators: volume median diameter (VMD); Dv10; Dv90; Relative Span; percentage of the spray volume in droplets smaller than 100 µm (%V<100), with
Figure 1 - Experimental system designed and built to characterise the droplet spectrum under different psychrometric conditions. (A) gas heater; (B) wind tunnel; (C) axial fan; (D) air homogeniser; (E) HMP60 sensor (F) climate chamber; (G) spray nozzle; (H) particle-size analyser; and (I) collector
a diameter between 100 and 200 µm (100<%V<200), between 200 and 300 µm (200<%V<300), between 300
and 400 µm (300<%V<400), between 400 and 500 μm
(400<%V<500), between 500 and 600 μm (500<%V<600)
and finally droplets greater than 600 μm (%V>600).
The wind speeds used were 2.0, 3.6, 7.4, 11.2 and
12.8 km h-1, which were obtained with the wind tunnel
fan connected to a frequency inverter. The speed was measured as per AMCA standard 210-99 (2000), but as the values were very low, instead of using a Pitot tube, a hot wire anemometer (TAFR-180, Instrutherm) was installed. The VPD values used were 5.0, 9.4, 20.0, 30.6 and 35.0 hPa. To simulate the spray solution, only pure water was used, previously heated to the temperature of the experimental system. After each spraying, the climate chamber was opened to allow the collector, the bottom and the walls to dry.
Prior to carrying out this study, the droplet spectrum produced by the nozzle was determined at a working pressure of 300 kPa, following the guidelines of ASAE standard S572.1 (2009). During this analysis, the psychrometric conditions recommended by ASAE S572.1 (2009) and ISO 5682.1 (1996) were respected. Thus, the analysis was performed only at temperatures below 23 °C and an RH greater than 75%.
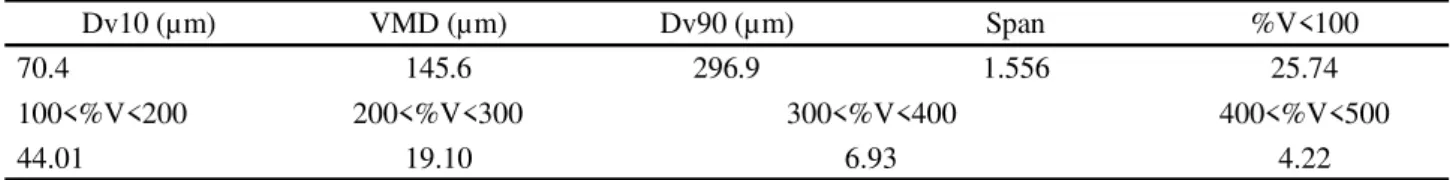
Table 1 - Droplet spectrum of the JFS-11002 nozzle
RESULTS AND DISCUSSION
The droplet spectrum of the JSF-11002 hydraulic nozzle analysed in the laboratory is shown in Table 1. The parameters 500<%V<600 and %V>600 were omitted from Table 1, as this hydraulic nozzle does not produce droplets in these spectra.
Using the parameters Dv10, VMD and Dv90, it is possible to check the classification of the spray nozzle for the droplet spectrum it produces against the ASAE S572.1 (2009) reference chart. According to this chart, all three parameters are within the range for fine droplets, and as a result, the droplets produced by this hydraulic nozzle can be classified as fine.
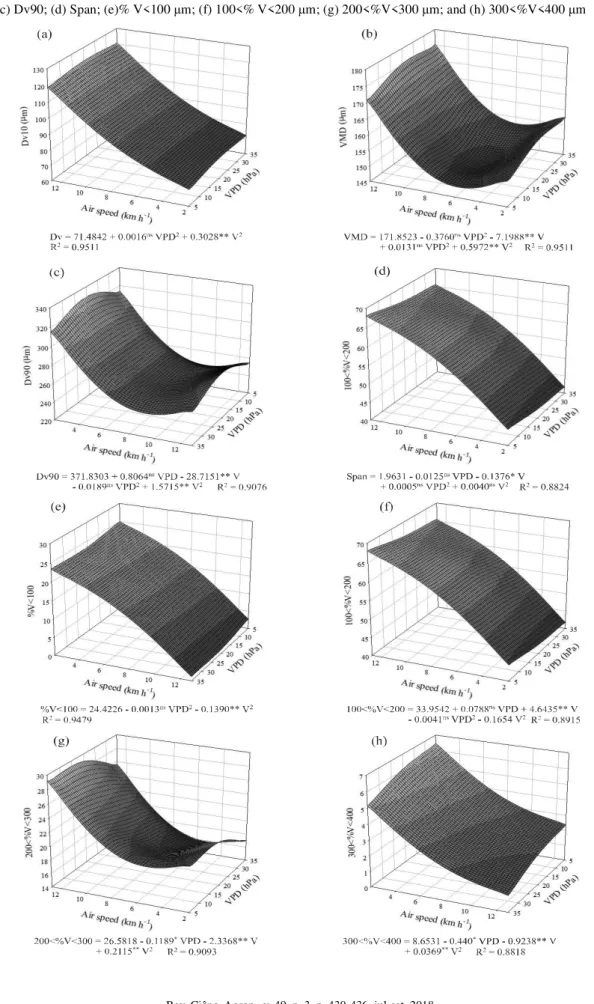
The droplet spectrum of the JSF 11002 nozzle evaluated by the particle-size analyser at different VPD values and air velocities is shown in Figure 2. As can be seen, the VPD was only significant for parameters 200<%V<300 and 300<%V<400, and for both parameters there was a decrease in the percentage of droplet volume with the increase in VPD. Despite having little influence on the spectrum evaluated in this work, being significant in only two ranges of the spectrum under study, an increase in VPD reduces the diameter of the droplets and consequently increases drift in the spray (ARVIDSSON; BERGSTRÖM; KREUGER, 2011; CARLSEN; SPLIID; SVENSMARK, 2006; HOLTERMAN, 2003;
NUYTTENSet al., 2006).
The values of parameters Dv10, VMD and 100<%V<200 mainly increased with the increase in air speed. Parameters Dv90, Span and %V<100 showed a reduction in value with the increase in air speed. For the range of 200<%V<300, there was an increase in value with the increase in air speed and a reduction in VPD. For 300<%V<400, there was reduction in value with the increase of both air speed and VPD. However, parameter 400<%V<500, which was found by spectrum analysis in the laboratory (Table 1), was not found in this study, which may be the result of a small area of the spray being analysed, unlike that carried out to characterise the nozzle.
Dv10 (µm) VMD (µm) Dv90 (µm) Span %V<100
70.4 145.6 296.9 1.556 25.74
100<%V<200 200<%V<300 300<%V<400 400<%V<500
44.01 19.10 6.93 4.22
**Significant at 1% probability by t-test; *Significant at 5% probability by t-test; Significant at 10% probability by t-test.nsNot significant at 10%
probability by t-test
The Dv10 parameter is strongly influenced by %V<100, especially when dealing with nozzles that produce fine droplets. Therefore, when there is a large reduction in %V<100 with increases in air speed, there is inevitably an increase in Dv10. This can be seen in the data shown in Figures 2a and 2e, since there was a decrease in the number of very fine droplets due to wind action. As a result, it can also be seen that the smaller the Dv10 obtained from a nozzle, the greater the production of fine droplets.
This reduction in parameter %V<100 occurred due to the large drag on the fine droplets caused by the increase in wind speed. This behaviour was quite significant, and resulted in a drop of approximately 24% for values below 1% of this parameter, thereby demonstrating the high susceptibility of fine droplets to being transported by the wind. The high drift of the fine droplets confirms the results found by Arvidsson,
Bergström and Kreuger (2011) and Gilet al. (2014), who
concluded that parameter %V<100 is a good indicator of drift potential, better than the VMD, which is widely used to predict such losses.
The drastic reduction in the %V<100 parameter
when increasing the air speed from 2.0 to 12.8 km h-1,
represents the almost total elimination of droplets smaller
than 100 μm. This is so significant that it considerably
affects the behaviour of all the other parameters, especially Dv10, as previously discussed. It therefore reduces the effect of the VPD on the droplet spectrum, which had low relevance to this work, but whose importance has
been proved in other studies (ALVARENGAet al., 2014;
MACIELet al., 2016; SASAKIet al., 2016).
For parameter 100<%V<200 (Figure 2f), there was an increase in values with increasing air speed, while for parameter 200<%V<300 (Figure 2g), the curve starts by decreasing, but quickly increases with the increase in air speed. As discussed above, this increase occurred due
to the enormous drag on droplets smaller than 100 μm.
A few droplets, whose diameters are located within these ranges, were probably also dragged. However, after the almost complete elimination of the fine droplets, those included in the larger size-ranges began to represent a larger percentage of the total sprayed volume.
The behaviour of the droplets included in parameter 300<%V<400 (Figura 2h) clearly shows that the coarser droplets are also dragged by the air movement, in addition to evaporating with the increase in DPV. As a result, there is a reduction in the value of parameter Dv90 with the increase in air speed, since this parameter is wholly associated the coarser droplets of the spectrum. However, the Dv90 parameter was not influenced by the DPV.
Differently to that shown by 100<%V<200 and 200<%V<300, there was a reduction in droplets in the 300<%V<400 range with the increase in air speed. As this parameter already presents a very low volume of droplets at low speeds, the corresponding drift did not allow sufficient elimination of the fine droplets to increase its percentage of the total volume. This elimination therefore favoured only the other two ranges of droplet volume.
In addition to the droplets in the 300<%V<400 range, those included in parameter 200<%V<300 also decreased with the increase in VPD. There may be several reasons for the VPD only having an influence on the coarser droplets of the spectrum, and one of them may
be associated with a phenomenon seen by Maciel et al.
(2016) and Sasaki et al. (2016). These authors showed
that with the increase in VPD, the volume of evaporated droplets increases, which causes a displacement of the diameter classes formed. Accordingly, droplets belonging to the 300<%V<400 class are reduced in size and included in the 200<%V<300 class, and so on.
That the VPD is only significant for the 200<%V<300 spectrum range is therefore due to not enough droplets evaporating in the 300<%V<400 range to make up for those that suffered a reduction in diameter. In the case of the 300<%V<400 parameter, there are no coarser droplets than those included in this range to make up for the reduction in droplet size and to reduce the effect of the VPD on this parameter. Furthermore, the high drag of the finer droplets with the increase in air speed may be minimising the action of the VPD on the other parameters, as previously discussed.
The purpose of the Span index is to show the spray quality of the spectrum, so that the lower the value of this parameter the more homogeneous the droplets
(SASAKI et al., 2013). However, the decrease in Span
value (Figure 2.d) seen in this analysis does not mean the production of a more homogeneous droplet spectrum with increasing air speed. This result confirms yet again that the finer droplets are eliminated by drift, with the spectrum now being formed by a narrower range of droplet diameters.
CONCLUSIONS
1. Air speed causes such a sharp drift in the fine droplets, that it has a considerable effect on the behaviour of the entire droplet spectrum, in addition to reducing the effect of the VPD. However, it can be concluded that both drift and evaporation act on the coarser droplets;
2. Increasing the air speed induces high drag on droplets
smaller than 100 μm, and consequently increases the
value of the parameters Dv10, VMD, 100<%V<200
and 200<%V<300. In contrast, there is a reduction in parameter %V<100;
3. The drag on the droplets included in parameter 300<%V<400 clearly shows that the coarser droplets are also influenced by the wind, with a consequent reduction in the value of Dv90.
REFERENCES
AIR MOVING AND CONDITIONING ASSOCIATION.
Laboratory methods of testing fans for rating. Arlington Heights: AMCA 210- 99, 2000. 69 p.
ALVARENGA, C. B.et al. Déficit de pressão de vapor d’água no ar na distribuição de líquido utilizando um pulverizador hidropneumático. Amazonian Journal of Agricultural and Environmental Sciences, v. 56, n. 2, p. 81-87, 2013.
ALVARENGA, C. B. et al. Efeito do déficit de pressão de vapor d’água no ar na pulverização hidropneumática em alvos artificiais.Bioscience Journal, v. 30, n. 1, p. 182-193, 2014. ALVARENGA, C. B.; CUNHA, J. P. A. R. Aspectos qualitativos da avaliação de pulverizadores hidráulicos de barra na região de Uberlândia, Minas Gerais. Engenharia Agrícola, v. 30, n. 3, p. 555-562, 2010.
AMERICAN SOCIETY OF AGRICULTURAL ENGINEERS.
Spray nozzle classification by droplet spectra. St. Joseph: ASAE S572.1, 2009. 4 p.
BALAN, M. G.et al. Deposição da calda pulverizada por três pontas de pulverização sob diferentes condições meteorológicas.
Semina: Ciências Agrárias, v. 29, n. 2, p. 293-298, 2008. CARLSEN, S. C. K.; SPLIID, N. H.; SVENSMARK, B. Drift of 10 herbicides after tractor spray application. 2. Primary drift (droplet drift).Chemosphere, v. 64, p. 778-786, 2006.
CHAIM, A.et al. Método para monitorar perdas na aplicação de agrotóxicos na cultura de tomate.Pesquisa Agropecuária Brasileira, v. 34, n. 5, p. 741-747, 1999.
GIL, E. et al. Determination of drift potential of different flat fan nozzles on a boom sprayer using a test bench.Crop Protection, v. 56, p. 58-68, 2014.
HOLTERMAN, H. J.Kinetics and evaporation of water drops in air. Wageninger: IMAG, 2003. 67 p.
INTERNATIONAL ORGANIZATION FOR STANDARDIZATION. Equipment for crop protection: spraying equipment. Part 1: Test methods for sprayer nozzles. Geneva: ISO 5682-1, 1996. 5 p.
MACIEL, C. F. S.et al. Droplets spectrum at different vapour pressure deficits.Revista Ciência Agronômica, v. 47, n. 1, p 41-46, 2016.
MATTHEWS, G. A.Pesticide application methods. 3rd edition. London: Blackwell Science, 2000. 448 p.
NASCIMENTO, A. B.et al. Deposição de glifosato e utilização de adjuvante para diferentes pontas de pulverização e horário de aplicação.Pesquisa Aplicada & Agrotecnologia, v. 5, n. 2, p. 105-110, 2012.
NUYTTENS, D.et al. Experimental study of factors influencing the risk of drift from field sprayers. Part 1: Weather conditions.
Aspects of Applied Biology, v. 77, p. 1-8, 2006.
NUYTTENS, D. et al. Comparison between indirect and direct spray drift assessment methods.Biosystems Engineering, v. 105, p. 2-12, 2010.
SASAKI, R. S.et al. Uniformidade de distribuição volumétrica de pontas de pulverização hidráulica em diferentes condições operacionais.Engenharia na Agricultura, v. 19, n. 6, p. 541-547, 2011.
SASAKI, R. S.et al. Spectrum of droplets produced by use of adjuvants.Idesia, v. 31, n. 1, p. 27-33, 2013.
SASAKI, R. S. Droplets spectrum of air-assisted boom sprayers under different environmental and operational conditions.
Agriambi, v. 20, n. 1, p. 92-96, 2016.
TOBI, I.et al. Determination of accuracy level of agricultural spraying application in Sanliurfa/Turkey. African Journal of Agricultural Research, v. 6, n. 28, p. 6064-6072, 2011.