Revista Brasileira de
Engenharia Agrícola e Ambiental
Campina Grande, PB, UAEA/UFCG – http://www.agriambi.com.br
v.22, n.11, p.804-809, 2018
Spray volume distribution pattern and droplet
size spectrum from ceramic nozzles
DOI: http://dx.doi.org/10.1590/1807-1929/agriambi.v22n11p804-809
Mateus P. Massola
1, Vandoir Holtz
2, Marcos P. de O. Martins
1, Anderson da S. Umbelino
1& Elton F. dos Reis
1A B S T R A C T
Droplet size spectrum and uniformity of spray volume distribution are important parameters for selecting spray nozzles. The objective of this study was to evaluate the average spray volume distribution and droplet size spectrum from ceramic nozzles. The spray volume distribution pattern was evaluated on a test table for hydraulic spray nozzles using spray heights of 0.4, 0.5, 0.6, 0.7, and 0.8 m, and working pressures of 500, 600, and 700 kPa. Computer simulations were used to analyze the spray volume distribution using arrangements of bar heights, working pressures, and spacing between spray nozzles in a bar of 12 m. The droplet size spectrum from the spray nozzles was evaluated using a randomized complete experimental design in a 2 × 3 split-plot arrangement consisting of two types of nozzles (ATR-1.0, and TVI-800075) and three working pressures (500, 600, and 700 kPa), with four replications. The uniformity of spray volume distribution was improved when using ATR-1.0 spray nozzles spaced 0.4 or 0.6 m apart, regardless of the working pressure. Regarding the droplet size spectrum, the volume median diameter decreased with increasing the working pressure for both types of nozzles, reaching 210 μm (ATR-1.0) and 483 μm (TVI-800075). Contrastingly, the percentage of droplets with diameter smaller than 100 μm increased with increasing working pressure; the target coverage presented the same trend, with 8.4% of coverage when using ATR nozzles with working pressure of 700 kPa.
Avaliação da distribuição volumétrica e do espectro
de gotas produzidos por pontas cerâmicas
R E S U M O
O espectro de gotas e a uniformidade de distribuição volumétrica são parâmetros importantes na seleção da ponta de pulverização. Objetivou-se nesse trabalho avaliar em laboratório o perfil médio de distribuição volumétrica e o espectro de gotas produzidos por pontas de cerâmica. Para isso foram avaliadas as pontas ATR 1,0 e TVI 800075. O perfil médio de distribuição volumétrica foi analisado para as alturas de 0,4; 0,5; 0,6; 0,7 e 0,8 m e pressões de 500, 600 e 700 kPa, em uma mesa de teste para pontas de pulverização hidráulica. Posteriormente, por meio de simulação computacional, foi analisada a distribuição da calda por meio de arranjos entre a altura da barra, pressão de trabalho e espaçamentos entre bicos, em uma barra de 12 m. Para avaliar o espectro de gotas produzido pelas pontas foi montado um exprimento em delineamento inteiramente casualizado arranjado em parcelas subdivididas 2 x 3, sendo duas pontas e três pressões de trabalho, com 4 repetições. Verificou-se que a uniformidade de distribuição apresentou melhores resultados para ponta ATR nos espaçamentos de 0,4 e 0,6 m, nas diferentes pressões. Para o espectro de gotas, o diâmetro da mediana volumétrica diminuiu com o incremento da pressão de trabalho para as duas pontas, atingindo em 210 para a ATR e 483 µm para a TVI. Em contraste, a porcentagem de gotas menores que 100 µm aumentou com o incremento da pressão e a cobertura do alvo apresentaram o mesmo fenômeno, com 8,4% para a ponta ATR na pressão de 700 kPa.
Key words:
homogeneous distribution volume median diameter hydraulic spraying
Palavras-chave: distribuição homogênea
diâmetro da mediana volumétrica pulverização hidráulica
1 Universidade Estadual de Goiás/Campus de Ciências Exatas e Tecnológicas. Anápolis, GO. E-mail: [email protected] (Corresponding author)
- ORCID: 0003-0096-2173; [email protected] - ORCID: 0002-9182-7382; [email protected] - ORCID: 0000-0002-8559-6362; [email protected] - ORCID: 0000-0002-8683-6735
2 Universidade do Estado de Mato Grosso/Faculdade de Ciências Agrárias, Biológicas e Sociais Aplicadas/Laboratório de Práticas Agrícolas Mecanizadas.
Nova Xavantina, MT. E-mail: [email protected] - ORCID:0000-0002-3471-7611
Introdução
The function of spray nozzles is forming droplets; the passing of the pressurized liquid through the tip orifice fractionates the liquid into droplets. Moreover, spray nozzles determine the spray flow, distribution, and droplet size pattern (Mota & Antuniassi, 2013).
According to Freitas et al. (2005), the uniformity of spray volume distribution can be evaluated by the coefficient of variation resulting from the overlap of the spray jets. Countries of the European Union consider coefficients of variation lower than 7% for the uniformity of the spray volume distribution (Cordeiro, 2001).
Several studies have evaluated working pressures with different spray nozzles; however not describing its effect on the spray volume distribution because of the influence of the jet angle. According to Nuyttens et al. (2007), an adequate combination of spray tip and working pressure can maximize the target coverage.
The droplets sprayed do not have the same size, thus, a percentage of the liquid volume is sprayed as fine droplets, regardless of the tip model. Some parameters are used to analyze the droplet size spectrum of sprays, such as the volume median diameter (VMD) and the coefficient of homogeneity (CH). According to Baesso et al. (2014), the CH is defined as the ratio between VMD and number median diameter (NMD), which express numerically the droplet uniformity.
Considering the importance of performing applications with quality and safety, the objective of this work was to evaluate the effect of working pressures on the spray volume distribution and droplet size spectrum from different ceramic nozzles.
Material and Methods
The tests were conducted at the Laboratory of Agricultural Machinery of the State University of Goiás, Anápolis, GO, Brazil. The experiment was conducted in two steps, one determining the spray volume distribution patterns and other evaluating the droplet size spectrum generated by the different spray nozzles.
A test table was built according to the Standards ISO 5,682-1:1996 to determine the spray volume distribution pattern, using two types of ceramic spray nozzles in a spray bar at different heights from the test table (0.4, 0.5, 0.6, 0.7, and 0.8 m), and working pressures (500, 600, and 700 kPa). The spray nozzles used were the ATR-1.0 (hollow cone spray) and TVI-800075 (air-induction hollow cone spray). The spray solution was collected for 60 seconds for each height and working pressure combination, with four replications. Based on the average volume collected, the volume distribution patterns were determined using computer simulations; this procedure made possible the calculation of the volume distribution pattern along the 12-meter wide spray bar with 30, 24, 20, 15, 12, and 10 nozzles spaced 0.4, 0.5, 0.6, 0.8, 1.0, and 1.2 m apart, respectively.
The droplet size spectrum was evaluated using a randomized complete experimental design, with four replications, using
a 2 × 3 split-plot arrangement, with randomly distributed nozzles as plots, and working pressures (500, 600, and 700 kPa) as subplots.
Water-sensitive papers (76 × 26 mm) were placed at the center of the jet to evaluate the droplet size spectrum. These papers were collected soon after spraying and properly identified and packed. Subsequently, these papers were scanned at 600 dpi resolution. These images were analysed using the Image Tool 3.0 software to determine the area of each droplet in the papers. Then, these data were corrected as proposed by Chaim et al. (1999). In addition, the volume median diameter (VMD), coefficient of homogeneity (CH), number of droplets per area, percentage of droplets with diameter smaller than 100 μm, volume of droplets with diameter smaller than 100 μm, and target coverage area using the different nozzles and working pressures were determined. The spray was applied using a CO2
-pressurized sprayer coupled to a bar with four nozzles spaced 0.5 m apart at 0.5 m from the target, using average speed of 5.0 km h-1. The average air temperature, relative humidity, and
wind speed during the spraying were 29.6 ± 0.1 oC, 42 ± 2%,
and 1.24 ± 0.1 m s-1, respectively.
The data of the droplet size spectrum were subjected to analysis of variance, using the F test at 5% probability. When, significant means were compared by the Tukey's test at 5% probability. The statistical analysis were performed using the SISVAR 5.6 program (Ferreira, 2014).
Results and Discussion
The spray volume distribution patterns using the TVI-800075 ceramic tip with different working pressures and heights are shown in Figure 1. The spray volume distribution increased, with peaks at the ends, followed by an accentuated slope toward the center for the spray bar heights of 0.4 and 0.5 m, regardless of the working pressure (Figures 1A and B). However, increasing the heights increased the spray deposition band, regardless of the working pressure, tending to reduce the peaks at the ends of the deposition band, improving the uniformity of spray distribution (Figures 1C, D, and E).
In general, the nozzles must have a triangular, symmetrical profile to generate a uniformed liquid distribution and an adequate overlap of adjacent spray jets (Cunha et al., 2007), according to the individual distribution pattern of each tip (Cunha & Silva, 2010). From the practical point of view, the coefficient of variation of the spray bar is more important than the volume of liquid deposited since different volumes can have equal coefficient of variation. Thus, for the purposes of the present study, only the coefficient of variation was evaluated.
According to Nascimento et al. (2014), air-induction spray nozzles have irregular distribution, showing a depression at the center and peaks at the ends of the deposition band, hindering the uniformity of spray volume distribution. However, this was not observed when the bar height was greater than 0.7 m (Figure 1E), generating an improvement in the spray volume distribution.
Figure 1. Spray distribution patterns using TVI-800075 ceramic spray nozzles, working pressures of 500, 600, and 700 kPa, and spray bar heights of 0.4 (A), 0.5 (B), 0.6 (C), 0.7 (D) and 0.8 m (E)
A.
B.
C.
D.
E.
Figure 2. Simulation of spray volume distribution along the spray bar using TVI-800075 ceramic spray nozzles, considering different arrangements (working pressure and height of bar) that had coefficient of variation lower than 7%
A.
B.
C.
D.
Result of overlap
V
olume (mL)
to the results, the spacing between nozzles strongly affects the quality of the volume distribution. Moreover, the coefficient of variation of the average distribution volume of the tip TVI-800075 showed that this tip is not suitable for spacings between nozzles greater than 0.4 m. This could be observed by the overlapping of the spray jets.
The manufacturer of the TVI-800075 tip recommends a working pressure of 417 to 1,551 kPa. Thus, arrangements with higher pressures than those used in the present study may have a satisfactory volume distribution.
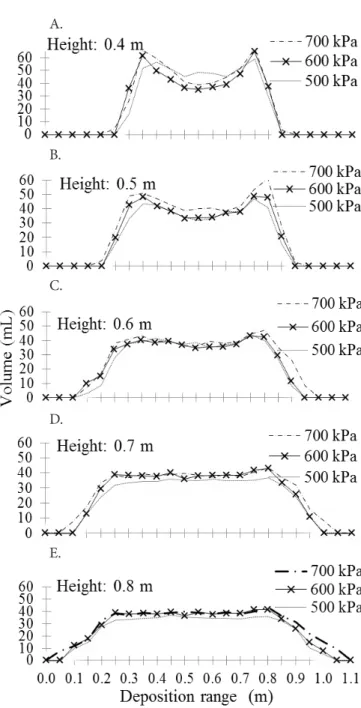
The use of ATR-1.0 nozzles at height of 0.4 m generated a spray volume concentrated at the center, forming a practically plane spray band. However, this plane was gradually curved by increasing the tip height from the table test (Figures 3A and B), regardless of the working pressure. The heights from 0.6 m generated higher volumes accumulated at the center, with gradual decrease toward the ends (Figures 3C, D and
E). Moreover, the deposition band was broader, with a higher spray volume reaching the ends, but lower than that of the central nozzles, regardless of the working pressure. Maciel et al. (2017) used Lurmark LD-11002 spray nozzles and found similar results, with increases in the central peak of the spray volume distribution when using higher heights, regardless of the working pressures, but they did not performed simulations considering the overlap of the spray jets.
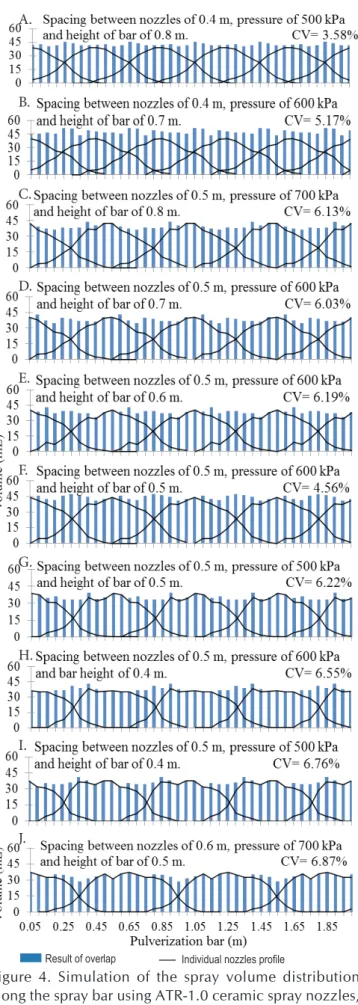
In general, the spray bar height from the target generates similar effects when using the same type of tip, with no difference in spray volume distribution pattern. However, increasing the height increases the deposition band (Nuyttens et al., 2007), which affects the overlap of the jets, thus affecting the uniformity of volume distribution. ATR-1.0 nozzles presented better results (Figure 4) than TVI-800075 nozzles (Figure 2), especially when they were spaced 0.5 or 0.6 m apart.
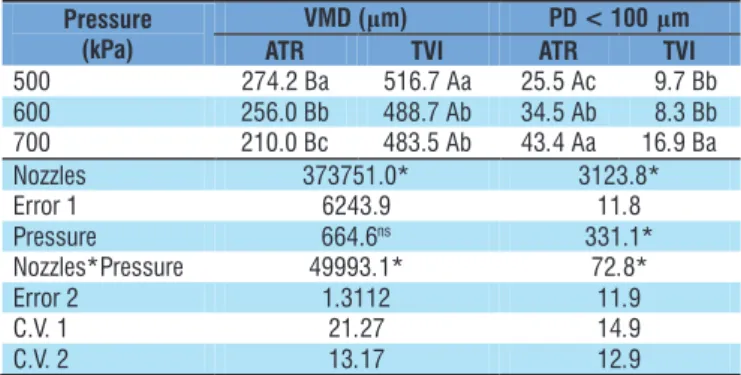
The analysis of variance of the volume median diameter (VMD) presented significant differences between the spray nozzles, and interaction between the factors. However, no significant effect was found for the working pressures evaluated. The VMD and droplets with diameter smaller than 100 μm were affected by increasing the working pressure and by the spray tip used (Table 1).
TVI-800075 nozzles presented higher VMD than ATR-1.0 nozzles; its droplet diameters reduced with increasing working pressure. Alvarenga et al. (2012) evaluated the droplet size spectrum produced by JA-2 spray nozzles and found similar results. The highest VMD found was 516.7 μm, using working pressure of 500 kPa. The lowest VMD was 210.0 μm, using ATR spray nozzles and working pressure of 700 kPa. According to Minguela & Cunha (2010), a higher VMD may promote a
Figure 3. Spray distribution pattern using ATR-1.0 ceramic spray nozzles, working pressures of 500, 600, and 700 kPa, and spray bar heights of 0.4 (A), 0.5 (B), 0.6 (C), 0.7 (D) and 0.8 m (E)
A.
B.
C.
D.
E.
A.
B.
D.
E.
F.
G.
H.
Figure 4. Simulation of the spray volume distribution along the spray bar using ATR-1.0 ceramic spray nozzles, considering the arrangements (working pressure and height of bar) that had coefficient of variation lower than 7%
I.
J.
Result of overlap ── Individual nozzles profile
C.
V
olume (mL)
safer spraying, with less drift and evaporation. However, larger droplets (500 to 600 μm) causes runoff, thus, the characteristics of the target surface must be considered. Moreover, ATR-1.0 nozzles generated medium droplets and TVI-800075 nozzles generated extremely thick droplets, according to the ASAE (2004) specifications.
The type of spray tip, working pressure, and the interaction between these factors were significant for the percentage of droplets with diameter smaller than 100 μm. The hollow cone jet nozzles (ATR-1.0) generated a higher percentage of drift-prone droplets than the air-induction cone jet nozzles (TVI-800075); however, the working pressures caused drift only for ATR-1.0 nozzles. This is explained by the increasing pressure, which increased the volume of liquid passing through the tip orifice at same time. Thus, smaller droplets are sprayed, increasing the number of droplets that tend to be deposited
Table 1. Analysis of variance (mean square), and mean values of the volume median diameter (VMD) and percentage of droplets (PD) with diameter smaller than 100 μm using TVI-800075, and ATR-1.0 spray nozzles with working pressures of 500, 600, and 700 kPa
Pressure (kPa)
VMD (μm) PD < 100μm
ATR TVI ATR TVI
500 274.2 Ba 516.7 Aa 25.5 Ac 9.7 Bb
600 256.0 Bb 488.7 Ab 34.5 Ab 8.3 Bb
700 210.0 Bc 483.5 Ab 43.4 Aa 16.9 Ba
Nozzles 373751.0* 3123.8*
Error 1 6243.9 11.8
Pressure 664.6ns 331.1*
Nozzles*Pressure 49993.1* 72.8*
Error 2 1.3112 11.9
C.V. 1 21.27 14.9
C.V. 2 13.17 12.9
Means followed by different uppercase letters in the rows or different lowercase letters in the columns differ statistically by the Tukey's test at 0.05 probability; ns Not significant (p > 0.05); *Significant at 0.05 probability by the F test. CV - Coefficient of variation
droplets with diameter smaller than 100 μm when using the highest working pressures, regardless of the spray tip model. However, the ATR-1.0 spray nozzles generated a greater number of droplets with diameter smaller than 100 μm. Moreover, it promoted the greatest coverage percentage with the same working pressures.
ATR-1.0 nozzles presented coefficient of homogeneity (CH) of 1.9 (Table 2), representing a more homogeneous spraying when compared to TVI-800075 nozzles. This tip in the same evaluation condition generated good distribution uniformity along the spray bar. Adequate spray coverages depend on the target type. Regarding the control of diseases, the target is small and in high number, requiring small droplets to obtain high spray coverage. Regarding the control of insects, large droplets must be used because of the greater mobility and lower number of targets (Baesso et al., 2014). ATR-1.0 nozzles generated a greater percentage of target coverage compared to TVI-800075 nozzles. Moreover, this result was found when increasing the working pressure, which generated more small-size droplets for the same volume sprayed, increasing the number of droplets covering the area (Schneider et al., 2013).
The spray nozzles evaluated in the present study had similar flow characteristics, however, their spray volume distribution pattern and droplet size spectrum showed differences. Thus, appropriate selection of spray nozzles and the use of adequate working pressures is important for a good volume distribution, which depends on the joint analysis of these factors (Freitas et al., 2005; Cunha et al., 2006; Viana et al., 2007; Oliveira et al., 2011). According to the results found in the present study, spray nozzles must be selected based on the target coverage requirements for an efficient spraying.
Conclusions
1. The ceramic spray nozzles and working pressures used increased the spray deposition band. The spray volume distribution can be adjusted by changing the spacing between ATR-1.0 nozzles, however, this was not possible when using TVI-800075 nozzles spaced 0.4 m apart.
2. The diameter of droplets generated by ATR-1.0 and TVI-800075 nozzles decreases with increasing working pressure.
3. ATR-1.0 nozzles improved the spray coefficient of homogeneity and target coverage when using working pressure of 700 kPa.
4. ATR-1.0 spray nozzles generated the highest percentage of drift-prone droplets at the highest working pressure (700 kPa).
Acknowledgements
The authors thank the Brazilian Coordination for the Improvement of Higher Education Personnel (CAPES) for granting scholarship to the first author.
Literature Cited
Alvarenga, C. B. de; Teixeira, M. M.; Zolnier, S.; Sasaki, R. S.; Rinaldi, P. C. N. Efficiency of the spray tip using hydraulic hollow cone from the spectral analysis of the droplets. Pesquisa Aplicada & Agrotecnologia, v.5, p.41-50, 2012.
ASAE - American Society of Agricultural Engineering. Spray nozzle classification by droplet spectra. St. Joseph: ASAE, 2004. p.411-414. ASAE Standard S572 FEB04
Baesso, M. M.; Teixeira, M. M.; Ruas, R. A. A.; Baesso, R. C. E. Tecnologias de aplicação de agrotóxicos. Revista Ceres, v.61, p.780-785, 2014. https://doi.org/10.1590/0034-737x201461000003
Chaim, A.; Maia, A. H. N.; Pessoa, M. C. P. Y. Estimativa da deposição de agrotóxicos por análise de gotas. Pesquisa Agropecuária Brasileira, v.34, p.963-969,1999. https://doi.org/10.1590/S0100-204X1999000600006
Cordeiro, A. M. C. Como a tecnologia de aplicação de produtos fitossanitários pode contribuir para o controle de pragas, doenças e plantas daninhas. In: Zambolim, L. (ed.). Manejo integrado: Fitossanidade, cultivo protegido, pivô central e plantio direto. Viçosa: UFV, 2001. Cap.6, p.683-721.
Cunha, J. P. A. R. da; Reis, E. F. dos; Santos, R. de O. Controle
químico da ferrugem asiática da soja em função de ponta de pulverização e de volume de calda. Ciência Rural, v.36, p.1360-1366, 2006. https://doi.org/10.1590/S0103-84782006000500003
Means followed by different uppercase letters in the rows or different lowercase letters in the columns differ statistically by the Tukey's test at 0.05 probability; ns Not significant (p > 0.05); *Significant at 0.05 probability by the F test
Pressure (kPa)
CH Coverage (%)
ATR TVI Media ATR TVI Media
500 2.1 2.7 2.4 a 7.6 1.8 4.7 c
600 1.9 2.6 2.2 a 8.2 3.0 5.6 b
700 1.8 2.0 1.9 b 9.5 3.3 6.4 a
Média 1.9 B 2.4 A 8.4 A 2.7 B
Nozzles 1.25* 196.0*
Error 1 0.10 15.17
Pressure 0.48* 13.57*
Nozzles*Pressure 0.14ns 0.51ns
Error 2 0.06 7.6
C.V. 1 14.32 12.42
C.V. 2 11.42 19.3
Cunha, J. P. A. R. da; Ruas, R. A. A.; Teixeira, M. M.Distribuição volumétrica de pontas de pulverização de jato plano cônico vazio com indução de ar analisadas em mesa de prova e simulação computadorizada. Revista Ceres, v.54, p.40-46, 2007.
Cunha, J. P. A. R. da; Silva, R. A. M. Uniformidade de distribuição
volumétrica de pontas de pulverização em função da pressão de trabalho e altura da barra. Bioscience Journal, v.26, p.52-58, 2010.
Ferreira, D. F. Sisvar: A guide for its bootstrap procedures in multiple comparisons. Ciência e Agrotecnologia, v.38, p.109-112, 2014. https://doi.org/10.1590/S1413-70542014000200001
Freitas, F. C. L.; Teixeira, M. M.; Ferreira, L. R.; Ferreira, F. A.;
Machado, A. F. L.; Viana, R. G. Distribuição volumétrica
de pontas de pulverização turbo teejet 11002 em diferentes condições operacionais. Planta Daninha, v.23, p.164-167, 2005. https://doi.org/10.1590/S0100-83582005000100019
Maciel, C. F. S.; Teixeira, M. M.; Fernandes, H. C.; Vitória, E. L. da; Cecon, P. R. Distribuição volumétrica e espectro de gotas das pontas hidráulicas LD 11002 e MAG-2. Revista Engenharia na Agricultura, v.25, p.183-199, 2017. https://doi.org/10.13083/ reveng.v25i3.671
Minguela, J. V.; Cunha, J. P. A. R. da. Manual de aplicação de
produtos fitossanitários. Viçosa: Aprenda fácil, 2010. 588p. Mota, A. A. B.; Antuniassi, U. R. Influência de adjuvantes no espectro
de gotas de ponta com indução de ar. Energia na Agricultura, v.28, p.1-5, 2013.
Nascimento, E. M. S.; Mion, R. L.; Dantas, M. J. F.; Viliotti, C. A.; Sombra,
W. A.;Pontas de pulverização de jato cônico vazio, em função das pressões de trabalho. Revista Brasileira de Ciências Agrárias, v.9, p.440-444, 2014. https://doi.org/10.5039/agraria.v9i3a3480 Nuyttens, D.; Baetens, K.; Schampheleire, M. de; Sonck, B. Effect of
nozzle type, size and pressure on spray droplet characteristics. Biosystems Engineering, v.97, p.333-345, 2007. https://doi. org/10.1016/j.biosystemseng.2007.03.001
Oliveira, V. A. B. de; Oliveira, G. M. de; Gigliotti, E. A.; Igarashi, W.
T.; Saab, O. J. G. A. Desempenho de bicos rotativos e hidráulicos
na aplicação aérea de fungicidas em cana-de-açúcar. Pesquisa Aplicada & Agrotecnologia, v.4, p.111-122, 2011.
Sasaki, R. S.; Teixeira, M. M.; Maciel, C. F. S.; Alvarenga, C. B.; Forastiere, P. R. Espectro das gotas produzidas por pontas de jato plano duplo defasado com indução de ar. Revista Engenharia na Agricultura, v.23, p.211-218, 2016. https://doi. org/10.13083/1414-3984/reveng.v24n3p211-218
Schneider, J. L.; Oliveira, G. M. de; Balan, R. E.; Canteri, M. G.; Saab, O. J. G. Cobertura de gotas de pulverização obtida com
diferentes pontas e taxas de aplicação na parte aérea da cana-de-açúcar. Ciência Rural, v.43, p.797-802, 2013. https://doi. org/10.1590/S0103-84782013000500007
Viana, R. G.; Ferreira, L. R.; Teixeira, M. M.; Cecon, P. R.; Freitas, F. C. L.; Quirino, A. L. S.; Santos, M. V. Características técnicas de
pontas de pulverização LA-1JC e SR-1. Planta Daninha, v.25,