The effect of magnesium on mitotic spindle formation in
Schizosaccharomyces pombe
Gulsen Uz
1and Aysegul Topal Sarikaya
1,21
Department of Molecular Biology and Genetics, Faculty of Arts & Sciences, Istanbul Yeni Yuzyil University,
Istanbul, Turkey.
2
Faculty of Medicine, Istanbul Yeni Yuzyil University, Istanbul, Turkey.
Abstract
Magnesium (Mg2+
), an essential ion for cells and biological systems, is involved in a variety of cellular processes, in-cluding the formation and breakdown of microtubules. The results of a previous investigation suggested that as cells grow the intracellular Mg2+
concentration falls, thereby stimulating formation of the mitotic spindle. In the present work, we used a Mg2+
-deficientSchizosaccharomyces pombe strain GA2, in which two essential membrane Mg2+ transporter genes (homologs ofALR1 and ALR2 in Saccharomyces cerevisae) were deleted, and its parental strain Sp292, to examine the extent to which low Mg2+
concentrations can affect mitotic spindle formation. The twoS. pombe strains were transformed with a plasmid carrying a GFP-a2-tubulin construct to fluorescently label micro-tubules. Using the free Mg2+
-specific fluorescent probe mag-fura-2, we confirmed that intracellular free Mg2+ levels were lower in GA2 than in the parental strain. Defects in interphase microtubule organization, a lower percentage of mitotic spindle formation and a reduced mitotic index were also observed in the GA2 strain. Although there was interphase microtubule polymerization, the lower level of mitotic spindle formation in the Mg2+
-deficient strain sug-gested a greater requirement for Mg2+
in this phenomenon than previously thought.
Keywords: magnesium, microtubule, mitosis, mitotic spindle,Schizosaccharomyces pombe.
Received: September 23, 2015; Accepted: December 26, 2015.
Introduction
Magnesium (Mg2+) is the most abundant intracellular divalent cation in cells. Most of the Mg2+in cells is bound to nucleotides, proteins and phospholipids; only a small por-tion of the total Mg2+(~0.3-1.2 mM) is free in cells (Ro-mani and Scarpa, 2000). Magnesium plays a vital role as a cofactor for hundreds of enzymes and as a stabilizer for nu-cleic acids and biomembranes. The most studied function of Mg2+is its complexation with ATP4-(Mg-ATP2-). In this complex, Mg2+ facilitates transphosphorylation reactions that are crucial for signal transduction. Cellular prolifera-tion, which is a complex cellular process, starts with recep-tor-mediated mitotic signals and continues via phosphoryl-ation-based signal transduction that leads to cell cycle progression and subsequent mitosis. Magnesium (both ion-ized and bound forms) is involved in nearly every step of cellular proliferation, from its initiation via receptor-mediated mitotic signals to DNA replication, cytoskeletal re-arrangements, the formation of the mitotic spindle and cytokinesis (Wolf and Trapani, 2008).
In animals, Mg2+is important for muscle contraction, nerve impulse conduction and bone formation. Many dis-eases, such as hypertension, cardiovascular disease, tetany, seizures, depression, type 2 diabetes, metabolic syndrome, and osteoporosis, are associated with an impaired Mg2+ bal-ance (Musso, 2009). Cbal-ancer is also associated with an im-paired Mg2+balance. Several animal model studies demon-strated that Mg2+ has a protective effect during the early phases of some types of cancer that are induced by chemi-cals (Kasprzaket al., 1994; Moriet al., 1997; Patirogluet al., 1997). Epidemiological studies have also demonstrated an association between Mg2+deficiency and some types of human cancers (Chiuet al., 2010). A study in mice demon-strated that Mg2+ deficiency prevents primary tumor growth but increases metastases (Nasulewiczet al., 2004). Magnesium homeostasis is therefore vital to cells and is tightly controlled.
The intracellular Mg2+concentration is regulated by the uptake of Mg2+across the cell membrane, the efflux of Mg2+ from the cell and the storage of Mg2+ within orga-nelles, such as mitochondria, the endoplasmic reticulum and the nucleus (Limet al., 2011). A negative membrane potential inside the cell generates a driving force for Mg2+ uptake across the cell membrane via ion channels or
carri-Send correspondence to Gulsen Uz. Department of Molecular Biol-ogy and Genetics, Faculty of Arts & Sciences, Istanbul Yeni Yuzyil University, Yilanli Ayazma Caddesi, 34010 Cevizlibag/Istanbul, Turkey. E-mail: [email protected]
ers (Nishizawa et al., 2007). The CorA channel protein family is the major group of Mg2+ transporters in pro-karyotes and eupro-karyotes (Moomaw and Maguire, 2008). The prokaryotic CorA protein is responsible for the trans-port of Mg2+, as well as Co2+and Ni2+ions. The eukaryotic CorA protein family includes the yeast Alr1 and Alr2 pro-teins, which are located in the plasma membrane and re-sponsible for the transport of Mg2+and other cations (Co2+, Mn2+, Ni2+, Cu2+, Ca2+, La3+and Al3+). The other eukaryotic CorA protein family members are Mrs2 and Lpe10, which are located in the mitochondrial membrane and responsible for Mg2+transport (Buiet al., 1999). Unlike the other CorA homologs, the expression of the yeast Alr1 and Alr2 pro-teins was reported to be regulated by the Mg2+supply; how-ever the mechanism that underlies this regulation remains unknown (Graschopfet al., 2001).
The role of Mg2+in cellular proliferation and the cell cycle has been studied in yeasts. Yeast cells grown in low Mg2+medium showed growth arrest, an increase in the per-centage of cells in G0/G1 and G2/M and a decrease in the percentage of cells in S phase. In addition, the intracellular total Mg2+concentration decreased as the cells grew (Ru-bin, 1975; Walker and Duffus, 1980). The decrease in Mg2+ concentration was postulated to continue to a level that per-mitted tubulin polymerization and formation of the mitotic spindle, then shortly before cell division, a rapid Mg2+ in-flux occurred that raised the intracellular Mg2+to a concen-tration that caused breakdown of the mitotic spindle (Wal-ker and Duffus, 1980). However, additional studies on the mechanism of Mg2+uptake and its effect on tubulin in yeast are needed.
In this study, we investigated the effect of Mg2+on mitotic spindle formation in the model organism
Schizosaccharomyces pombe. To determine how the mi-totic spindle is affected by a Mg2+deficiency and availabil-ity, we used a mutant strain of S. pombe in which two essential genes that are responsible for membrane Mg2+ transport were deleted and compared this strain with the control parental strain. We introduced a GFP-taggeda2 tubulin expression plasmid (pDQ105) intoS. pombestrains to visualize microtubules and we used the mag-fura-2 AM probe to determine the intracellular free Mg2+ concentra-tion. The polymerization of mitotic microtubules was as-sessed in Mg2+-deficientS. pombeand in the control strain. We also examined whether the influx of Mg2+influenced division in theS. pombestrains.
Material and Methods
Strains, growth media and standard methods
The S. pombe strains Sp292 (leu1-32 ura4-D18 ade6-M210 h-), which was used as a control, and GA2 (DSPAC17A2.14 DSPBC27B12.12 leu1-32 ura4-D18 ade6-M216 kanr), a Mg2+-deficient strain, were used. Stan-dard YEL- and YEA-rich yeast extract media (Gutzet al.,
1974) were used to cultivate the Sp292 strain, and Mg2+ -supplemented yeast extract medium (YEL containing 75 mM MgCl2; YEA containing 200 mM MgCl2) were
used to cultivate the GA2 strain. The number of cells in yeast suspensions was determined by measuring the optical density at 595 nm (OD595) and comparing the results to a standard curve. Generation times and numbers were deter-mined. The PDQ105 plasmid that carries a GFP-tagged
a-tubulin was a kind gift from Dr. Da-Qiao Ding (National Bioresource Project, Yeast Genetic Resource Center, Osaka, Japan). The yeast strains were transformed with the PDQ105 plasmid using a standard method (Morenoet al., 1991). For Sp292, the minimal media MMA and MML (Gutzet al., 1974) supplemented with adenine and uracil (225 mg/liter) were used as selective media for the trans-formants. For the GA2 strain, 200 mM MgCl2was added to
MMA and 75 mM MgCl2was added to MML, in addition
to adenine and uracil.
Determination of free intracellular magnesium (Mg2+
) inS. pombestrains using ratiometric imaging
The experimental protocol was done as described by Zhanget al. (1997), with some modifications. Briefly, 1 mL of cell suspension from mid-log phase cultures (0.5-1x10⁷ cells/mL) of Sp292 and GA2 that expressed GFP-tagged a-tubulin was washed twice with 1 mL of Tris-HCl buffer solution (10 mM Tris-HCl, pH 7.6, con-taining 10 mM glucose and 135 mM NaCl), and the cells were suspended in 1 mL of Tris-HCl buffer. The loading fa-cilitator Pluronic F-127 was added at a final concentration of 15mmol/L and the solution was mixed. The Mg2+ -spe-cific, membrane permeable probe mag-fura-2 AM was added at a final concentration of 5 mmol/L in Tris-HCl buffer and the cells were incubated at 30 ºC for 2 h. The cells were washed twice with Tris-HCl buffer to remove excess dye and incubated in Tris-HCl buffer for an addi-tional 30 min to allow complete hydrolysis of the dye. To immobilize the cells prior to ratiometric imaging, the Petri dishes were coated with concanavalin A (con A; 1 mg/mL), prior to the addition of 1 mL of cell suspension containing cells loaded with mag-fura-2 AM. Ratiometric imaging was done using an Olympus 1x71 inverted epifluorescence microscope (KeyMed Ltd., United Kingdom). Mag-fura-2-loaded and GFP-taggeda-tubulin-expressing cells were identified using MetaFluor 6.2r4 software (Molecular De-vices, Sunnyvale, CA, USA). Fluorescence intensities at an emission wavelength of 510 nm were recorded at 340 (200 ms) and 380 (30 ms) nm excitation wavelengths for mag-fura-2 and a 470 nm excitation wavelength for GFP. The in-tensities were recorded at 2-minute intervals using a CCD camera (Photometrics Coolsnap HQ, USA). Ratio values were obtained from the mag-fura-2 loaded cells. To deter-minate the absolute values of intracellular free magnesium ([Mg2+]i) in the cells according to the formula described by
Petri dishes containing mag-fura-2-loaded cells. MgCl2
was added to final concentrations of 1, 10, 30 and 60 mM (max) to determine the Rmax, and EDTA was added to
con-centrations of 10, 20, 30, 40, 50, 60 and 80 mM to remove all Mg2+from the media and determine the Rmin. The ratio
values were obtained for 10 cells of each strain, and the mean±SEM values were calculated to determine the statis-tical significance of the observed differences using an un-pairedt-test (GraphPad Software, Inc., USA).
In vivofluorescence imaging of microtubules
Sp292 cells carrying the PDQ105 plasmid (Dinget al., 1998) were grown in selective minimal medium supple-mented with adenine and uracil (225 mg/L). For the GA2 strain, 75 mM MgCl2was added to MML medium, in
addi-tion to adenine and uracil. To observe chromosomes and microtubules simultaneously in log phase cells, Hoechst33342 was added to the culture medium (final con-centration - 10mg/mL) and incubated for 30 min at 30 ºC. Cells that expressed GFP-tagged a-tubulin and stained with Hoechst33342 were transferred to Petri dishes coated with concanavalin A (1 mg/mL) and observed with an Olympus 1x71 inverted epifluorescence microscope using GFP and DAPI filters.
Results and Discussion
Measurement of intracellular free Mg2+
using mag-fura-2
Mag-fura-2 probe-loadedS. pombecells were chosen to determine the intracellular free Mg2+concentration using MetaFluor 6.2r4 software. The fluorescence intensity at 340 nm and 380 nm and the fluorescence ratio values (i.e., 340/380 nm) were acquired.In situcalibration was done to allow calculation of the intracellular free Mg2+ concentra-tion according to Formula 1 described by Grynkiewiczet al.(1985).
[Mg ] K F F
R R
R R
2 d
0
S
min
max
+ = é
ë ê ù
û úé -
-ë
ê ù
û
ú (1)
where R is the ratio of the fluorescence intensity at 340:380 nm, Rminis the same ratio in the absence of Mg2+, Rmaxis the
same ratio with a maximum Mg2+concentration, KDis the
dissociation constant of the mag-fura-2/Mg2+complex, and F0and FSare the fluorescence intensities at 380 nm in the
absence of Mg2+and saturated with Mg2+, respectively. The Rmin, Rmax, F0and FSvalues, which are necessary
for calculating the intracellular free Mg2+ concentration, could not be determined. For this reason, the intracellular free Mg2+concentration could not be calculated. Duringin situcalibration, when the extracellular Mg2+concentration was increased to 1, 10, 20 and 30 mM, the fluorescence ra-tio values were only slightly increased (Supplemental Fig-ure S1). (Ratio values for the intracellular Mg2+
concentration were not included in the manuscript because the values were for calibration). The ratio values for in-creased levels of Mg2+and EDTA are included as a supple-mental figure) During attempts to obtain the Rmin value,
when EDTA was added to concentrations of 5, 50, 100 and 200 mM, the ratio values were only slightly decreased (Supplemental Figure S2). These findings suggested that fission yeasts have a unique transport system and that Mg2+ transport is tightly regulated (Zhanget al., 1997).
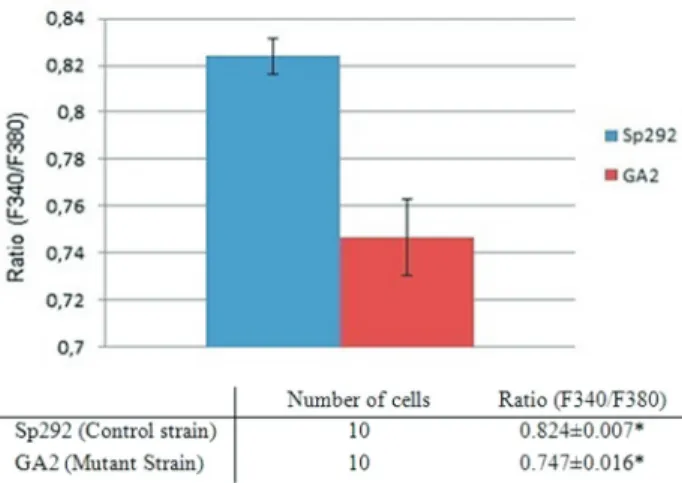
The fluorescence intensity levels at 340 nm and 380 nm were reduced after 30-40 min. However, at the begin-ning of the experiments, the fluorescence intensity levels were constant for 10-20 min. During this time period, the ratio values, which indicate intracellular free Mg2+levels, of Sp292 (the control strain) and GA2 (the Mg2+transport system-deficient strain) were compared. The ratio values of GA2 cells were significantly lower than those of Sp292 cells (Figure 1).
Reductions in the fluorescence intensity at 340 nm and 380 nm suggested that theS. pombecells were pumping the probe out of the cell. However, because mag-fura-2 is a ratiometric probe, the fluorescence signals of the pro-be/Mg2+complex are independent of the probe concentra-tion (Barreto-Chang and Dolmetsch,2009). In view of this property of the mag-fura-2 probe, ratio values, which indi-cate free Mg2+levels, were compared between the control and mutant strains ofS. pombe. However, the ratio values increased over time as the fluorescence intensity decreased over time. For this reason, the cells that had the lowest ratio values were analyzed.
Dividing S. pombe cells have a septum during the G1-S phase of the cell cycle. Sp292 cells containing a sep-tum (i.e., cells in the G1-S phase) were analyzed and com-pared with cells in the G2-M phase of the cell cycle. The
Figure 1- Comparison of the ratio values of the Sp292 and GA2 strains. Sp292 cells were incubated with YEL and GA2 cells were incubated with YEL supplemented with 75 mM MgCl2. The cells were harvested during
ratio values of G1-S and G2-M phase cells were not signifi-cantly different (Supplemental Figure S3). (It was techni-cally difficult to compare ratio values in G1-S and G2-M for both strains because septum formation was very low in the GA2 strain, making it hard to determine the cell cycle stage in GA2. Nevertheless, the ratio values of the G1-S and G2-M phase in the parental strain are provided in Sup-plemental Figure S3. The ratio values ranged from 0.8-1.0 during different phases of the cell cycle (S3). This finding suggested that differences exist between the early and late phases of G1-S or G2-M. Previous studies have also shown that intracellular free Mg2+levels vary at different stages of the cell cycle (Walker and Duffus, 1980; Zhang et al., 1997).
The hypothesis that a Mg2+influx occurs before chro-mosome segregation was investigated (Walker and Duffus, 1980). To determine whether a Mg2+influx occurred in di-viding Sp292 cells that had a healthy Mg2+transport sys-tem, ratio values were tracked in cells during cell division and at different stages of cell division. Differences in the ra-tio values ranged from 0.8-1.0, suggesting that a Mg2+ in-flux may have occurred in G1-S or G2-M; in contrast, the ratio values at different stages of cell division were not sig-nificantly different from each other. However, since we did not use synchronized cells in our experiments additional studies using cells synchronized in the G2 phase are needed to test this hypothesis.
The effect of intracellular free Mg2+
on mitotic spindle formation
In this study, we aimed primarily to observe fluores-cently labeled free Mg2+ in GFP-tagged microtubule-expressing cells in different phases of the cell cycle. How-ever, no GFP-tagged microtubules were observed in mag-fura-2 probe-loadedS. pombecells. This finding indicated either that GFP-tagged microtubules are sensitive to mag-fura-2 or that mag-mag-fura-2 had a quenching effect on GFP. Because GFP-tagged microtubules could not be observed in cells containing fluorescently labeled free Mg2+, a yeast strain in which the Mg2+transport was deleted (GA2) was analyzed to determine how Mg2+deficiency affected for-mation of the mitotic spindle. For this purpose, mitotic spindle formation in a Mg2+-deficient strain that expressed GFP-tagged a2-tubulin was compared with the control strain. In addition, the percentage of cells that generated a mitotic spindle was analyzed in both strains. Initially, we observed defective organization of the interphase micro-tubules in the GA2 strain (Figure 2). Since the microtubular cytoskeleton is important for normal cell morphology in fission yeast (Mata and Nurse, 1997; Beinhauer et al., 1997), GA2 cells were also defective in cell morphology.
The mitotic index was lower in the Mg2+-deficient GA2 strain than in Sp292, as expected. Magnesium restric-tion can result in failure to divide in fission yeast cells (Walker and Duffus, 1980). Because Mg2+is involved in
mitotic signals that are mediated by DNA synthesis, the formation of the mitotic spindle and cytokinesis, it is very important to determine how a Mg2+deficiency affects cell division and the mitotic index. Consequently, the Mg2+ transport system-deficient mutant strain GA2 is a useful model system for elucidating the relationship between Mg2+and the mitotic spindle.
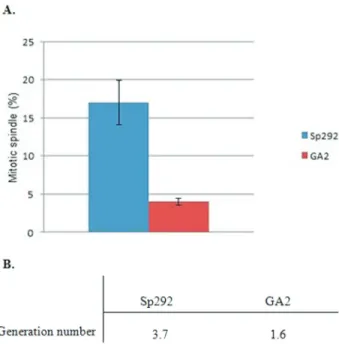
After counting the number of mitotic spindle-carrying cells in relation to dividing cells, the percentage of cells with a mitotic spindle was estimated and compared between GA2 and Sp292 cells. The percentage of cells with a mitotic spindle was lower in GA2 cells than in Sp292 cells (Figure 3A). Generation numbers in logarithmic phase were also calculated using a standard formula (Formula 2) (Boyd, 1984). GA2 cells were estimated to divide approxi-mately once, while Sp292 cells divided three times (Figure 3B). The reduced percentage of mitotic spindles and the number of generations in the Mg2+-deficient GA2 strain suggested that a Mg2+deficiency reduced the mitotic spin-dle formation and therefore the generation number (i.e., the mitotic index was lower in GA2 cells than in Sp292 cells).
Generation number (n) logN logN log2
2 1
= - (2)
where N2= Number of cells in culture at the end of the
loga-rithmic phase and N1= Number of cells present in culture at
the beginning of the logarithmic phase
We also investigated whether chromosome segrega-tion occurred in GA2 cells. Nuclear images revealed that most Mg2+ -deficient GA2 cells were elongated (Supple-mental Table S1), had no division septum and were mono-nucleated (Figure 4A). In contrast, Sp292 cells were small and mononucleated, which is characteristic of fission yeast cells during the stationary phase (Figure 4B). Our findings are consistent with those of Walker and Duffus (1980) in which a Mg2+deficiency was generated by removing Mg2+ from the growth medium. The culture medium for the
Mg2+-transport system-deficient strain GA2 was supple-mented with 75 mM MgCl2. This supplementation was
nec-essary because GA2 cells cannot divide even once without Mg2+supplementation. However, Mg2+supplementation of GA2 cells only supports a single division and increasing the Mg2+concentration to > 75 mM does not increase the gen-eration number of GA2.
Figure 4A shows elongated GA2 cells with mono-nuclei; this finding suggests that chromosomal segregation did not occur due to reduced mitotic spindle formation. In contrast, our observations revealed that more Mg2+was re-quired for spindle formation than for the polymerization of
interphase microtubules. However, the defective organiza-tion of interphase microtubules also demonstrated that Mg2+ is important for the intactness of interphase micro-tubules or cytoplasmic micromicro-tubules.
Previous work has shown that Mg2+restriction causes most mammalian cells to be arrested first in the S phase and then in the G2/M phase of the cell cycle (Wolf and Trapani, 2008). However, the presence of elongated GA2 cells with mononuclei showed that these cells could not pass the G2/M phase of cell cycle. This finding suggests that Mg2+ deficiency has different effects on the cell cycle in fission yeasts. In addition, the observed cell cycle arrest at G2/M in GA2 cells may have occurred at the spindle-assembly checkpoint. However,SPAC17A2.14, which is a homolog of theS. cerevisiaeMg2+transporterALR1, was reported to interact with the Sad1 protein, which is a component of the microtubule-organizing center (MTOC) (Mikiet al., 2004). Sad1 was previously demonstrated to be essential for spin-dle formation and elongation (Hagan and Yanagida, 1995). Consequently, deletion of the genes that are responsible for Mg2+transport may have affected many cellular pathways. Future work will seek to identify these cellular pathways by using the Mg2+-deficient mutant strain as a model system.
Acknowledgments
We thank Prof. Michael Whitaker, Dr. Simon White-hall and Dr. Mark Levasseur (Institute for Cell and Molecu-lar Biosciences, Faculty of Medical Sciences, Newcastle University, Newcastle upon Tyne, UK) for providing labo-ratory equipment and invaluable assistance, and Dr. Da-Qiao Ding for providing the PDQ105 plasmid (Kobe Ad-vanced ICT Research Center, Kobe, Japan). This research was supported by the Istanbul University Research Fund (project BAP8001).
Figure 3- Comparison of the percentage of mitotic spindles and genera-tion number in Sp292 and GA2 cells. A. Percentage of GA2 and Sp292 cells with a mitotic spindle during the log phase. At least 100 GFP-tagged a-tubulin-expressing cells were counted. B. Generation numbers for Sp292 and GA2.
References
Barreto-Chang OL and Dolmetsch RE (2009) Calcium imaging of cortical neurons using Fura-2 AM. J Vis Exp 23:1067. Beinhauer JD, Hagan IM, Hegemann JH and Fleig U (1997)
Mal3, the fission yeast homolog of the human APC-inte-racting protein EB-1 is required for microtubule integrity and the maintenance of cell form. J Cell Biol 139:717-728. Boyd RF (1984) General Microbiology. Times Mirror/Mosby
College Publishing, St. Louis, 829 pp.
Bui DM, Gregan J, Jarosch E, Ragnini A and Schweyen RJ (1999) The bacterial magnesium transporter CorA can functionally substitute for its putative homologue Mrs2p in the yeast in-ner mitochondrial membrane. J Biol Chem 274:20438-20443.
Chiu HF, Tsai SS, Wu TN and Yang CY (2010) Colon cancer and the content of nitrate and magnesium in drinking water. Mag Res 23:81-89.
Ding DQ, Chikashige Y, Haraguchi T and Hiraoka Y (1998) Os-cillatory nuclear movement in fission yeast meiotic prophase is driven by astral microtubules, as revealed by continuous observation of chromosomes and microtubules in living cells. J Cell Sci 111:701-712.
Graschopf A, Stadler JA, Hoellerer MK, Eder S, Sieghardt M, Kohlwein SD and Schweyen RJ (2001) The yeast plasma membrane protein Alr1 controls Mg2+homeostasis and is subject to Mg2+dependent control of its synthesis and degra-dation. J Biol Chem 276:16216-16222.
Grynkiewicz G, Poenie M and Tsien RY (1985) A new generation of Ca2+indicators with greatly improved fluorescence prop-erties. J Biol Chem 260:3440-3450.
Gutz H, Heslot H, Leupold U and Loprieno N (1974)
Schizosaccharomyces pombe.In: King RC (ed) Handbook of Genetics. Plenum Press, New York, pp. 395-446. Hagan I and Yanagida M (1995) The product of spindle formation
gene sad1+ associates with the fission yeast spindle pole body and is essential for viability. J Cell Biol 129:1033-1047.
Kasprzak KS, Diwan BA and Rice JM (1994) Iron accelerates while magnesium inhibits nickel-induced carcinogenesis in the rat kidney. Toxicology 90:129-140.
Lim PH, Pisat NP, Gadhia N, Pandey A, Donovan FX, Stein L, Salt DE, Eide DJ and Macdiarmid CW (2011) Regulation of Alr1 Mg transporter activity by intracellular magnesium. PLoS One 6:e20896.
Mata J and Nurse P (1997) Tea1 and the microtubular cyto-skeleton are important for generating global spatial order within the fission yeast cell. Cell 89:939-949.
Miki F, Kurabayashi A, Tange Y, Okazaki K, Shimanuki M and Niwa O (2004) Two-hybrid search for proteins that interact with Sad1 and Kms1, two membrane-bound components of the spindle pole body in fission yeast. Mol Genet Genomics 270:449-461.
Moomaw AS and Maguire ME (2008) The unique nature of Mg2+ channels. Physiology (Bethesda) 23:275-285.
Moreno S, Klar A and Nurse P (1991) Molecular genetic analysis of Schizosaccharomyces pombe. Methods Enzymol 194:795-782.
Mori H, Tanaka T, Sugie S, Yoshimi N, Kawamori T, Hirose Y and Ohnishi M (1997) Chemoprevention by naturally occur-ring and synthetic agents in oral, liver and large bowel carcinogenesis. J Cell Biochem 27(Suppl):35-41.
Musso CG (2009) Magnesium metabolism in health and disease. Int Urol Nephrol 41:357-362.
Nasulewicz A, Wietrzyk J, Wolf FI, Dzikir AS, Madej J, Maier JA, Rayssiguier Y, Mazur A and Opolski A (2004) Magne-sium deficiency inhibits primary tumor growth but favors metastasis in mice. Biochim Biophys Acta - Mol Basis Dis 1739:26-32.
Nishizawa Y, Morii H and Durlach J (eds) (2007) New Perspec-tives in Magnesium Research Nutrition and Health. Sprin-ger-Verlag, London, 405 pp.
Patiroglu T, Sahin G, Kontas O, Uzüm K and Saraymen R (1997) Protective effect of magnesium supplementation on experi-mental 3-methyl cholanthrene-induced fibrosarcoma and changes in tissue magnesium distribution during carcino-genesis in rats. Biol Trace Elem Res 56:179-185.
Romani AM and Scarpa A (2000) Regulation of cellular magne-sium. Front Biosci 5:720-734.
Rubin H (1975) Central role for magnesium in coordinate control of metabolism and growth in animal cells. Proc Natl Acad Sci USA 72:3551-3555.
Walker GM and Duffus JH (1980) Magnesium ions and the con-trol of the cell cycle in yeast. J Cell Sci 42:329-356. Wolf FI and Trapani V (2008) Cell (patho)physiology of
magne-sium. Clin Sci 114:27-35.
Zhang A, Cheng TP, Wu XY, Altura BT and Altura BM (1997) Extracellular Mg2+regulates intracellular Mg2+and its sub-cellular compartmentation in fission yeast,
Schizosaccharomyces pombe. Cell Mol Life Sci 53:69-72.
Supplementary Material
The following online material is available for this article: Figure S1 - Ratio values for intracellular Mg2+after increasing
extracellular Mg2+.
Figure S2 - Ratio values for intracellular Mg2+after EDTA addi-tion.
Figure S3 - Ratio values for the G1-S and G2-M phase.
Table S1 - Comparison of cell length (mm) between Sp292 and GA2 cells
Associate Editor: Juan Lucas Argueso Almeida