Printed version ISSN 0001-3765 / Online version ISSN 1678-2690 http://dx.doi.org/10.1590/0001-3765201820170838
www.scielo.br/aabc | www.fb.com/aabcjournal
Immunophenotyping lymphocyte and acute phase proteins
in canine X-linked muscular dystrophy
DILAYLA K. DE ABREU1
, JANAINA M. MONTEIRO2
, CAROLINA C. SOUZA1
, RAFAEL G. KARAM1, RENATA A. FERNANDES1, THAIS B. LESSA1, JOSÉ J. FAGLIARI3,
MARIA ANGELICA MIGLINO1
and CARLOS EDUARDO AMBROSIO4
1Departamento de Cirurgia, Faculdade de Medicina Veterinária e Zootecnia/FMVA, Universidade de São Paulo/ USP, Av. Prof. Dr. Orlando Marques de Paiva, 87, Cidade Universitária, 05508-270 São Paulo, SP, Brazil
2
Centro de Pesquisa Experimental, Hospital Israelita “Albert Einstein”, Av. Albert Einstein, 627/701, Morumbi, 05652-900 São Paulo, SP, Brazil
3
Departamento de Clínica e Cirurgia, Faculdade de Ciências Agrárias e Veterinárias, UNESP/Jaboticabal, Via de Acesso Professor Paulo Donato Castelane, s/n, Vila Industrial, 14884-900 Jaboticabal, SP, Brazil 4
Departamento de Medicina Veterinária, Faculdade de Zootecnia e Engenharia de Alimentos/FZEA, Universidade de São Paulo/USP, Av. Duque de Caxias, 225, Campus da USP, 13635-900 Pirassununga, SP, Brazil
Manuscript received on December 20, 2017; accepted for publication on March 26, 2018
ABSTRACT
Duchenne Muscular Dystrophy (DMD) is the most common X-linked muscular disease affecting humans. The Golden Retriever Muscular Dystrophy model (GRMD) is consider the most suitable for several studies. This assay aims to quantify lymphocyte subpopulations CD4, CD5, and CD8, and standardize, the serum electrophoretic profile, to understand their contribution to the pathologic process in normal Golden Retriever dogs (GR group) and dystrophic´s (GRMD group), through the umbilical cord blood, in dogs aged from 2 to 3 months (GR II and GRMD II), and in dogs over 1 year of age (GR III and GRMD III). No significant differences were observed between the CD8+ lymphocyte subpopulations of the groups studied. The CD4+ and CD5+ lymphocyte subpopulations were significantly higher in the GRMD III group compared to the GR III group. Twenty-two different proteins in the gel were identified. The serum concentrations of the proteins belonging to the GR I and GRMD I groups were significantly lower than those of the other groups. We show that expression of acute phase proteins are worst during the aging of the dogs. We hope to expand knowledge to better understand the GRMD model and the translational data.
Key words: Acute phase protein, Dystrophic model, Immune behavior, Inflammatory response, Muscular dystrophy, Serum protein.
Correspondence to: Carlos Eduardo Ambrósio E-mail: [email protected]
INTRODUCTION
Duchenne Muscular Dystrophy (DMD) is a
neuromuscular alteration that can be hereditary
in humans via recessive inheritance linked to the
X chromosome, and it affects approximately one
al. 2005). Without dystrophin, the muscle becomes more susceptible to exercise-related injuries as
evidenced by the rapid influx of calcium and the
subsequent activation of proteases (Valentine et al. 1990).
As a result, muscular inflammation, necrosis
and the replacement of muscle tissue with fibrous and adipose tissue may occur, resulting in progressive muscle loss of both skeletal and cardiac muscle and damage to the nervous system (Valentine et al. 1990). Although these mutations are responsible for defects underlying the pathology
of muscular dystrophies, other factors significantly
contribute to the pathology, such as the involvement and activation of the immune system, leading to more changes in muscle homeostasis in addition to mechanical weakness.
The inflammatory process likewise alters cellular populations that work in the immune system by mediating the activation and directed migration
of a number of cell populations, chiefly neutrophils
and macrophages, from the blood stream to the
locations of the injuries. Thus, the inflammatory
process is vital because it guarantees that defensive cells and molecules rapidly concentrate in the damaged tissue (Abbas et al. 2008).
Many studies are underway that aim to correlate lymphocyte subpopulations with various
pathologies. In fact, T CD4+ lymphocytes play
a central role in immune protection. In humans and mice, various subpopulations of lymphocytes – CD4+ - Th and CD4+ - Treg – that support the immune response have been described. Recent studies provide preliminary information about the
activity of inflammatory cells and skeletal muscle following acute skeletal damage. Specific antigens
present to T and B lymphocytes play a critical role in the initial and progressive inflammatory myopathies (Marinaro et al. 2010).
According Jakubzick et al. (2004), the IL-4 and IL-3 subpopulations of Th2 cytokines are
potent fibrogenic factors, and the Th lymphocyte
population may be involved in the late stages of
DMD, in which fibrosis is prominent. In addition,
regulatory T lymphocytes include cells that actively produce TGF-beta, another molecule with fibrotic action that is additionally known to limit the recruitment of myogenic precursor cells, complicating the repair of muscle damage
(Filvaroff et al. 1994).
In more severe forms of muscular dystrophy, such as DMD, the proliferation and activation of cells that act on inflammation are accentuated; however, the pool of cells responsible for regeneration is quickly exhausted, and the damaged skeletal muscle is progressively replaced by fat and
fibrous tissue (Emery 2002).
Although Tregs were largely absent in the muscle of wild-type mice and normal human muscle, with necrotic lesions and increasing of expression of interleukin-10 (IL-10) in mdx mice if we have a depletion of Tregs, the muscle injury and
the severity of muscle inflammation is increased.
Tregs modulate the progression of disease in MDX mice (Villalta et al. 2014).
The Golden Retriever Muscular Dystrophy (GRMD) dog is the animal model that is most similar to human DMD. Because it is genetically homologous, it shares the human profile of severe myopathy and lethal clinical development. Clinically, it is characterized by severe alterations in the skeletal musculature that result in the early
death of the affected individual. GRMD is used
as an experimental model for studies of new therapeutic proposals and for studies (Yang et al. 2012) aiming to improve the understanding of the pathophysiology of the disease (Collins and
Morgan 2003). Future studies of different cellular
FLOW CYTOMETRY - IMMUNOPHENOTYPING AND QUANTIFICATION OF LYMPHOCYTES
The collected blood was diluted in PBS (phosphate
buffer solution) and deposited on a Ficoll-Paque®
density gradient. The gradient was centrifuged at 400 x G for 20 minutes at 20°C to separate mononuclear cells at the 1077 interface. These cells were washed in PBS, and the cellular concentration and viability were then determined using Trypan Blue. The cells were then adjusted to 1x10⁶ cells per mL and incubated for 30 minutes in 1 µL of primary
monoclonal anti-CD4 (Novus Biologicals®), anti-CD5 (Novus Biologicals®) and anti-CD8 (Novus Biologicals®) antibodies. The cells were
then washed twice in PBS and incubated with the secondary monoclonal antibody conjugated with
anti-IgG1 and anti-IgG2a FITC (BioLegend®) for
30 minutes while protected from the light. Next, the cells were washed once again with PBS and
acquired using the flow cytometer (FacsCalibur – BD®). For this assay, we acquired 50,000 events, and the analysis was performed using the FlowJo®
software.
ELECTROPHORESIS OF SERUM PROTEINS
The polyacrylamide gel required for electrophoretic fractionation using the SDS-PAGE technique important to understand how the inflammatory
response occurs in this experimental model and how the immune system behaves in response to tissue injury.
Despite the importance of this model of
muscular dystrophy, we lack defined parameters
for acute phase proteins and immunoglobulins as well as lymphocyte immunophenotyping for GRMD, which would assist us in understanding the
muscular inflammatory response that results in the
necrosis and substitution of this tissue. We followed our previous approach using morphological tools to
characterize different phenotypes in GRMD dogs
(Ambrosio et al. 2009, Gaiad et al. 2011, Araujo et al. 2013). In addition, we are to show some expression of these cells since birth of GRMD dogs until adult age starting among 10 months.
MATERIALS AND METHODS
EXPERIMENTAL GROUPS
Our GRMD facilities (Kennel GRMD-Brazil) are located at São Paulo University, Faculty of Veterinary Medicine and Animal Science. Our experiment was approved by Veterinary Ethic Committee for right use of experimentation animals at same Institution, protocol number 1640/2009. Our plan was to study normal Golden Retriever dogs (GR group) and Golden Retriever dogs
affected by muscular dystrophy (GRMD group).
Each group (Table I) consisted of three subgroups allocated according to age: umbilical cord blood from neonate animals (GR I n=7 and GRMD I n=4), peripheral blood from young animals between 2 and 3 months of age (GR II n=7 and GRMD II n=4) and peripheral blood from adult animals (GR III n=14 and GRMD III n=14). Due to the small volume of blood obtained from the umbilical cords, it was not possible to evaluate lymphocyte immunophenotyping parameters for groups GR I and GRMD I.
TABLE I
Number of animals per group, separated in GR (Golden
Retriever normal) and GRMD (Golden Retriever affected
by muscular dystrophy). See Ambrosio et al. 2009 for phenotype description and age correlation.
GROUP GR GRMD
I - NEONATE ANIMALS 7 4
II - YOUNG ANIMALS
(2 - 3 MONTHS) 7 4
III - ADULT ANIMALS (STARTING 10
MONTHS)
was prepared using 15 mL of distilled water; 3.0 mL of 2 M tris-base / 1 M glycine, pH 9.0; 7.5 mL of 40% polyacrylamide; 1.5 mL of 2% bis-acrylamide; 1.5 mL of glycerol; 0.6 mL of 0.5 M ethylenediaminetetraacetic acid, pH 8.3 and 0.6 mL of sodium dodecyl sulfate (SDS). The gel polymerization was induced by the addition of 15.0 µL of tetramethylethylenediamine (TEMED) and 0.3 mL of 10% ammonium persulfate. The plate containing the gel was placed on an appropriate support in contact with an upper vat that contained
buffer solution at pH 8.5. A 5 uL aliquot of this
sample was deposited on the gel and subjected to an electrical current of 50 mA from an appropriate source. Once the separation was completed, the gel was stained and destained (Figure 1). The molecular weights and concentrations of the protein fractions were determined by densitometry (Shimadzu
CS-9301 densitometer). For the accurate identification
of the blood serum protein fractions, a standard
marker for molecular weights and purified proteins
was used for each electrophoresis run. From this point on, the values for each protein were converted to percentages relative to the total protein value for each dog.
ANALYSIS OF RESULTS
The results obtained were evaluated by analysis of variance and comparison of means using Student’s t test and for a variance scheme for repeated
measurements. In cases of significant differences,
the results were subjected to the Tukey test for means comparison with a level of probability of 5%. The Statistical Analysis System (SAS) was used for this analysis.
RESULTS
IMMUNOPHENOTYPING AND QUANTIFICATION OF LYMPHOCYTES
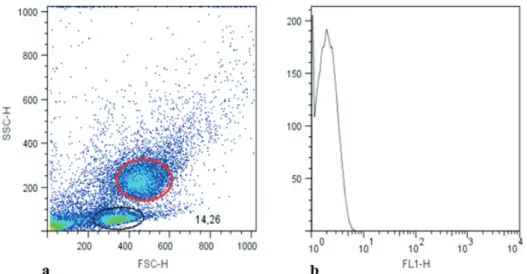
All of the dogs studied had lymphocyte concentrations within the limits of normality according to the leukocyte count. In the dot plot Figure 1 - Electrophoresis gel. Electrophoresis in a polyacrylamide gel containing sodium
inFigure 2, we show the gate, which refers to the population of lymphocytes in the dogs’ peripheral
blood that were identified using flow cytometry and
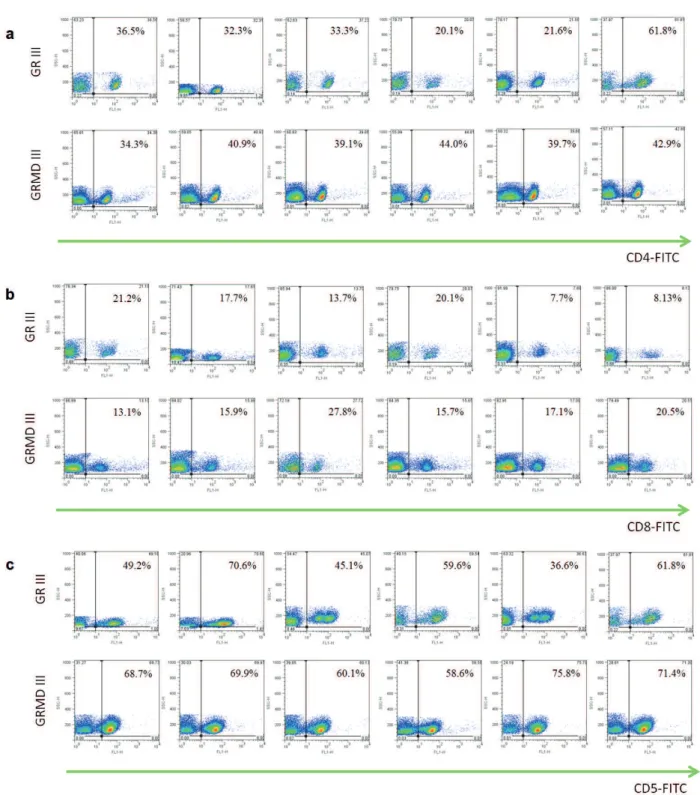
selected for immunophenotyping and lymphocyte quantification (Figure 3). When comparing the
averages, we observed no statistically significant differences between the CD8+ lymphocyte subpopulations of the groups studied. The CD4+ and CD5+ lymphocyte subpopulations were
significantly higher in the GRMD III group compared to the GR III group (Figure 4). The
CD4+ :CD8+ ratio for the GRMD III group was
greater than that of the GR III group (2.189 and 1.717, respectively) (Table II).
SERUM PROTEIN PROFILE
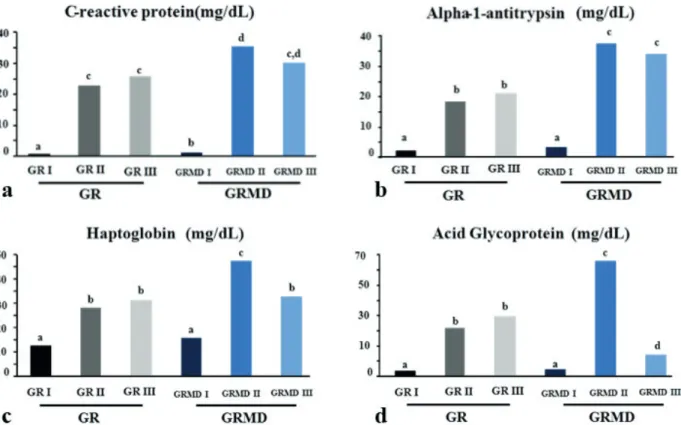
Table III, show the values for serum acute phase proteins obtained from the electrophoretic examination of blood from GR I, GRMD I, GR II, GRMD II, GR III and GRMD III dogs. The SDS-PAGE technique permitted the fractionation of 22 proteins, being 4 acute phase protein identified by name: C-reactive protein (MW 122,000 Da), alpha1 antitrypsin (MW 62,000 Da), haptoglobin
(MW 45,000 Da) and acid glycoprotein (MW 40,000 Da).
When examining the differences, and the make-up, between the groups, we considered age (between groups I, II and III) and disease status (GR and GRMD) as possible factors associated
with statistical significance.
The proteins whose showed alterations related to the disease were C-reactive protein, alpha-antitrypsin, haptoglobin and acid glycoprotein.
The serum concentrations of all proteins belonging to the GR I and GRMD I groups
were significantly lower than those of the other
groups. The only acute phase proteins that
differed significantly between the two groups was
C-reactive protein with the higher concentration observed in group GRMD I (Figure 5). Although
the difference in the concentration of this protein
was not significantly different between groups GRMD II and GRMD III, group GRMD III was more similar to groups GR II and GR III (Table II). As shown in Table II, the average serum levels for alpha-1-antitrypsin in groups GR II and
GR III did not differ significantly from each other but did differ significantly from groups GRMD II
Figure 2 - Dot plot graph. The Dot plot graph (a) shows the gate for monocytes (red circle) and the gate
for lymphocytes (black circle) from peripheral canine blood analyzed by flow cytometry and selected
Figure 3 - Lymphocyte immunophenotyping of blood of normal and affected by muscular dystrophy dogs. Immunophenotyping and
quantification of lymphocytes CD4+ (a), CD8+ (b) and CD5+ (c) isolated by gradient density from peripheral blood mononuclear
cells of normal and affected by muscular dystrophy dogs. Gate of lymphocytes of normal and affected dogs belonging to groups
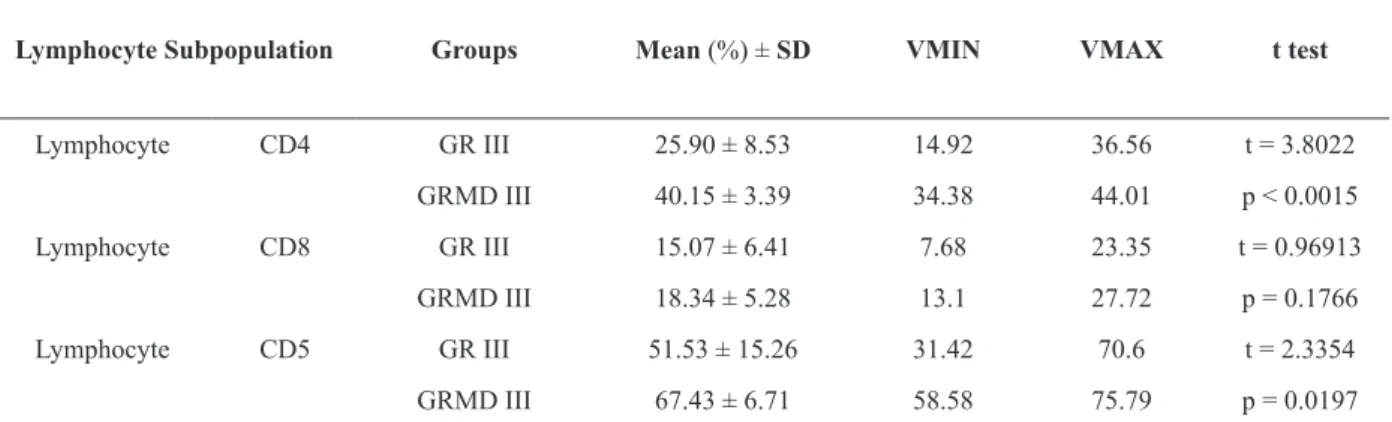
TABLE II
Immunophenotyping and quantification of lymphocytes. Means, standard deviations (SD), maximum values
(VMAX) and minimum values (VMIN) of concentrations (%) of lymphocyte subpopulations observed by lymphocyte immunophenotyping for CD4, CD5 and CD8 antibodies in animals in the GR III and GRMD III groups.
Lymphocyte Subpopulation Groups Mean (%) ± SD VMIN VMAX t test
Lymphocyte CD4 GR III 25.90 ± 8.53 14.92 36.56 t = 3.8022
GRMD III 40.15 ± 3.39 34.38 44.01 p < 0.0015
Lymphocyte CD8 GR III 15.07 ± 6.41 7.68 23.35 t = 0.96913
GRMD III 18.34 ± 5.28 13.1 27.72 p = 0.1766
Lymphocyte CD5 GR III 51.53 ± 15.26 31.42 70.6 t = 2.3354
GRMD III 67.43 ± 6.71 58.58 75.79 p = 0.0197
Figure 4 - Lymphocyte subpopulations isolated from the blood
of normal and affected by muscular dystrophy dogs. Graphic
representing the average concentrations gated of lymphocyte
subpopulations CD4+, CD8+ and CD5+ dogs belonging normal and affected by muscular dystrophy dogs GR III and
GRMD III, respectively.
and GRMD III, which showed the highest serum concentrations of this protein (Figure 5).
Haptoglobin was most highly expressed by animals in group GRMD II, and the average levels
in these animals differed significantly from animals
in the other groups. Groups GR II and GR III were
not significantly different. Similarly, group GRMD
II had the highest serum concentration for acid
glycoprotein, differing significantly from the other
groups. Groups GR II and GR III were statistically
similar to each other. Group GRMD III differed
significantly from the others, with the lowest serum
concentration (Table II; Figure 5).
In analyzing the proteins identified in the umbilical cord blood of affected and healthy animals, it is evident that the acute phase
proteins that differed significantly between these
spencergroups was C-reactive protein. For animals with ages between two and three months that were
either normal or affected by dystrophy, we note that the acute phase proteins that differed significantly
were an C-reactive protein, alpha-1-antitrypsin, haptoglobin, acid glycoprotein. Further, in adult
animals, whether affected or normal, we observed that the proteins that differed significantly were the
alpha-1-antitrypsin and acid glycoprotein.
DISCUSSION
The average absolute values obtained for serum proteins at birth were below levels reported in adult
animals, confirming data reported by Barsanti et
al. (1997). Similarly, the values found in our study
confirm the reports of Godoy et al. (2007), which
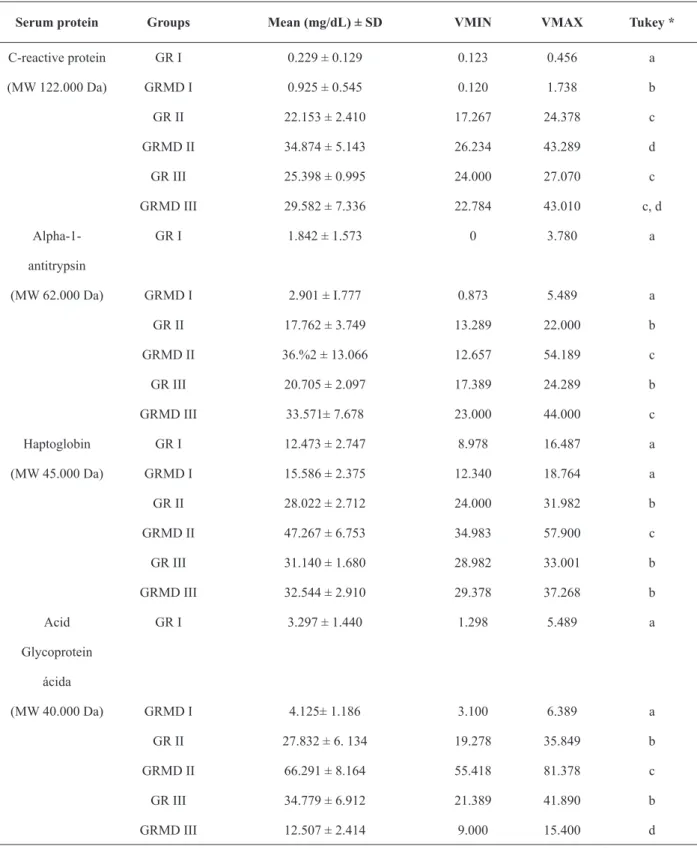
TABLE III
Acute phase serum protein profile. Means, standard deviations (SD), minimum values (VMIN) and maximum values
(VMAX) of serum levels of C-reative protein, alpha-1-antitrypsin, haptoglobin and acid glycoprotein obtained by fractionation using a polyacrylamide gel containing sodium dodecyl sulfate (SDS-PAGE) for groups GR I, GRMD I, GR
II, GRMD II, GR III and GRMD III.
Serum protein Groups Mean (mg/dL) ± SD VMIN VMAX Tukey *
C-reactive protein GR I 0.229 ± 0.129 0.123 0.456 a
(MW 122.000 Da) GRMD I 0.925 ± 0.545 0.120 1.738 b
GR II 22.153 ± 2.410 17.267 24.378 c
GRMD II 34.874 ± 5.143 26.234 43.289 d
GR III 25.398 ± 0.995 24.000 27.070 c
GRMD III 29.582 ± 7.336 22.784 43.010 c, d
Alpha-1- GR I 1.842 ± 1.573 0 3.780 a
antitrypsin
(MW 62.000 Da) GRMD I 2.901 ± I.777 0.873 5.489 a
GR II 17.762 ± 3.749 13.289 22.000 b
GRMD II 36.%2 ± 13.066 12.657 54.189 c
GR III 20.705 ± 2.097 17.389 24.289 b
GRMD III 33.571± 7.678 23.000 44.000 c
Haptoglobin GR I 12.473 ± 2.747 8.978 16.487 a
(MW 45.000 Da) GRMD I 15.586 ± 2.375 12.340 18.764 a
GR II 28.022 ± 2.712 24.000 31.982 b
GRMD II 47.267 ± 6.753 34.983 57.900 c
GR III 31.140 ± 1.680 28.982 33.001 b
GRMD III 32.544 ± 2.910 29.378 37.268 b
Acid GR I 3.297 ± 1.440 1.298 5.489 a
Glycoprotein ácida
(MW 40.000 Da) GRMD I 4.125± 1.186 3.100 6.389 a
GR II 27.832 ± 6. 134 19.278 35.849 b
GRMD II 66.291 ± 8.164 55.418 81.378 c
GR III 34.779 ± 6.912 21.389 41.890 b
GRMD III 12.507 ± 2.414 9.000 15.400 d
although a small amount of IgG passes through the placenta, the larger portion is acquired through the ingestion of colostrums. Transplacental passage takes place via the endotheliochorial placenta in dogs, where the chorionic epithelium is in contact with the endothelium of the maternal capillaries (Chucri et al. 2010).
An increase in protein concentrations in the acute phase has been reported in various infectious
and inflammatory processes in humans and animals
(Kurabayashi et al. 2003). In this study, we showed that the acute phase proteins were enlarged in dystrophic animals at least in one of the age groups.
Haptoglobin is a positive acute phase protein that is found at moderately high levels in dogs (Conner et al. 1988). However, many studies show that changes in the concentration of haptoglobin can act as a diagnostic and prognostic parameter
for inflammatory processes (Martinez-subiela et al.
2002).
Harvey and West (1987) have previously reported that the average concentration of haptoglobin in healthy dogs is 104 mg/dL, although Solter et al. (1991) obtained a value of 56 mg/dL. Eckersall (2008) state that the concentration of haptoglobin in healthy dogs falls between 0 and 3000 mg/dL, while Martinez-Subiela et al. (2004) report values between 30 and 180 mg/dL (Eckersall
et al. 1999). Here, we corroborate the findings of the abovementioned authors, as well as the findings
of Pereira et al. (2010), who report an average serum concentration of haptoglobin in healthy dogs of approximately 28.72 mg/dL, by reporting an average hepatoglobin concentration of 31.14 mg/
dL for healthy dogs and no significant difference in hepatoglobin concentration for affected dogs.
Figure 5 - Graphic scheme of acute phase proteins. Graphical representation of the average serum concentrations (mg/dL) of C-reative protein (a), alpha-1-antitrypsin (b), haptoglobin (c) and acid glycoprotein (d) obtained by fractionation using a polyacrylamide gel containing sodium dodecyl sulfate for groups GR I, GRMD I, GR II, GRMD II, GR III and GRMD III. Tukey
Our results for normal adult dogs did not agree with the data reported by Eckersall et al. (1999) who observed serum levels for haptoglobin between 10 and 20 mg/dL for normal canines, equines and swines. In addition, they report that serum haptoglobin may increase to 50 mg/dL in the
presence of inflammatory and infectious diseases, corroborating our results, wherein affected dogs
with ages varying between 2 and 3 months of age had a concentration of 47.267 mg/dL (Fournier et al. 2000).
Acid glycoprotein is a positive acute-phase
protein. In humans, the pharmacokinetics, efficacy and toxicology of basic drugs are influenced by
variations in acid glycoprotein (Matsushima et al. 2000). Ganrot (1973) evaluated alpha-1 acid glycoprotein in normal dogs and observed serum levels of 50 to 60 mg/dL. Upon induction of the inflammatory process, this acute phase protein showed a rapid and significant increase, with a half-life of approximately 5.5 days. Similarly, Dello et al. (1988) reported values of 47 mg/dL for normal dogs and 285 mg/dL for animals with
inflammatory disease. Our data for normal dogs
(34.77 mg/dL) do not corroborate these results.
With respect to affected animals, the animals that
were 2 to 3 months of age showed an increased serum concentration in comparison to normal dogs of the same age or to adults. Adult animals
affected by dystrophy had reduced levels of acid
glycoprotein.
Kurabayashi et al. (2003) evaluated the serum levels of acid glycoprotein in healthy Beagle dogs – males and females, ages varying from 3 to 72 months. In their study, they did not observe alterations related to sex or age; likewise, our study did not find alterations related to age, with the exception of the umbilical cord blood. The values found by the abovementioned authors varied between 4.00 mg/dL and 83.30 mg/dL, while in our study, the serum levels varied from 19.27 mg/dL to 41.89 mg/dL for healthy animals more
than 2 months of age. For umbilical cord blood, Kurabayashi et al. (2003) reported the presence of acid glycoprotein at a level lower than 4.00 mg/dL,
congruent with our finding that the average serum
levels in umbilical cord blood were 3.29 mg/dL for
normal dogs and 4.12 mg/dL for affected dogs.
Yuki et al. (2010), in a study evaluating the serum concentrations of clinically healthy puppies and adults, observed that neonate dogs have approximately 30% of the glycoprotein of adult dogs. In our study, with the exception of the umbilical cord blood, which had approximately 10% of the average concentration for normal adult dogs,
there was no significant difference between normal
young and adult animals. Our data corroborate that of Hayashi et al. (2001), who found that healthy dogs of 3 months of age did not show higher serum levels than did adult animals. However, a similar
pattern was not observed for the affected animals
in our study. Additionally, the authors report that mongrel dogs that had access to the outdoors had
different concentrations of acid glycoprotein when
compared to Beagle dogs that live in houses, with rates of 36.40 mg/dL and 28.60 mg/dL, respectively.
The authors suggested that these differences may be
related to the undomesticated lifestyle of mongrel dogs. We observed a higher serum concentration of 38.52 mg/dL in the normal Golden Retriever dogs evaluated here.
As has been previously stated, animals aged between 2 and 3 months affected by muscular dystrophy had serum concentrations of acid glycoprotein higher than the values found for healthy animals, showing that the progressive
profile of dystrophy alters the serum concentration
of this protein. Acid glycoprotein is considered
to be an important marker for inflammation and
becomes more susceptible to injury in the absence of dystrophin at the sarcoplasmic membrane, resulting in the activation of endogenous proteases
and, consequently, the inflammatory cascade.
The principal function of alpha-1-antitrypsin is to inhibit neutrophilic elastase, preventing the occurrence of tissue damage (Stoller and Aboussouan 2005). In our study, this protein was
present at an increased level in affected animals
with ages varying between 2 and 3 months and adults. Alpha-1-antitrypsin increases immediately after infection or inflammation (Carapeto et al. 2006), although infection is not corroborated by our results. We report the increase of this protein
in adult affected animals, whose the inflammatory
process no longer occurs in an acute way because of the progressive nature of the disease.
C-reactive protein, which is associated with
various inflammatory and pathological processes,
has been widely studied in dogs (Ljungvall et al. 2010). According to Martinez-Subiela et al. (2004), serial concentrations of this protein vary between 0.022 and 0.404 mg/dL, and Otabe et al. (1998) report a value of approximately 0.84 mg/dL. Pereira et al. (2010) report an average concentration for normal dogs of 25.52 mg/dL, corroborating our result, which is 25.39 mg/dL for normal dogs. In addition, it is important to emphasize that, in
umbilical cord blood, there is a significant difference
in the concentration of C-reactive protein between
affected and healthy animals. We therefore infer
that this protein is associated with the disease prior to birth.
Changes in acute phase proteins reflect the acute responses to muscle injuries that occur progressively in dystrophic dogs, especially in young dystrophic animals. We can infer that these animals exhibit protein alterations in response to
tissue injury, as is reported for various inflammatory
processes related to other pathologies.
The modulation of lymphocytes is crucial for maintenance of the immune system. Normally,
viral infections, immune deficiency diseases and other infectious diseases produce abnormal changes in the levels of lymphocytes (Veazey et al.
2003). In addition, the inflammatory process alters
cell populations that act on the immune system through the activation and directed migration of many different cells, chiefly neutrophils and macrophages, from the bloodstream to the sites of injury (Ahmad et al. 2010).
In the present study, we used flow cytometry
stainings to phenotype mononuclear leukocytes in peripheral blood of normal and affected by muscular dystrophy adult animals. Using these
stainings, we demonstrated that the animals affected
by muscular dystrophy exhibited CD4+ and CD5+ lymphocyte percentages that were significantly higher than those found in healthy animals, which additionally had a lower CD4:CD8 ratio. Pinto-Mariz et al. (2010) evaluated the CD3+CD4+ and CD3+CD8+ lymphocyte subpopulations present in the blood of DMD patients and healthy humans and observed that the two subpopulations were significantly increased in DMD patients. This
finding is consistent with our observations of the
CD4+ subpopulation in dogs and suggest in the role
of tissue damage and fibroses in these patients.
Adbel-Salam et al. (2009) evaluated the markers involved in degeneration and regeneration in blood for DMD and observed that one of the evaluated factors (FasL mRNA) is expressed in circulating lymphocytes. Furthermore, this factor
is significantly increased in DMD patients when
compared with normal humans because of the increase in lymphocytes.
Through flow cytometry, Byrne et al. (2000)
average values for normal dogs for CD5 (51.53%), CD4 (25.90%) and CD8 (15.0 7%) that are below those reported by Byrne et al. (2000), although the CD4:CD8 ratio we observed was 1.71, which is consistent with Byrne et al. (2000). This ratio for CD4:CD8 is likewise consistent with the data of Rivas et al. (1995), who reported a ratio of 1.7.
Rivas et al. (1995) similarly reported CD4+ and CD8+ ranges in normal dogs of 27 to 33% and 17
to 18%, respectively, that were higher than those reported here.
According to Greeley et al. (1996), older dogs exhibit a lower percentage of CD4+ cells when compared to younger dogs, with values of 30.9% and 45.1%, respectively. A reduction in the percentage of CD8 concomitantly increases the average CD4:CD8 ratio, which is 3.17 for young dogs and 2.21 for adult dogs. In comparison, the CD4:CD8 ratio for the group of dogs was 1.74, consistent with our results for Golden Retriever dogs. Other animal model of muscular dystrophy presented a large number of increased versus decreased protein species in mdx-4cv serum by comparative spectrometry mass tolls (Murphy et al. 2017).
The interest of this study is related to the extent
of inflammatory response in muscular dystrophy, it
can, after a time of injury be detrimental, resulting in the replacement of muscle tissue through a
progressive inflammation. Thus, to understand how
this process occurs, knowing the behavior of some
parameters involved in the inflammatory process
becomes of extreme importance in study with preclinical cell therapy, medication or genetics.
Thus, we can infer that the progressive process of dystrophy is related to alterations in the cell populations that constitute the immune systems of patients. The muscles of these patients become more susceptible to injuries due to the absence of dystrophin, and when injuries occur, a release of cytokines stimulates liver cells to secrete acute phase proteins and to promote the co-stimulation
of T lymphocytes. Thus, we suggest that the data
reported are the consequence of the inflammatory
response generated by muscular injury in GRMD.
ACKNOWLEDGMENTS
We acknowledge the assistance of the Fundação de Amparo à Pesquisa do Estado de São Paulo (FAPESP, Process FAPESP, 07/51222-2 09/02958-1, 11/13030-0 2013/09392-9). We thank Profº. Dr. Aureo Evangelista Santana and Dr. Paulo Cesar da Silva both belong to Faculty of Veterinary and Agricultural Science (UNESP) for the support in this work.
REFERENCES
ABBAS AK, LICHTMAN AH AND PILLAI S. 2008. Cellular and molecular immunology, 8th ed., Philadelphia: Elsevier Sanders.
ADBEL-SALAM E, ADBEL-MEGUID I AND KORRA ASS. 2009. Markers of degeneration and regeneration in Duchenne muscular dystrophy. Acta Myol 3: 94-100. AHMAD N, BYGRAVE M, ZORDO T, FENSTER A AND
LEE TY. 2010. Detecting degenerative changes in myotonic murine models of Duchenne Muscular Dystrophy using High-Frequency Ultrasound. J Ultrassound Med 29(3): 367-375.
AMBROSIO CE ET AL. 2009. Identification of three distinguishable phenotypes in golden retriever muscular dystrophy. Genet Mol Res 8(2): 389-396.
ARAUJO KP, BONUCCELLI G, DUARTE CN, GAIAD TP, MOREIRA DF, FEDER D, BELIZARIO JE, MIGLINO MA, LISANTI MP AND AMBROSIO CE. 2013. Bortezomib (PS-341) treatment decreases inflammation and partially rescues the expression of the dystrophin-glycoprotein complex in GRMD dogs. PLoS ONE 8(4): e61367. doi: 10.1371/journal.pone.0061367.
BARSANTI JÁ, KRISTENSEN F AND DRUMHELLER FB. 1977. Analysis of serum proteins, using agarose electrophoresis in normal dogs and in dogs infected with Dirofilaria immitis. Am J Vet Res 7: 1055-1058.
BEENAKKER EA, FOCK JM, VAN TOL MJ, MAURITS NM, KOOPMAN HM, BROUWER OF AND VAN DER HOEVEN JH. 2005. Intermittent Prednisone Therapy in Duchenne Muscular Dystrophy. Arch Neurol 62: 128-132. BYRNE KM, KIM HW, CHEW BP, REINHART GA AND
and normal feline blood lymphocytes. Vet Immunol Immunopathol 2: 167-182.
CARAPETO MV, BARRERA R, MAÑE MC AND
ZARAGOZA C. 2006. Serum α-globulin fraction in horses
is related to changes in the acute phase proteins. J Eq Vet Sci 3: 120-127.
CHUCRI TM, MONTEIRO JM, LIMA AR, SALVADORI MLB, KFOURY JR AND MIGLINO MA. 2010. A review of immune transfer by the placenta. J Reprod Immunol 87(1-2): 14-20.
COLLINS CA AND MORGAN JE. 2003. Duchenne’s muscular dystrophy: animal models used to investigate pathogenesis and develop therapeutic strategies. Int J Exp Pathol 84(4): 165-172.
CONNER JG, ECKERSALL PD, FERGUSON J AND DOUGLAS TA. 1988. Acute phase response in the dog following surgical trauma. Res Vet Sci 1: 107-110. DELLO CP, BELPAIRE FM, DE RICK A AND FRAEYMAN
NH. 1988. Influence of inflammation on serum concentration molecular heterogenecity and drug binding properties of canine alpha-1-acid glycoprotein. J Vet Pharm Ther 11: 71-76.
ECKERSALL PD. 2008. Proteins, Proteomics and the Dysproteinemias. In: Kaneko JJ et al. (Eds), Clinical Biochemistry of Domestic Animals, 6th Edition, Academic Press, San Diego, p. 117-155.
ECKERSALL PD, DUTHIE S, TOUSSAINT MJ, GRUYS E, HEEGAARD P, ALAVA M, LIPPERHEIDE C AND MADEC F. 1999. Sandardization of diagnostic assays for animal acute phase proteins. Adv Vet Med 41: 643-655. EMERY AE. 2002. The muscular dystrophies. Lancet 359:
687-695.
FILVAROFF EH, EBNER R AND DERYNCK R. 1994. Inhibition of myogenic differentiation in myoblasts expressing a truncated type II TGF-beta receptor. Development 120: 1085-1095.
FOURNIER T, NAJET MEDJOUBI N AND PORQUET D. 2000. Alpha-1-acid glycoprotein: review. Biochim Biophys Acta 1482: 157-171.
GAIAD TP, SILVA MB, SILVA GC, CAROMANO FA, MIGLINO MA AND AMBROSIO CE. 2011. Physical therapy assessment tools to evaluate disease progression and phenotype variability in Golden Retriever muscular dystrophy. Res Vet Sci 91(2): 188-193.
GANROT K. 1973. Plasma protein response in experimental inflammation in the dog. Res Exp Med 4: 251-261. GODOY RF, SANTANA AE, PALMA PB, ROSSETO F AND
OLIVEIRA JV. 2007. Quantificação de subpopulações linfocitárias no sangue do cordão umbilical de eqüinos. Ciênc Rural 3: 734-739.
GREELEY EH, KEALY RD, BALLAM JM, LAWLER DF AND SEGRE M. 1996. The influence of age on the canine immune system. Vet Immunol Immunopathol 55: 1-10.
HARVEY JW AND WEST CL. 1987. Prednisone-induced increases in serum alpha-2-globulin and haptoglobin concentration in dogs. Vet Pathol 1: 90-92.
HAYASHI S, JINBO T, IGUCHI K, SHIMIZU M, SHIMADA T, NOMURA M, ISHIDA Y AND YAMAMOTO S. 2001. A comparison of the concentrations of C-reactive protein and alpha 1-acid glycoprotein in the serum from dogs with acute inflammation. Vet Res Commun 25: 117-126. JAKUBZICK C, KUNKEL SL, PURI RK AND HOGABOAM
CM. 2004. Therapeutic targeting of IL-4 and IL-13-responsive cells in pulmonary fibrosis. Immunol Res 30: 339-349.
KURABAYASHI T, SHIMIZU M, SHIMADA T, HONJYO T, YAMAMOTO Y, KUBA K AND YAMAMOTO S. 2003. Alpha 1-acid Glycoprotein (AAG) Levels in Healthy and Pregnant Beagle Dogs. Exp Anim 5: 377-381.
LJUNGVALL I, HÖGLUND K, TIDHOLM A, OLSEN LH, BORGARELLI M, VENGE P AND HÄGGSTRÖM J. 2010. Cardiac troponin I is associated with severity of myxomatous mitral valve disease, age, and C-reactive protein in dogs. J Vet Intern Med 1: 153-159.
MARINARO M, MARI V, BELLACICCO AL, TARSITANO E, ELIA G, LOSURDO M, REZZA G, BUONAVOGLIA C AND DECARO N. 2010. Prolonged depletion of
circulating CD4+ T lymphocytes and acute monocytosis
after pantropic canine coraonavirus infection in dogs. Virus Res 152: 73-78.
MARTINEZ-SUBIELA S, GINEL PJ AND CERON JJ. 2004. Effects of different glucocorticoid treatments on serum acute phase proteins in dogs. Vet Rec 26: 814-817. MARTINEZ-SUBIELA S, TECLES F, ECKERSALL PD
AND CERON JJ. 2002. Serum concentrations of acute phase protein in dogs with leishmaniasis. Vet Rec 8: 241-244.
MATSUSHIMA W, WATANABE T AND HIGUCHI S. 2000. Effect of alpha (1)-acid glycoprotein on the pharmacokinetics of tamusulosin in rats treated with turpentine oil. J Pharm Sci 4: 490-498.
MURPHY S, DOWLING P, ZWEYER M, HENRY M, MELEADY P, MUNDEGAR RR, SWANDULLA D AND OHLENDIECK K. 2017 Proteomic profiling of mdx-4cv serum reveals highly elevated levels of the inflammation-induced plasma marker haptoglobin in muscular dystrophy. Int J Mol Med 39(6): 1357-1370. OTABE K, SUGIMOTO T, JINBO T, HONDA M, KITAO S,
HAYASHI S, SHIMIZU M AND YAMAMOTO S. 1998. Physiological levels of C-reactive protein in normal canine sera. Vet Res Commun 22: 77-85.
PINTO-MARIZ F, CARVALHO LR, DE MELLO W, ARAÚJO ADE Q, RIBEIRO MG, CUNHA MDO C, VOIT T, BUTLER-BROWNE G, SILVA-BARBOSA SD AND SAVINO W. 2010. Differential integrin expression by T lymphocytes: Potential role in DMD muscle damage. J Neuroimmunol 223: 128-130.
RIVAS AL, KIMBALL ES, QUIMBY FW AND GEBHARD D. 1995. Functional and phenotypic analysis of in vitro stimulated canine peripheral blood mononuclear cells. Vet Immunol Immunopathol 45: 55-71.
SOLTER PF, WALTER EH, HUNGERFORD LL, SIEGEL JP, ST DENIS SH AND DORNER JL. 1991. Haptoglobin and ceruloplasmin as determinants of inflammation in dogs. Am J Vet Res 52: 1738-1742.
STOLLER JK AND ABOUSSOUAN LS. 2005. Alpha1-antitrypsin deficiency. Lancet 9478: 2225-2236.
VALENTINE BA, BLUE JT, SHELLEY SM AND COOPER BJ. 1990. Increased Serum Alanine Aminotransferase Activity Associated with Muscle Necrosis in the Dog. J Vet Intern Med 4: 140-143.
VEAZEY R, LING B, PANDREA I, MCCLURE H, LACKNER A AND MARX P. 2003. Decreased CCR5 expression on
CD4+ T cells of SIV-infected sooty mangabeys. AIDS Res
Hum Retroviruses 3: 227-233.
VILLALTA SA, ROSENTHAL W, MARTINEZ L, KAUR A, SPARWASSER T, TIDBALL JG, MARGETA M, SPENCER MJ AND BLUESTONE JA. 2014. Regulatory T cells suppress muscle inflammation and injury in muscular dystrophy. Sci Transl Med 6(258): 258ra142.
YANG HT, SHIN JH, HAKIM CH, PAN X, TERJUNG RL AND DUAN D. 2012. Dystrophin Deficiency Compromises Force Production of the Extensor Carpi Ulnaris Muscle in the Canine Model of Duchenne Muscular Dystrophy. PLoS ONE 9: e44438.