Copyright 2018
This content is licensed under a Creative Commons Attribution 4.0 International License. ISSN: 1679-4508 | e-ISSN: 2317-6385
Official Publication of the Instituto Israelita de Ensino e Pesquisa Albert Einstein
Comparison of the
neutrophil-to-lymphocyte and platelet-to-neutrophil-to-lymphocyte
ratios in normoglycemic and
hyperglycemic subjects
Comparação das razões neutrófilo-linfócito e plaqueta-linfócito de
indivíduos normoglicêmicos e hiperglicêmicos
Brena Barros Mendes1, Anniely Carvalho Rebouças Oliveira1, Keila Correia de Alcântara2
1 Hospital das Clínicas, Universidade Federal de Goiás, Goiânia, GO, Brazil. 2 Faculdade de Farmácia, Universidade Federal de Goiás, Goiânia, GO, Brazil.
DOI: 10.31744/einstein_journal/2019AO4403
❚ABSTRACT
Objective: To compare the neutrophil-to-lymphocyte and platelet-to-lymphocyte ratios as possible parameters of systemic inflammation in hyperglycemic and normoglycemic subjects. Methods: A retrospective, cross-sectional study of data collected from patients tested for fasting blood glucose, glycated hemoglobin (HbA1c) and blood count on the same day, between July and December 2016. Patients were divided into hyperglycemic and normoglycemic, and matched by age and sex. The data were analyzed using Epi Info™, version 7.2.1.0, for the Windows® platform.
Results: We enrolled 278 subjects, 139 hyperglycemic and 139 normoglycemic. The absolute number of leukocytes and neutrophils was higher in the Hyperglycemic Group (p=0.006 and p=0.004, respectively). There was no difference in the neutrophil-to-lymphocyte ratio between the Hyperglycemic Group and the Normoglycemic Group (2.1 versus 2.0; p=0.264), and both neutrophil-to-lymphocyte and platelet-to-lymphocyte ratios showed no differences between those
with HbA1c ≥7% (n=127, p=0.778) and those with HbA1c <7% (n=12, p=0.490). In contrast,
the platelet-to-lymphocyte ratio was lower in the Hyperglycemic Group (117.8 versus 129.6; p=0.007). Conclusion: Hyperglycemic subjects had a neutrophil-to-lymphocyte ratio similar to that of normoglycemic subjects, but had a lower platelet-to-lymphocyte ratio. Future prospective studies will be useful to determine the importance and prognostic value of neutrophil-to-lymphocyte and platelet-to-lymphocyte ratios in the hyperglycemic state.
Keywords: Type 2 diabetes mellitus; Neutrophils; Lymphocytes; Blood platelets; Inflammation; Glycated hemoglobin A
❚RESUMO
Objetivo: Comparar a razão neutrófilo-linfócito e a razão plaqueta-linfócito como possíveis parâmetros de inflamação sistêmica em indivíduos hiperglicêmicos e normoglicêmicos. Métodos: Estudo transversal retrospectivo, em que foram coletados dados dos pacientes que realizaram glicemia em jejum, hemoglobina glicada (HbA1c) e hemograma na mesma data, entre julho e dezembro de 2016. Os pacientes foram divididos em um Grupo Hiperglicêmico e um Grupo Normoglicêmico, pareados por idade e sexo. Os dados foram analisados no Epi Info™, versão 7.2.1.0, em plataforma Windows®. Resultados: Foram incluídos 278 indivíduos, sendo
139 hiperglicêmicos e 139 normoglicêmicos. O número absoluto de leucócitos e neutrófilos foi maior no Grupo Hiperglicêmico (p=0,006 e p=0,004, respectivamente). Não houve diferença da razão neutrófilo-linfócito entre o Grupo Hiperglicêmico e o Grupo Normoglicêmico (2,1 versus 2,0; p=0,264), assim como a razão neutrófilo-linfócito e razão plaqueta-linfócito não apresentou
How to cite this article:
Mendes BB, Oliveira AC, Alcântara KC. Comparison of the neutrophil-to-lymphocyte and platelet-to-lymphocyte ratios in normoglycemic and hyperglycemic subjects. einstein (São Paulo). 2019;17(1):eAO4403. http://dx.doi.org/10.31744/einstein_journal/ 2019AO4403
Corresponding author:
Brena Barros Mendes Primeira Avenida, s/n Setor Leste Universitário
Zip code: 74605-020 – Goiânia, GO, Brazil Phone: (55 62) 99122-3572
E-mail: [email protected]
Received on:
Jan 30, 2018
Accepted on:
June 24, 2018
Conflict of interest:
diferença entre aqueles com HbA1c ≥7% (n=127) e com HbA1c <7% (n=12; p=0,778 e p=0,490). Contrariamente, a razão
plaqueta-linfócito mostrou-se menor no Grupo Hiperglicêmico (117,8 versus 129,6; p=0,007). Conclusão: Indivíduos hiperglicêmicos apresentaram razão neutrófilo-linfócito semelhante a dos normoglicêmicos, mas tiveram razão plaqueta-linfócito menor. Pesquisas futuras, de modo prospectivo, seriam úteis para analisar a importância e o valor prognóstico da razão neutrófilo-linfócito e da razão plaqueta-linfócito no estado hiperglicêmico.
Descritores:Diabetes mellitus tipo 2; Neutrófilos; Linfócitos; Plaquetas; Inflamação; Hemoglobina A glicada
❚INTRODUCTION
Prolonged hyperglycemia promotes the development of different complications resulting from inflammation, such as neuropathy, retinopathy, renal failure, hypercoagulability, hypertension, myocardial infarction, stroke, and peripheral vascular disease, among others. High blood glucose levels are toxic to the body, leading to protein glycation, hyperosmolality and increased intracellular sorbitol levels.(1,2)
Glycation is an irreversible non-enzymatic binding reaction between glucose and a protein – e.g. hemoglobin –, which gave rise to the term glycated hemoglobin (HbA1c). Hemoglobin A (HbA) is the main hemoglobin, with subtypes A1 and A2. Total HbA1 corresponds to the molecules most negatively charged by the addition of glucose and other carbohydrates. The A1c fraction is present in HbA1c, with glucose attached to the N-terminal valine of the beta chain. In addition to blood glucose, HbA1C has become an important tool for diagnosing diabetes mellitus (DM), ensuring glycemic control and predicting the risk of vascular complications.(3)
Inflammation is closely related with insulin-resistance, due to excess fat tissue producing pro-inflammatory adipokines, which results in low-grade chronic inflammation, impairing tissue response to insulin and leading to type 2 diabetes (T2DM).(4,5) HbA1c levels >7% are associated with a higher risk of irreversible, organic injuries, but HbA1c is not predictive of inflammatory processes.(1,6)
In recent years, the neutrophil-to-lymphocyte ratio (NLR) and the platelet-to-lymphocyte ratio (PLR), which derive from a calculation of blood count parameters, were introduced as potential markers of inflammation in cardiac diseases, neoplasms and diabetes-associated complications.(7-10)
There are few studies in Brazil about the NLR and PLR in hyperglycemic states. Knowing that prolonged hyperglycemia results in severe complications and high morbidity and mortality, it is imperative that further
studies be conducted to help determine the prognosis of chronic complications of T2DM.(11,12) The goal is to potentially use blood count parameters, such as the NLR and PLR, as prognostic factors of inflammation, to minimize the incidence of complications in patients diagnosed with T2DM, considering how important inflammation is for the onset and progression of the disease.(13,14)
❚OBJECTIVE
To compare the neutrophil-to-lymphocyte and platelet-to-lymphocyte ratios of hyperglycemic and normoglycemic subjects.
❚METHODS
A cross-sectional, retrospective study looking at laboratory test results archived in the Laudos® software, version 1.0.220, for patients seen in the Clinical Laboratory of the Hospital das Clínicas da Universidade Federal de Goiás, between July and December 2016.
To collect the data from the study population, we selected all patients aged ≥40 years tested for fasting glucose, HbA1c and complete blood count on the same day at the Clinical Laboratory, coming up to a total of 1,027 subjects within the established period.
We excluded patients with hematologic diseases, chronic kidney disease, pregnant women, subjects with acute infection, as described in the clinical indications field of the patient’s registration form, and/ or those with abnormal results in other laboratory tests. Moreover, in compliance with the 2015-2016 criteria of the Sociedade Brasileira de Diabetes (SBD) (https://www.diabetes.org.br/profissionais/images/ docs/DIRETRIZES-SBD-2015-2016.pdf), and of the American Diabetes Association (ADA) (2014)(6) for DM diagnosis, pre-diabetic patients with fasting glucose levels between 100 and 125mg/dL were excluded.
The selected patients (n=278) were divided into a Hyperglycemic Group with fasting glucose ≥126mg/dL and HbA1c ≥6.5%, and a Normoglycemic Group, with fasting glucose <100mg/dL and HbA1c <6.5%, matched by age and sex, according to the ADA.(6) The Hyperglycemic Group was stratified into one group with HbA1c <7.0% and another with HbA1c ≥7.0%.
platelets by the number of lymphocytes. Blood counts were performed using the Pentra DF Nexus blood analyzer (Horiba Medical, Montpellier, France). Blood glucose and HbA1c tests were performed on the Architect c4000 analyzer (Abbott Laboratories, Illinois, USA).
The study was approved by the Research Ethics Committee under number 855.670, CAAE: 21377413.7. 0000.5078 of October 29, 2014.
Statistical analysis
For all groups, we calculated the median, maximum and minimum values of the variables age, sex, blood glucose levels, HbA1c, WBC count, total neutrophils, lymphocytes, platelets, NLR and PLR. The comparison was made using the Kruskal-Wallis nonparametric test and the χ2 test (only for the variable sex), and significance was established at p<0.05. The data were analyzed on the Epi Info™ software, version 7.2.1.0, for Windows®.
❚RESULTS
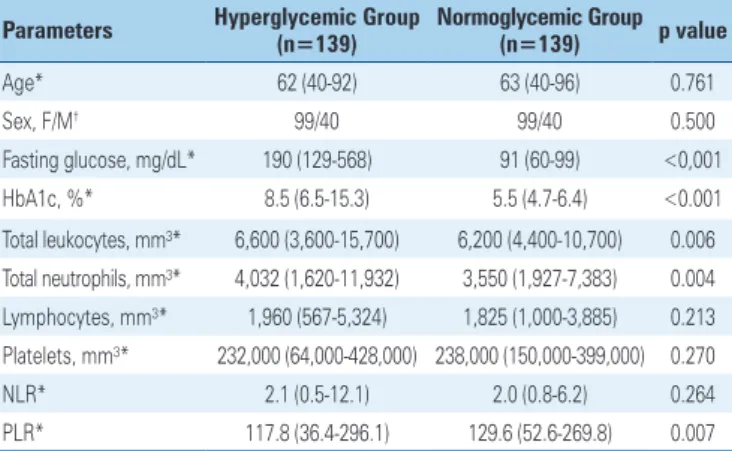
Of the 1,027 subjects selected, 278 were enrolled in the study, 139 of which were hyperglycemic and 139, normoglycemic. Of this total, 71% (198/278) were female, 54% (149/278) were aged over 60 years, and 99.3% (276/278) were outpatients (Table 1). The NLR was similar between the Hyperglycemic Group (2.1; 0.5 to 12.1) and the Normoglycemic Group (2.0; 0.8 to 6.2) p=0.264, while the PLR was lower in the Hyperglycemic Group (117.8; 36.4 to 296.1) when compared to the Normoglycemic Group (129.6; 52.6 to 269.1), p=0.007.
The median NLR for the group with HbA1c <7% (n=12) was 2.0 (0.9 to 8.8) and for the group with HbA1c ≥7% (n=127), 2.1 (0.5 to 12.1), p=0.778. The PLR for the group with HbA1c <7% was 106.4 (72.6 to 269.5) and for the Decompensated Group with HbA1c ≥7%, 117.9 (36.4 to 296.1), p=0.490 (Table 2).
Table 1. Demographic and laboratory parameters of the hyperglycemic and the Normoglycemic Groups
Parameters Hyperglycemic Group (n=139) Normoglycemic Group (n=139) p value
Age* 62 (40-92) 63 (40-96) 0.761
Sex, F/M† 99/40 99/40 0.500
Fasting glucose, mg/dL* 190 (129-568) 91 (60-99) <0,001
HbA1c, %* 8.5 (6.5-15.3) 5.5 (4.7-6.4) <0.001
Total leukocytes, mm³* 6,600 (3,600-15,700) 6,200 (4,400-10,700) 0.006 Total neutrophils, mm³* 4,032 (1,620-11,932) 3,550 (1,927-7,383) 0.004 Lymphocytes, mm³* 1,960 (567-5,324) 1,825 (1,000-3,885) 0.213 Platelets, mm³* 232,000 (64,000-428,000) 238,000 (150,000-399,000) 0.270
NLR* 2.1 (0.5-12.1) 2.0 (0.8-6.2) 0.264
PLR* 117.8 (36.4-296.1) 129.6 (52.6-269.8) 0.007
Results expressed as medians (minimum-maximum). * Kruskal-Wallis non-parametric test; †χ2 test. F: female; M: male;
HbA1c: glycated hemoglobin; NLR: neutrophil-to-lymphocyte ratio; PLR: platelet-to-lymphocyte ratio.
Table 2. Demographic and laboratory parameters of the Hyperglycemic Group, according to glycated hemoglobin levels (HbA1c)
Parameters HbA1c <7% HbA1c ≥7% p value (n=12) (n=127)
Age* 65 (52-83) 61 (40-92) 0.042
Sex, F/M† 6/6 93/34 0.080
Fasting glucose, mg/dL* 152 (129-257) 194 (129-568) 0.007 Total leucocytes, mm³* 7,150 (3,600-12,100) 6,600 (3,600-15,700) 0.344
Total neutrophils, mm³* 4,218 (1,620-9,163) 4,032 (1,804-11,932) 0.435 Lymphocytes, mm³* 2,061 (909-3,388) 1,955 (5.67-5,324) 0.997 Platelets, mm³* 251,000 (89,000-308,000) 230,000 (64,000-428,000) 0.848
NLR* 2.0 (0.9-8.8) 2.1 (0.5-12.1) 0.778
PLR* 106.4 (72.6-269.5) 117.9 (36.4-296.1) 0.490
Results expressed as median (minimum-maximum). * Kruskal-Wallis non-parametric test; † χ2 test. F: female; M: male;
NLR: neutrophil-to-lymphocyte ratio; PLR: platelet-to-lymphocyte ratio.
❚DISCUSSION
Some studies showed chronic inflammation plays an important role in the development and progression of T2DM.(15-17) The PLR and the NLR have been recently used as markers of systemic inflammation in chronic diseases, as well as prognostic predictors in cardiovascular diseases and neoplasms.(18,19) The present study showed a lower PLR in hyperglycemic subjects, and found no difference in the NLR, when comparing hyperglycemic and normoglycemic subjects.
This lower PLR may be related with increased activation and platelet aggregation in patients with T2DM. This is attributable to deficient secretion of insulin, which has the role of inhibiting platelet aggregation, oxidative stress and endothelial damage from glucotoxicity. Lower platelet counts in diabetic patients may be due to the decreased survival and/or production, and increased turnover of platelets.(20)
cytokines.(22) The results of Vozarova et al. showed that a high WBC count is a predictive factor for the development of T2DM complications.(23) Thus, low-grade chronic inflammation may play an important role in the progression to T2DM, as well as in increasing the morbidity and mortality of DM patients.(2,24)
The PLR and, particularly, the NLR have been associated with microvascular and macrovascular complications in diabetes, most importantly in disease progression and metabolic impairment.(25-28) In a study by Sefil et al., NLR correlated positively with HbA1c levels.(29) This study showed no difference between the ratios of hyperglycemic subjects with HbA1c <7.0% and hyperglycemic subjects with HbA1c ≥7.0%. Some factors, such as disease duration, use of drugs and other clinical conditions may have contributed to our findings.
Despite some limitations, there are few studies in Brazil correlating NLR, PLR and hyperglycemic states. That is why it is important to study these ratios, considering that, in Brazil, the prevalence of T2DM is high, leading to a high demand for healthcare and financial resources, and the method for measuring NLR and PLR is low-cost and easily accessible.
❚CONCLUSION
The platelet-to-lymphocyte ratio found in hyperglycemic patients was significantly lower than the platelet-to-lymphocyte ratio in normoglycemic patients, while the neutrophil-to-lymphocyte ratio did not differ between the groups.
ACKNOWLEGDMENTS
To the Clinical Laboratory of the Hospital das Clínicas da Universidade Federal de Goiás and the Empresa Brasileira de Serviços Hospitalares, for providing data for this study.
❚AUTHORS' INFORMATION
Mendes BB: http://orcid.org/0000-0001-9526-1470 Oliveira AC: http://orcid.org/0000-0003-1807-8378 Alcântara KC: http://orcid.org/0000-0002-4477-2833
❚REFERENCES
1. Sociedade Brasileira de Diabetes (SBD). Diretrizes da Sociedade Brasileira de diabetes. 2015-2016. Monitoramento da Glicemia na Doença Renal Crônica [Internet]. São Paulo: SBD; 2015 [citado 2018 Fev 21]. Disponível em: http:// www.diabetes.org.br/profissionais/images/docs/DIRETRIZES-SBD-2015-2016.pdf 2. Lang F. Hormones – late complications of prolonged hyperglycemia (diabetes
mellitus). In: Silbernagl S, Lang F. Color atlas of pathophysiology. New York: Thieme Stuttgart; 2000. p. 290-1.
3. Weykamp C. HbA1c: a review of analytical and clinical aspects. Ann Lab Med. 2013;33(6):393-400.
4. Shoelson SE, Lee J, Goldfinej AB. Inflammation and insulin resistance. J Clin Invest. 2006;116(7):1793-801. Review. Erratum in: J Clin Invest. 2006; 116(8):2308.
5. Goldberg RB. Cytokine and cytokine-like inflammation markers, endothelial dysfunction, and imbalanced coagulation in development of diabetes and its complications. J Clin Endocrinol Metab. 2009;94(9):3171-82. Review. 6. American Diabetes Association (ADA). Standards of Medical Care in
Diabetes--2014. Diabetes Care. 2014;37(Suppl 1):S14-80.
7. Durmus E, Kivrak T, Gerin F, Sunbul M, Sari I, Erdogan O. Relações Neutrófilo-Linfócito e Plaqueta-Neutrófilo-Linfócito como preditores de insuficiência cardíaca. Arq Bras Cardiol. 2015;105(6):606-13.
8. Zhou B, Zhan C, Wu J, Liu J, Zhou J, Zheng S. Prognostic significance of preoperative Neutrophil-to-Lymphocyte ratio in surgically resectable pancreatic neuroendocrine tumors. Med Sci Monit. 2017;23:5574-88.
9. Ural ÜM, Şehitoğlu İ, Tekin YB, Şahin FK. Neutrophil-to-lymphocyte and platelet-to-lymphocyte ratios in patients with endometrial hyperplasia and endometrial cancer. J Obstet Gynaecol Res. 2015;41(3):445-8.
10. Demirtas L, Degirmenci H, Akbas EM, Ozcicek A, Timuroglu A, Gurel A, et al. Association of hematological indicies with diabetes, impaired glucose regulation and microvascular complications of diabetes. Int J Clin Exp Med. 2015;8(7):11420-7.
11. Kahraman C, Kahraman NK, Aras B, Coşgun S, Gülcan E. The relationship between neutrophil-to-lymphocyte ratio and albuminuria in type 2 diabetic patients: a pilot study. Arch Med Sci. 2016;12(3):571-5.
12. DiGangi C. Neutrophil-lymphocyte ratio: predicting cardiovascular and renal complications in patients with diabetes. J Am Assoc Nurse Pract. 2016; 28(8):410-4. Review.
13. Akbas EM, Hamur H, Demirtas L, Bakirci EM, Ozcicek A, Ozcicek F, et al. Predictors of epicardial adipose tissue in patients with type 2 diabetes mellitus. Diabetol Metab Syndr. 2014;6:55.
14. Öztürk ZA, Kuyumcu ME, Yesil Y, Savas E, Yıldız H, Kepekçi Y, et al. Is there a link between neutrophil-lymphocyte ratio and microvascular complications in geriatric diabetic patients? J Endocrinol Invest. 2013;36(8):593-9.
15. Das A, Mukhopadhyay S. The evil Axis of obesity, inflammation and type-2 diabetes. Endocr Metab Immune Disord Drug Targets. 2011;11(1):23-31. Review.
16. Jiang H, Yan WH, Li CJ, Wang AP, Dou JT, Mu YM. Elevated white blood cell count is associated with higher risk of glucose metabolism disorders in middle-aged and elderly chinese people. Int J Environ Res Public Health. 2014;11(5):5497-509.
17. Huang L, Xie Y, Dai S, Zheng H. Neutrophil-to-lymphocyte ratio in diabetic microangiopathy. Int J Clin Exp Pathol. 2017;10(2):1223-32.
18. Kim BJ, Cho SH, Cho KI, Kim HS, Heo JH, Cha TJ. The combined impact of neotrophil-to-lymphocyte ratio and type 2 diabetic mellitus on significant coronary artery disease and carotid artery atherosclerosis. J Cardiovasc Ultrasound. 2016;24(2):115-22.
19. Urrejola GI, Bambs CE, Espinoza MA, Gellona J, Zúñiga AM, Molina ME, et al. Un índice neutrófilo/linfocito elevado se asocia a peor pronóstico en cáncer de colon etapa II ressecado. Rev Med Chile. 2013;141(5):602-8.
20. El Haouari ME, Rosado JA. Platelet signalling abnormalities in patients with type 2 diabetes mellitus: a review. Blood Cells Mol Dis. 2008;41(1):119-23. Review.
21. Zhang H, Yang Z, Zhang W, Niu Y, Li X, Qin L, et al. White blood cell subtypes and risk of type 2 diabetes. J Diabetes Complications. 2017;31(1):31-7. 22. Schuster DP. Obesity and the development of type 2 diabetes: the effects of
fatty tissue inflammation. Diabetes Metab Syndr Obes. 2010;3:253-62. 23. Vozarova B, Weyer C, Lindsay RS, Pratley RE, Bogardus C, Tataranni PA. High
24. de Luca C, Olefsky JM. Inflammation and Insulin resistance. FEBS Lett. 2008; 582(1):97-105. Review.
25. Shiny A, Bibin YS, Shanthirani CS, Regin BS, Anjana RM, Balasubramanyam M, et al. Association of neutrophil-lymphocyte ratio with glucose intolerance: an indicator of systemic inflammation in patients with type 2 Diabetes. Diabetes Technol Ther. 2014;16(8):524-30.
26. Akbas EM, Demirtas L, Ozcicek A, Timuroglu A, Bakirci EM, Hamur H, et al. Association of epicardial adipose tissue, neutrophil-to-lymphocyte ratio and platelet-to-lymphocyte ratio with diabetic nephropathy. Int J Clin Exp Med. 2014;7(7):1794-801.
27. Luo P, Li R, Yu S, Xu T, Yue S, Ji Y, et al. The Relationship between Neutrophil-to-Lymphocyte ratio and intracerebral hemorrhage in type 2 diabetes mellitus. J Stroke Cerebrovasc Dis. 2017;26(5):930-7.
28. Wang RT, Zhang JR, Li Y, Liu T, Yu KJ. Neutrophil-Lymphocyte ratio is associated with arterial stiffness in diabetic retinopathy in type 2 diabetes. J Diabetes Complications. 2015;29(2):245-9.