Minimum number and best combinations of harvests to evaluate accessions
of tomato plants from germplasm banks
Flávia Barbosa Abreu
1, Derly José Henriques da Silva
2, Bruno Garcia Marim
2,
Pedro Crescêncio Souza Carneiro
3, Ana Cristina Pinto Juhasz
4, Carina A.C. De Luca
2,
Reginaldo Fialho Valente
2and Marcelo Almeida Guimarães
21
Universidade Estadual do Mato Grosso do Sul, Unidade Universitária de Aquidauana,
Aquidauana, MS, Brazil.
2
Universidade Federal de Viçosa, Departamento de Fitotecnia, Viçosa, MG, Brazil.
3
Universidade Federal de Viçosa, Departamento de Biologia, Viçosa, MG, Brazil.
4
Universidade Federal de Viçosa, Secretaria de Genética e Melhoramento, Viçosa, MG, Brazil.
Abstract
This study presents the minimum number and the best combination of tomato harvests needed to compare tomato accessions from germplasm banks. Number and weight of fruit in tomato plants are important as auxiliary traits in the evaluation of germplasm banks and should be studied simultaneously with other desirable characteristics such as pest and disease resistance, improved flavor and early production. Brazilian tomato breeding programs should con-sider not only the number of fruit but also fruit size because Brazilian consumers value fruit that are homogeneous, large and heavy. Our experiment was a randomized block design with three replicates of 32 tomato accessions from the Vegetable Germplasm Bank (Banco de Germoplasma de Hortaliças) at the Federal University of Viçosa, Minas Gerais, Brazil plus two control cultivars (Debora Plus and Santa Clara). Nine harvests were evaluated for four pro-duction-related traits. The results indicate that six successive harvests are sufficient to compare tomato genotypes and germplasm bank accessions. Evaluation of genotypes according to the number of fruit requires analysis from the second to the seventh harvest. Evaluation of fruit weight by genotype requires analysis from the fourth to the ninth harvest. Evaluation of both number and weight of fruit require analysis from the second to the ninth harvest.
Key words: Lycopersicon esculentum,genetic resources, principal components, repeatability coefficient, determination coefficient.
Received: August 17, 2004; Accepted: August 1, 2005.
Introduction
The choice of genitors is one of the most important stages in the development of a breeding program. To be successful, a breeding program must have clear goals and decisions must be based on the traits to be improved, the kinds of genetic control to which these traits are subject and the sources of germplasm available (Fehr, 1987).
In tomato plants, fruit number and weight are impor-tant auxiliary traits which need to be considered for the ade-quate evaluation of tomato germplasm banks. Most high-productivity tomato genes are already widely used and the search for production characteristics associated with disease and insect resistance, improved flavor and early maturation, among others, is desirable. Breeding
pro-grams should always include a fruit production component because the development of desirable traits must accom-pany the development of higher-productivity genotypes.
Crops such as tomato may require eight to fourteen harvests during the crop cycle and fruit production may vary, with higher fruit production normally occurring when harvests are alternated. Because the effect of harvesting may vary among genotypes within the same population, it is not possible to estimate the heritability coefficient from different harvests. This incapacity is due to the incorpora-tion of environmental effect into the genotype effect be-cause randomized genotypes cannot occur between one harvest and the next. In these situations, the repeatability coefficient may be used as measure of the accuracy of the relative superiority of one or more accessions. An estimate of the repeatability coefficient also allows for determina-tion of the minimum number of harvests necessary to ac-cess the genotypical value of individuals based on
www.sbg.org.br
Research Article
phenotypic observations. In breeding programs with scarce economic and human resources, the estimate of the repeat-ability coefficient is of much interest both during the selec-tive process and at the time for choosing the potential parents.
Analysis of variance (ANOVA) and the principal components method are some of the methods used for esti-mating the repeatability coefficient. Both methods have been used by several researchers and for different crops (Shimoyaet al., 2002; Degenhardtet al., 2002; Ferreiraet al., 1999; Dias and Kageyama, 1998). However, reports on the use of these methods for tomato are not available in the literature.
ANOVA with two variation factors is the most adequate for this study because it excludes temporary ronmental effects. In the one-variation factor model, envi-ronmental effects may be misinterpreted as variation within genotypes and therefore, lead to under-estimates of the re-peatability coefficient (Cruzet al., 2004).
The principal-components method can estimate the repeatability coefficient more efficiently when the geno-type displays cyclic behavior in regard to the trait being studied. Because this effect may vary in different ways and intensities among genotypes, the ANOVA that estimates the usual repeatability coefficient may not eliminate the ad-ditional component of experimental error. Consequently, the repeatability estimator may be underestimated (Cruzet al., 2004).
Because tomato involves multiple harvests, this study estimates the minimum number of harvests necessary to evaluate performance of tomato accessions kept at the Veg-etable Germplasm Bank (Banco de Germoplasma de
Hortaliças) at the Federal University of Viçosa, Minas
Gerais, Brazil.
Material and Methods
The site for the experiment was the Federal Univer-sity of Viçosa (Universidade Federal de Viçosa, UFV), Minas Gerais, Brazil. The experiment had a randomized block design with three replications and included 32 toma-toes accessions from the Vegetable Germplasm Bank
(Banco de Germoplasma de Hortaliças) at UFV and the
cultivars Debora Plus and Santa Clara as controls. Data from nine harvests during the crop cycle included the fol-lowing traits: total number of healthy fruit (TNHFi.e. with-out any biotic or abiotic defect or damage) per plant; total weight (g) of healthy fruit per plant (TWHF); total number of fruit (TNF) and; total fruit weight (g) (TWF).
Statistical analysis was based on the model Yijk= m + gi+ aj+ bk+eij, where Yijk= mean of the three repetitions of each one of the traits evaluated for the genotype i in harvest j; m = general average; gi= effect of genotype i; aj= effect of harvest j; bk= effect of blocks k; andeij= error associated to observation Yijk. The model was considered aleatory.
Estimates of the repeatability coefficient were ob-tained by ANOVA intra-class correlation (Cruz et al., 2004) and by the principal-components method based on the correlations and covariance matrices (Abeywardena, 1972 and Rutledge, 1974).
The computer program used for all analyses was GENES (Cruz, 2001) and the individual methodologies used are described below.
ANOVA
The repeatability coefficient was estimated by means of intra-class correlation, considering the statistical re-duced model based on harvest and genotype averages:
Yik=m+ gi+ ck+eik
where Yik= average value observed relative to the i-th ge-notype at the k-th harvest;m= overall average; gi= random-ized effect of the i-th genotype under the influence of permanent environment (i = 1, ... p; p = 34); ck= fixed effect of the temporary environment on the k-th harvest (k = 1, ..., h;h= 9); andeik= experimental error established by the en-vironmental temporary effects on the i-th genotype, at the k-th harvest.
The coefficient of repeatability r was obtained by:
r cov(Y , Y ) V Y V Y
ik ik
ik ik
g
e g
= =
+ ¢
$
$( )$( ) $
$ $
s
s s
2
2 2
wheres$g 2
= (QMG - QME)/c;s$e 2
= QME.
Principal-components method
The estimate of the coefficient of repeatability can be calculated either by means of a correlation matrix or by a matrix of phenotypical variances and covariances. This method is appropriate when genotypes display cyclic be-havior in relation to the traits being studied.
Principal-components method - correlation matrix
A correlation matrix between genotypes must be ob-tained for each harvest pair. In this matrix, the eigenvalues (l) and eigenvectors (a), standardized from correlation ma-trix (R) are determined.
Eigenvectors, whose elements present the same sig-nal and approximate magnitudes, show a tendency for ge-notypes to maintain their relative positions throughout the various harvest intervals. The estimator of the repeatability coefficient is proportional to the eigenvalue associated to the eigenvector, and expressed by:
r k
j j
=
å
l l
Rutledge (1974) reported thatlk is affected by the number of measurements for each individual. Thus, the es-timator r becomes more adequate to estimate the repeatabil-ity coefficient, which is obtained by:
r= -$ l h
1 1
1
wherel1= 1 + (l- 1)r;l$is the eigenvalue of R associated to the eigenvector, whose elements display the same signal and similar magnitude; h = number of harvests; and p = number of genotypes.
Principal-components method - covariance matrix
The coefficient of repeatability can also be estimated by the principal components method and the matrix of phenotypic variances and covariance (G).
The repeatability coefficient estimator ã is obtained by:
(
)
r Y
Y
=
-$ $
$
l s
s h
1 2 2
1
wherel1is the eigenvalueG$associated to the eigenvector, whose elements display the same sign and similar magni-tude ofs + s$g2 $e2
andh= number of harvests.
Coefficient of determination
Based on the average of harvests (h= 9) and on the estimate of repeatability coefficients (r) obtained by one of the methods used, the coefficient of determination (R2) was calculated for each characteristic. This coefficient repre-sents certainty in predicting the real value of the individuals selected, through the following expression:
R r
1+ r( -1)
2
= h
h
Number of measurements
The number of measurements needed to predict the real value of genotypes based on pre-established coeffi-cients of determination (R2= 0.80,0.85,0.90,0.95 and 0.99) was obtained using the following expression:
hm
2 2
R (1 r) (1 R )r
=
-wherehm= number of measurements necessary to predict the real value, R2= coefficient of determination andG= re-peatability coefficient obtained by applying one of the methods.
Determination of the most appropriate harvests
Following the determination of the ideal number of harvests to predict the value of genotypes with the desired reliability, some harvests within selected harvest groups were eliminated and others were considered most appropri-ate for obtaining the real value of germplasm bank acces-sions. All combinations of six harvests were submitted to repeatability analysis by the principal-components method and the matrix of phenotypic variance and covariance to compare harvest groups based on the traits being evaluated.
Results
The effects of genotypes and harvests were signifi-cant (p < 0.01) for all variables. Traits variability was ob-served between genotypes evaluated in different harvests (Table 1).
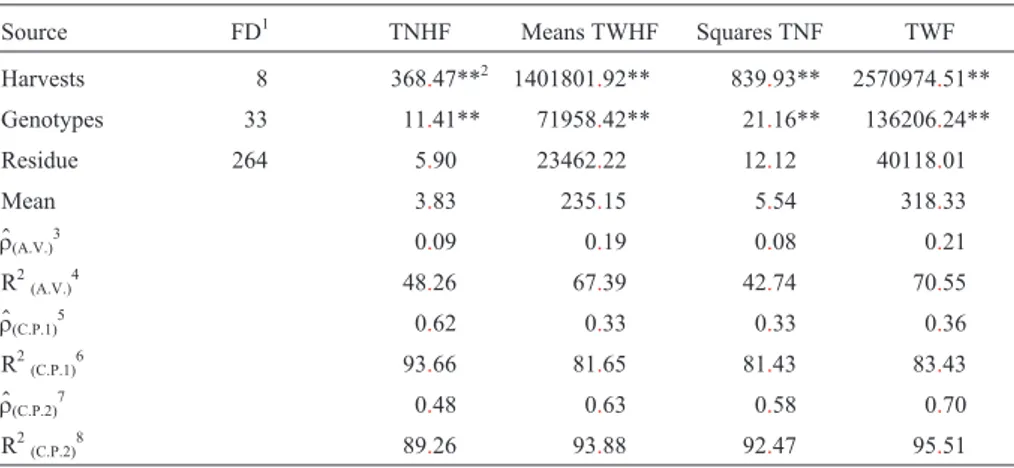
Table 1- Summary of ANOVA for total number of healthy fruit per plant (TNHF), total weight of healthy fruit per plant (TWHF), total number of fruit (TNF) and total weight of fruit (TWF).
Source FD1 TNHF Means TWHF Squares TNF TWF
Harvests 8 368.47**2 1401801.92** 839.93** 2570974.51**
Genotypes 33 11.41** 71958.42** 21.16** 136206.24**
Residue 264 5.90 23462.22 12.12 40118.01
Mean 3.83 235.15 5.54 318.33
$
r(A.V.)3 0.09 0.19 0.08 0.21
R2
(A.V.)4 48.26 67.39 42.74 70.55
$
r(C.P.1)5 0.62 0.33 0.33 0.36
R2(C.P.1)6 93.66 81.65 81.43 83.43
$
r(C.P.2)7 0.48 0.63 0.58 0.70
R2(C.P.2)8 89.26 93.88 92.47 95.51 1
ANOVA showed greater magnitudes for the repeat-ability coefficients (r) for total weight of healthy fruit (TWHF, r = 0.19) and total weight of fruit (TWF, r = 0.21) and maximum determination coefficient of 70% for the TWF variable (Table 1).
Table 1 also shows that the principal component and the correlation matrix repeatability estimates reached nearly twice the value of the estimates obtained by ANOVA for TWHF. Increases in the repeatability estimate by principal-components analysis for total number of fruit (TNF) and total weight of fruit (TWF) were about four times higher than by ANOVA and six times higher for total number of healthy fruit (TNHF).
Repeatability analysis by means of principal compo-nents and the matrix of phenotypic variances and co-variances resulted in coefficient estimates above 92%, except for the TNHF trait which performed best with the use of the correlation matrix and repeatability and determi-nation coefficients of 0.63 and 93% respectively (Table 1). Evaluation of diversity between the tomato accessions studied during nine harvests presented 89.26% precision in the estimate genotypic value of accessions for TNHF and in excess of 92% for all other variables (Table 1). Thus, six harvests ensure that genotypes are selected with a precision of at least a 85% in relation to all the variables studied.
The minimum number of measurements needed for predicting genotypic value at 85% reliability by the princi-pal-components method and phenotypic variance and covariance matrices were: two harvests for TWF, three har-vests for TWHF, four harhar-vests for TNF, and six harhar-vests for TNHF (Table 2). It follows from the findings above that six harvests can be considered as being ideal for analyzing all variables in this experiment. This number of harvests will enhance precision of the other traits to about 90%.
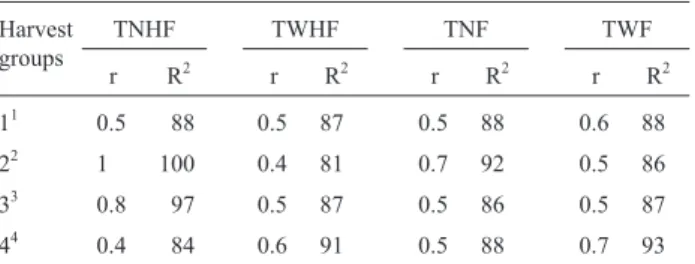
To optimize tomato evaluation, it is necessary to know which of the six harvests are most important for the evaluation. Our results suggest that the evaluation of TNHF and TNF genotypes should occur from the second through the seventh harvest but be omitted from the first and last two harvests. The best times for TWHF and TWF were the
last six harvests, when the coefficients of determination values were most important (Table 3).
Discussion
The low magnitudes of the repeatability coefficient and low estimates of the coefficient of determination ob-served in the ANOVA suggest that this method cannot be adopted to identify superior genotypes successfully. The low coefficients obtained indicate low reliability of genotypic discrimination. Estimates of the repeatability and determination coefficients are considered reasonable and likely to be adopted when above 0.5 and 80% respec-tively (Shimoyaet al., 2002).
Repeatability analysis of principal components based on phenotypic variance and covariance matrices allows high estimates of the coefficient of determination.
Repeatability estimates by principal components that are superior to those obtained by ANOVA indicate cyclical variation between harvests (Cruzet al., 2004), which may, indeed, have occurred considering that the harvest effect was significant.
Repeatability coefficient values obtained in this study may be considered good compared with results obtained for other species,i.e. below 50% for guava fruit production (Degenhardt et al., 2002), rubber tree (Gonçalves et al., 1990), dwarf cashew-tree (Cavalcantiet al., 2000) and co-conut palm tree (Siqueira, 1982) and slightly over 60% for peach tree (Souzaet al., 1998).
Tomato breeding programs in Brazil should take into account the amount and size of the fruit produced because Brazilian consumers demand standardized tomatoes and value those that are heavy and large. Thus, total weight of healthy fruit (TWHF) and total weight of fruit (TWF) need to be evaluated in a tomato breeding program because they identify the most productive genotypes for commercial standards. Principal components analysis using phenotypic variance and covariance matrices for estimating the repeat-ability coefficient is more appropriate because it ensures
Table 2- Number of trait measurements for the total number of healthy fruit per plant (TNHF), total weight of healthy fruit per plant (TWHF), total number of fruit (TNF) and total weight of fruit (TWF) obtained from data for 34 tomato genotypes (32 accessions and 2 control genotypes) associated to the degree of determination of the genotypic value (R2) of 85%.
Trait
Method1 TNHF TWHF TNF TWF
ANOVA 55 25 68 21
PC1 3 11 12 10
PC2 6 3 4 2
1
ANOVA = Analysis of variance; PC1 = principal components-corre-lation matrix; PC2 = principal components-phenotypic variances and covariance matrix.
Table 3- Repeatability coefficients (r) and coefficients of determination (R2) for four groups of six harvests, for total number of healthy fruit per plant (TNHF), total weight of healthy fruit per plant (TWHF), total number of fruit (TNF) and total weight of fruit (TWF) obtained from genotypic data for 34 tomato genotypes.
Harvest groups
TNHF TWHF TNF TWF
r R2 r R2 r R2 r R2
11 0.5 88 0.5 87 0.5 88 0.6 88
22 1 100 0.4 81 0.7 92 0.5 86
33 0.8 97 0.5 87 0.5 86 0.5 87
44 0.4 84 0.6 91 0.5 88 0.7 93
1First six harvests, excluding the three last harvests.2From second to
greater reliability in selecting the most productive geno-types for commercial fruit production.
For all variables studied six harvests allow for the se-lection of genotypes with at least 85% precision and it seems reasonable to infer that six harvests are sufficient to evaluate tomato genotypes. It should be noted that if the ob-jective of the breeding program is to evaluate genotypes for the number of fruit, analysis should start from the second and finish in the seventh harvest. However, if the objective of the program is to evaluate fruit weight, analysis should start from the fourth and end in the ninth harvest. For as-sessment of fruit number and weight, analysis should be from the second to ninth harvests, with a minimum preci-sion of 88% for the coefficient of determination.
Accessions from a specific germplasm bank selected on the basis of traits that are of major interest for a breeding program (e.g.pest and disease resistance and improved fla-vor) can be classified by priority of use according to the auxiliary production characteristic desired (TNHF, TWHF, TNF, TWF).
Acknowledgments
We are thank the Brazilian organizations Fundação de Amparo à Pesquisa do Estado de Minas Gerais (FAPE-MIG), Coordenação de Aperfeiçoamento de Pessoal de Nível Superior (CAPES) and the Conselho Nacional de Pesquisa (CNPq) for their financial support.
References
Abeywardena V (1972) An application of principal component analysis in genetics. Journal of Genetics 61:27-51. Cavalcanti JRV, Paiva JR, Barros LM and Crisóstomo JR (2000)
Repetibilidade de caracteres de produção e porte da planta
em clones de cajueiro-anão precoce. Pesquisa Agropecuária Brasileira 35:773-777.
Cruz CD (2001) Programa GENES: Aplicativo Computacional em Genética e Estatística. Universidade Federal de Viçosa, Viçosa, 648 pp.
Cruz CD, Regazzi AJ and Carneiro PCS (2004) Modelos Biomé-tricos Aplicados ao Melhoramento Genético. 3 ed. Univer-sidade Federal de Viçosa, Viçosa, 480 pp.
Degenhardt J, Ducroquet JP, Reis MS, Guerra MP and Nodari RO (2002) Efeito de anos e determinação do coeficiente de repetibilidade de características de frutos de goiabeira-ser-rana. Pesquisa Agropecuária Brasileira 37:1285-1293. Dias LAS and Kageyama PY (1998) Repeatability and minimum
harvest period of cacao (Theobroma cacaoL.) in Southern Bahia. Euphytica 7:1-7.
Fehr WR (1987) Principles of Cultivar Development. Macmillan, New York, 525 pp.
Ferreira RP, Botrel MA, Pereira AV and Cruz CD (1999) Avalia-ção de cultivares de alfafa e estimativas de repetibilidade de caracteres forrageiros. Pesquisa Agropecuária Brasileira 34:995-1002.
Gonçalves PS, Cardoso M and Sáes LA (1990) Estimativas de repetibilidade na seleção de árvores adultas de seringueira. Pesquisa Agropecuária Brasileira 25:1031-1038.
Rutledge JJ (1974) A scaling which removes bias of Abeywar-dena’s estimator of repeatability. Journal of Genetics 61:247-250.
Shimoya A, Pereira AV, Ferreira RP, Cruz CD and Carneiro PCS (2002) Repetibilidade de características forrageiras do ca-pim-elefante. Scientia Agrícola 59:227-234.
Siqueira ER (1982) Coeficiente e repetibilidade da produção de frutos de coqueiro comum. Pesquisa Agropecuária Brasilei-ra 17:573-574.
Souza VAB, Byrne D and Taylor JF (1998) Heritability genetic and phenotypic correlations, and predicted selection res-ponse of quantitative traits in peach II: An analysis of several fruit traits. Journal of the American Society for Hor-ticultural Science 123:604-611.