Genetic diversity and DNA content of three South American and three
Eurasiatic
Trifolium
species
Marco Dalla Rizza
1, Daniel Real
2,3,4, Rafael Reyno
2, Valentina Porro
5, Juan Burgueño
6, Eugenia Errico
1and Kenneth H. Quesenberry
71
Biotechnology Unit, National Institute of Agricultural Research, INIA Las Brujas, Canelones, Uruguay.
2
Forage Legume Department, National Institute of Agricultural Research, INIA Tacuarembó, Tacuarembó,
Uruguay.
3
Cooperative Research Centre for Plant-Based Management of Dryland Salinity,
The University of Western Australia, University Field Station, Shenton Park, Australia.
4
School of Plant Biology, Faculty of Natural and Agricultural Sciences,
The University of Western Australia, Crawley, Australia.
5
Flow Cytometry and Cell Sorting Core, Institute of Biological Research Clemente Estable,
Montevideo, Uruguay.
6
International Maize and Wheat Improvement Center, Mexico, DF, Mexico.
7
Department of Agronomy, University of Florida, Gainesville, USA.
Abstract
Six species ofTrifolium (T. polymorphum Poir., T. riograndense Burkart, T. argentinense Speg., T. medium L., T. pratense L. and T. repens L.) were analyzed using inter-simple sequence repeats (ISSR) markers. Six selected prim-ers generated 186 polymerase chain reaction (PCR) products exploring 112 loci in 34 genotypes analyzed with mo-lecular sizes ranging from 200 to 1300 bp. These primers were able to discriminate among and within species, with the PCR products being on average 41.6% species-specific and 59.9% polymorphic at the within species level. Nu-clear DNA content was determined by flow cytometry and revealed variation among species. The 1Cx genome size values were calculated and were found to range from 0.46 pg (T. pratense) to 0.96 pg (T. polymorphum). Genome size values of South American species were higher than those of Eurasiatic origin. The analyses of the molecular data grouped the six species in agreement with their geographical origin and clearly differentiateT. polymorphum fromT. argentinense. The Eurasiatic group showed the highest average of species-specific bands (45.3%) and the South American group exhibited the highest amount of total bands (59.7). The highest level of intra-species polymorphisms was detected inT. argentinense (92.9%), followed by T. medium (89.5%).
Key words:DNA content, genetic variability, inter-SSR,Trifoliumspp.
Received: March 16, 2007; Accepted: May 17, 2007.
Introduction
The genus Trifolium consists of about 230 species (Gilletet al., 2001) with a wide distribution and adaptation to different agro-ecological regions (Izaguirre, 1995; Ellisonet al., 2006; Viintinet al., 2006), although, only a few of them are commercially used as forage crops.
There are threeTrifoliumspecies native to the Cam-pos region of southern Brazil, western Argentina and Uru-guay which areT. argentinense, T. polymorphum,andT.
riograndense. These nativeTrifoliumspecies contribute to the high quality production of beef, dairy products, leather and wool with low levels of inputs to the system. The diffi-culty of producing interspecific hybrids even among closely related Trifoliumtaxa has spurred interest in the evaluation of the agronomic potential of locally utilized and currently uncultivated species (Ellisonet al., 2006). In Uruguay, germplasm collections of nativeTrifolium cies were made in 1997, 2003 and 2005. These native spe-cies are long-lived perennials in the Campos region environment, withT. argentinenseandT. polymorphum be-ing unique species in the genusTrifoliumbecause they bear both typical aerial flowers in clusters and also small subter-Send correspondence to Marco Dalla Rizza. Biotechnology Unit,
National Institute of Agricultural Research, INIA Las Brujas, Cane-lones, Uruguay. E-mail: [email protected].
ranean basal flowers arising from the axis of the stolons and leaves (Izaguirre, 1995; Realet al., 2007). These two spe-cies with this particular characteristic belong to the Campos region produce a very unusual patch-like growth form in the open field. AlthoughT. argentinenseis very similar to
T. polymorphumthe former is mostly glabrous, has yellow to cream flowers and is usually found in waterlogged areas (Izaguirre and Beyhaut, 1998). Zohary and Heller (1984) consideredT. argentinense andT. polymorphum as syn-onyms. The other species, T. riograndense is native to southern Brazil (Schifino-Wittmann, 1985; Schifino-Wit-tmann, 2000) and northern Uruguay (Izaguirre and Bey-haut, 1998). All these Campos region’s native populations have evolved into adapted ecotypes through long exposure to environmental stresses, grazing and by competing with the native C3 and C4 grasses which have dominated the
Campos vegetation over a long period of time.
Eurasiatic Trifolium species include T. medium, T. pratenseandT. repens, with the latter two being the main perennialTrifoliumspecies in the world. However, these two species lack persistence in the temperate to subtropical environment found in the Campos region and have to rely on their reseeding capacity to perenniate. A long-lived pe-rennial is the rhizomatousT. medium, and this species is currently being studied for its ability to adapt to conditions in Uruguay.
The majority ofTrifoliumspecies are diploid; a few are tetraploid while higher ploidy levels are rare. The most common basic chromosome number (80% of species) is x = 8 (Viintinet al., 2006). Recently, Ellisonet al.(2006) and Viintinet al.(2006) reported detailed and comprehen-sive studies of the molecular phylogenetic framework for the genusTrifolium. There are different molecular methods for germplasm evaluation using simple and effective mark-ers based on the polymerase chain reaction (PCR) (Barca-cciaet al., 1999; Fernándezet al., 2002; Barreto Diaset al., 2004; Realet al., 2004). For germplasm variability evalua-tion, identification of cultivars and genetic distance estima-tion, dominant markers such as amplified fragment length polymorphisms (AFLPs), random amplified polymorphic DNAs (RAPDs) and inter-simple sequence repeats (ISSR) have been widely utilized during the past 15 years (for re-views, see Antonius-Klemola, 1999 and Ulloaet al., 2003). The AFLP technique is a powerful and reliable tool capable of probing a large number of genomic loci per experiment and discriminating genetic differences, but is a laborious and somewhat expensive methodology based on the selec-tive amplification of restriction fragments and requires the purchase of a kit and polyacrylamide gels for separating the products. InTrifolium, primarily RAPDs (dominant mark-ers) have been utilized for the evaluation of genetic diver-sity inT. pratense(Kongkiatngamet al., 1996; Campos and Ortega, 2001; Gustineet al., 2002; Greeneet al., 2004; Sica
et al., 2005). However, the ISSR-PCR method (Wolfe and Liston, 1998) using primers based on
di-tri-tetra-penta-nucleotide repeats without the requirement for prior knowl-edge of the genome sequence seems particularly suitable for germplasm comparison. The advantage of the use of ISSR as a dominant marker compared to RAPD has been the repeatability of ISSR methodology reported for several species (Jainet al., 1999; Fernándezet al., 2002; Sicaet al., 2005).
In the study described in this paper were used 14 ISSR markers to study theinter-andintra-species variabil-ity in sixTrifoliumspecies (three of Eurasiatic origin and three of South American origin). We also estimated the nu-clear DNA content of these species using flow cytometry. Using these simple and reliable markers it was possible to differentiate between the two previously ambiguous clo-sely related speciesT. argentinenseandT. polymorphum.
Materials and Methods
Plant material
Two accessions of Trifolium polymorphum Poir. were collected at the North Regional of the National Insti-tute of Agricultural Research (Instituto Nacional de Inves-tigación Agropecuaria – INIA) located in Tacuarembó, Uruguay (31°44’20” S, 55°8’46” W) while Trifolium argentinense Speg was collected in fields near the Uru-guayan towns of Tacuarembó (31°46’35” S, 55°40’19” W) and Florida (33°30’13” S, 55°49’26” W). We grew
Trifolium medium L. (donated by the genebanks of Gatersleben, Germany and Kew Botanical Garden, United Kingdom) andTrifolium riograndenseBurkart (INIA ‘La Estanzuela’ genebank) from seeds, while Trifolium pratenseL. andTrifolium repensL. are naturalized in Uru-guay and the accessions utilized in this study were collected at INIA Las Brujas, Uruguay (34°40’19” S, 56°20’24” W). All the species studied were mainly cross-pollinated (Schifino-Wittmann, 1985; Gilletet al., 2001; Realet al., 2007), exceptT. argentinensebecause its breeding system is not reported in the literature.
ForT. medium, T. polymorphumandT. riograndense, two accessions represented by four genotypes each were assayed. ForT. argentinensetwo accessions were studied, one with four genotypes and the other with two genotypes. TheT. pratenseandT. repenswere represented by one ac-cession with two genotypes each. In total, 34 genotypes were studied from the six species.
Determination of nuclear DNA content by flow cytometry
fil-tered through a 45µm mesh nylon membrane into a 5 mL cytometry tube and kept at room temperature for 10-60 min. Finally, after addition of 0.5 mL Otto II buffer (0.4 M Na2HPO4.12H2O), RNAse (50µg/mL) and
propi-dium iodide (50 µg/mL), plant cell nuclei were immedi-ately analyzed by flow cytometry. The DNA content analy-sis was carried out in a FACS Vantage flow cytometer (Becton Dickinson, San José, California) using an Innova 300 laser at 488 nm and CELLQuest software (Becton Dickinson). Chicken red blood cells (CRBC) were used to calibrate the flow cytometer to optimize forward and side scatter and fluorescence parameters. Pulse processing for cytometric DNA content estimation was adjusted using DNA QC Particles (Becton Dickinson) to check instrument linearity and doublet discrimination performance following the instructions of the manufacturer, with Zea mays cv CE-777 (2C = 5.43 pg) being used as the internal reference standard. Two plants per species were analyzed and three DNA estimations were carried out for each plant (5000 to 10000 nuclei per analysis). Nuclear DNA content was cal-culated as: (Sample peak mean/Standard peak mean) x 2C DNA content of the standard (in pg). The Cx-values were obtained by dividing the nuclear DNA content by the corre-sponding ploidy level. For Cx-value calculations, chromo-some numbers ofTrifoliumspecies were taken from Schi-fino-Wittmann (2000), Viintinet al.(2006) and Mowforth (1986).
Genomic DNA extraction and ISSR amplification
DNA was extracted from freshly harvested young leaflets from actively growing plants in the field or in the greenhouse, using a small-scale sodium dodecyl sulfate (SDS) procedure (Dalla Rizzaet al., 2004). The DNA anal-yses were performed on individual genotypes as well as on
a posterioribulked DNA using 20 ng of DNA of each geno-type to produce the bulk (Kongkiatngamet al., 1996). Since the bulk was performed using the accession genotypes it was used as an indicator to easily find and confirm individ-ual PCR products. The DNA concentration was assessed both spectrophotometrically at 260 nm and by 0.9% (w/v) agarose gel electrophoresis, quantified with λ DNA and stained with ethidium bromide. Each polymerase chain re-action (PCR) was done in a 20µL volume containing 80 ng of genomic DNA, 1.25 mM of MgCl2, 75 mM Tris-HCl (pH 8.8), 20 mM (NH4)2SO4, 0.01% (v/v) Tween 20, 200µM each of dCTP, dGTP, dATP and dTTP, 0.2 mM of primer and 1 unit of TaqDNA Polymerase (Fermentas Life Science, CA, USA). The DNA amplification was per-formed with 14 synthetic ISSR primers (Tsumura et al., 1996; Jain et al., 1999). Based on previously results re-ported in plant species surveyed using ISSR markers, dif-ferent types of nucleotide motifs were assayed. The simple-sequence primers used in this study were (AG)8T,
(AG)8TA, (AG)8CA, (AC)8CT, (GT)8CG, (CT)8GG,
(GACA)4, (GACAC)3, (TGTC)4, (CAG)5, (GGAGA)3,
(TGC)6, (AGT)6and (CTTCA)3and were obtained from
Operon (Cologne, Germany). The PCR conditions were as follows: pre-incubation for 7 min at 94 °C, followed by 45 cycles of 30 s at 94 °C, 45 s at 52 °C, 1.5 min at 72 °C and a final 7 min extension at 72 °C. The annealing temperature was assayed 48 °C for (GACA)4, (GACAC)3and (TGTC)4
and 60 °C for (CAG)5. The PCR was performed in a Genius
thermal cycler (Techne Ltd., Cambridge, UK) and the PCR products were separated on 3% (w/v) agarose gels using 1 x TAE buffer (Maniatiset al., 1982), 100 bp standard mark-ers (GeneRuler, Fermentas) and stained with ethidium bro-mide.
ISSR marker scoring and data analyses
Band patterns were digitized using the gel image analysis system Gel-Pro imager (MD, USA). Bands were scored directly into a spreadsheet and ISSR markers were scored as presence (1) and absence (0) of a band. Only re-producible well-marked amplified bands were scored. Faint amplified products and irreproducible fragments were not considered for the analysis. Bands with the same mobility were considered as identical fragments, irrespec-tive of band intensity. According to Tsumuraet al.(1996), ISSR markers are considered to be dominant markers and consequently effectively act as bi-allelic loci (band pres-ence vs. absence). To determine genetic distances, the uncentered correlation coefficient was used. Hierarchical cluster analysis was performed using the average method (Everittet al., 2001). To asses the uncertainty in hierarchi-cal cluster analysis, multishierarchi-cale bootstrap resampling was done (10000 samples) and an approximately unbiased (AU) p-value was calculated for each cluster (Shimodaira, 2004). The P-value of a cluster indicates how strong the cluster is supported by the data, and lies between 0 and 1 (strongest). The matrix of genetic similarities was repre-sented in a dendrogram together with AU values. Clusters with high AU p-values (0.95) were highlighted. All the analyses were performed using the pvclust package in the statistical software R version 2.5.0 (http://www. r-project.org/, Suzuki, 2005). The polymorphism informa-tion content (PIC) was calculated as: PIC = 1 -∑Pi, where Piis the band frequency of the i-th allele; for ISSR values PIC = 1 – p2– q2, where p = band frequency and q = no-band frequency. The PIC values for each ISSR marker generated by the same primer were summed and denominated the ISSR primer index (IPI) according to Ghislainet al.(1999).
Results
inter- and intra species differences in ploidy level, the as-sessment of nuclear DNA content is essential for breeding programs. The ploidy level ofT. argentinenseis unknown. The nuclear DNA content ofTrifoliumspecies estimated by flow cytometry varied between 0.91 pg forT. pratenseand 8.58 pg forT. medium. Nointra-specific variations were found between the different accessions ofT. argentinense,
T. polymorphum, T. pratense, T. repens and T. riograndense. However, different nuclear DNA values were observed in the two accessions ofT. medium(6.86 pg and 8.58 pg), which might be explained by different ploidy levels between the two accessions (Table 1).
Calculated genome sizes (1Cx-value in pg) of the six
Trifoliumspecies of known ploidy level (Table 1) ranged from 0.46 pg forT. pratenseto 0.96 pg forT. polymorphum, with similar values for the South American species having a higher genome size in comparison with those of Eurasiatic origin (Table 1).
From the 14 ISSR primers screened in the six
Trifoliumspecies, only six were selected as the most infor-mative ones, which generated 186 total bands. The other eight ISSR primers gave either smeared, poor or irrepro-ducible bands in all species and were therefore rejected. Thus, the ISSR primer useful for analyses of the genus
Trifolium were: (AG)8T, (AG)8TA, (AG)8CA, (AC)8CT,
(GACA)4and (GACAC)3(Figure 1).
The PCR products obtained ranged from 200 bp to 1300 bp. All six selected ISSR primers revealed polymor-phism among theTrifoliumspecies with an average of 31 total scorable bands by primer, ranging, on average, for each species from 2.8 for (AG)8CA to 9.3 for (GACA)4
(Table 2). The PIC index was used to characterize the ca-pacity of each primer to reveal or detect polymorphic loci, the ISSR primer showing the highest average PIC value be-ing (AG)8T and the primers with the highest IPI were
(GACA)4, (AG)8TA and (GACAC)3(Table 2).
Considering the average percentage ofintra-species polymorphism per primer,T. argentinenseandT. medium
showed the highest values, as opposed to T. repens for which no polymorphisms were observed (Tables 3 and 4). The (GACAC)3primer inter-SSR profiles for
individ-ual genotypes and bulked DNA are shown in Figure 1. The South American species showed a higher number of bands than the Eurasiatic species andT. argentinenseshowed the highest number of bands with 42 out of a total of 186 bands (Table 4). The Eurasiatic species showed a higher percent-age of species-specific bands (45.3%) than the South American species (26.1%). When bands shared among
Trifoliumspecies were considered (at least one band be-tween three species),T. mediumandT. repensshowed the lowest values (Table 4).
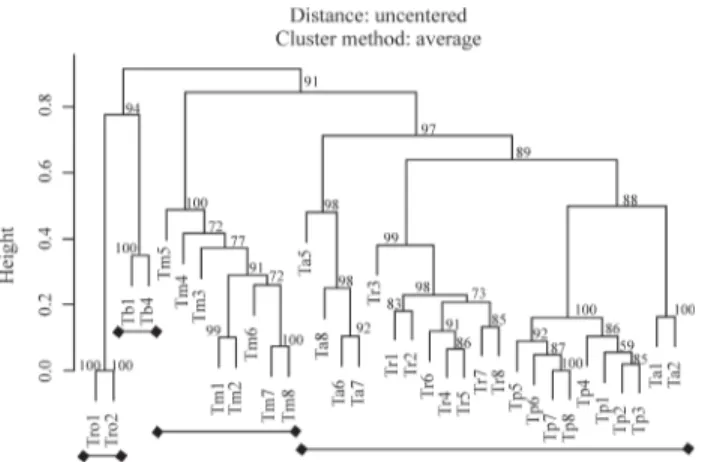
A distance matrix was produced for the 34 genotypes using the uncentered correlation coefficient (Figure 2). Cluster analysis based on a pairwise genetic distance ma-trix, using the average method, grouped the 34 genotypes into clusters with distance ranging from 0 to 0.9. The acces-sions within the species were grouped into four clusters (AU = 0.95). The species clusters are shown in Figure 2, from which it can be seen that the South American species were grouped together as were the Eurasiatic species.
Table 1- Somatic chromosome number (2n) and nuclear DNA content of sixTrifoliumspecies.
Species Somatic chromosome number (2n) Ploidy level (x) 2C-value+SD (pg) 1Cx-value (Mbp)
Eurasiatic origin
T. medium1 80 (Mowforth, 1986) 10
6.86 (+0.04) 675
T. medium1 96 (Viintinet al., 2006) 12* 8.58 (+0.03) 704
T. pratense1 14 (Viintinet al., 2006) 2 0.91 (+0.02) 450
T. repens1 32 (Viintinet al., 2006) 4
2.22 (+0.04) 548
South American origin
T. argentinense2 nd nd
1.92 (+0.02)
T. polymorphum2 16 (Schifino-Wittmann, 2000) 2 1.93 (+0.03) 939
T. riograndense2 16 (Schifino-Wittmann, 2000) 2 1.79 (+0.03) 880
Cx value = (2C-value/ploidy level) x 1 pg DNA; 1 pg DNA = 978 Mbp (Doleelet al., 2003); nd = non determined SD = standard deviation. *Tentative ploidy level.
Figure 1- Inter-simple sequence repeats (ISSR) profiles of sixTrifolium
species based on the (GACAC)3primer. A: individual profiles of
Discussion
Flow cytometry studies showed a higher Cx-value for the South American species and an increased intra-specific variation inT. medium(Table 1). Similar Cx-values forT. pratense (0.427 pg), T. repens (0.559 pg), T. medium
(0.645 pg) andT. polymorphum(1.025 pg) have been re-ported by Viintinet al.(2006). There were different ploidy levels among the sixTrifolium species studied (Table 1) and this might have affected band intensity due to the pres-ence of different copies of the same locus in the genome, because of which differences in band intensity for the
mo-lecular analysis were not considered in our study. The ISSR markers applied to the sixTrifoliumspecies proved to be suitable for the analysis of genetic diversity. In all the spe-cies, the analysis of common bands shared by most of the individual genotypes inside the accession group were con-gruent when compared with the bulked DNA sample and confirmed the methodology employed for band evaluation.
Ecogeographical and species discrimination based on individual fingerprinting or bulked DNA of accessions was achieved. Moreover, all the species generated profiles with intra-polymorphic bands and species-specific bands. Since
Table 2- Characteristics of selected inter-simple sequence repeats (ISSR) primers for fourTrifoliumspecies.
ISSR primers Total bands
generated
Species average number of bands per primer
Species exhibiting most polymorphisms
Average PIC*
ISSR marker index (IPI)†
(AG)8TA 29 4.8 T. medium,T. riograndense 0.27 4.94
(AG)8CA 17 2.8 T. argentinense 0.29 2.89
(AG)8T 24 4 T. argentinense 0.30 4.19
(AC)8CT 29 4.8 T. argentinense,T. medium 0.21 3.55
(GACA)4 56 9.3 T. argentinense,T. medium
T. riograndense
0.21 6.86
(GACAC)3 31 5.2 T. argentinense,T. medium 0.22 4.38
*PIC, Polymorphism information content.
†IPI, ISSR primer index.
Table 3- Inter-simple sequence repeats (ISSR) primer analysis of sixTrifoliumspecies. Total bands (T) and percentage of intra-species polymorphisms (%P) generated with the (AG)8TA, (AG)8CA, (AG)8T, (AC)8CT, (GACA)4and (GACAC)3primers.
Primers
Trifolium (AG)8TA (AG)8CA (AG)8T (AC)8CT (GACA)4 (GACAC)3
species T %P T %P T %P T %P T %P T %P
T. medium 6 100.0 1 0.0 7 71.4 10 100.0 10 100.0 4 75.0
T. pratense 3 0.0 2 0.0 1 0.0 1 0.0 3 0.0 6 0.0
T. repens 2 0.0 3 0.0 2 50.0 3 66.7 9 88.9 2 0.0
T. argentinense 8 87.5 4 100.0 3 100.0 7 85.7 11 100.0 9 88.9
T. polymorphum 6 83.3 4 25.0 4 50.0 1 0.0 7 28.6 6 50.0
T. riograndense 4 100.0 3 66.7 7 71.4 7 85.7 16 93.8 4 0.0
Table 4- Total bands, percentage of species specific bands, percentage ofintra-species polymorphic bands and proportion of shared band among six
Trifoliumspecies generated with six Inter-simple sequence repeats (ISSR) primers.
Trifoliumspecies Total bands Percentage of species-specific bands
Percentage ofintra-species polymorphism
Proportion of shared bands*
T. medium 38 39.5 89.5 18.4
T. pratense 16 50.0 0.0 31.3
T. repens 21 52.4 52.4 23.8
T. argentinense 42 33.3 92.9 42.9
T. polymorphum 28 21.4 46.4 39.3
T. riograndense 41 19.5 78.0 29.3
ISSR markers cover all the genome, the six primers ana-lyzed 112 loci, and the selection of consistent bands led to reliable estimates of genetic relationships. Considering the repeatability and the simplicity of the analysis, it might be considered as supplementary evidence for determining rights of inventor when summed to the descriptor data of a variety (Jain et al., 1996; Lanham and Brennan, 1999; Barreto Dias, 2004).
The analysis ofTrifoliumspecies using ISSR markers can be complemented with agronomic data and may thus present a readily accessible means for studying ISSR-associated polymorphism and as marker assisted selection Tsumuraet al., 1996; Sicaet al., 2005).
For the Trifolium species studied, this is, to our knowledge, the first report of molecular variability evalua-tion using ISSR markers. In this study,T. mediumandT. argentinense showed the highest level of intra-species polymorphism (Table 4), supporting the work of Zohary and Heller (1984) who reported thatT. mediumwas an ex-tremely polymorphic species. The South American species generally yielded the highest total number of primer bands, showing 59.7% of all recorded bands. This characteristic might be due to differences in genome size, because, in ef-fect, the South American species showed a higher genome size than the Eurasiatic species (Table 1), as has also been reported by Viintinet al.(2006). The larger the genome the more putative loci can be explored by dominant mark-ers. In our study, the differences in genome size were corre-lated with the geographical origins, also previously reported by agreement with Viintinet al.(2006). Further-more, our results show thatT. argentinensewas the most polymorphic of the accessions, revealing the potential of this type of marker in this species. A low similarity was ob-served among accessions forT. argentinense,probably due to the contrasting ecogeographical location. Nevertheless,
T. argentinensewas grouped withT. polymorphumandT.
riograndense. All the ISSR markers clearly discriminated betweenT. argentinenseandT. polymorphumand suggests that they are in fact different species, supporting the view of several workers (Burkart, 1987; Izaguirre, 1995; Ellisonet al., 2006) but contrasting with the opinion of Zohary and Heller (1984) that they are different species.
Isobeet al.(2002) reported hybridization between the Eurasiatic Trifoliumspecies T. mediumand T. pratense, and these species were clearly separated in the present study by the six ISSR assayed, while the group of South American species analyzed showed similarities that en-courage the possibilities of combining characteristics through interspecific crosses. The South American species were clustered together, clearly separating them from the Eurasiatic species but also showing intra-species variability (Figure 2). The clade formed agreed with the classification of Ellison et al. (2006), who placed T. argentinense, T. polymorphum and T. riograndense in the Section
Involucrariumand belonging to the clade O of their study, whileT. mediumandT. pratensewere placed in the Section
TrifoliumandT. repensin the SectionTrifoliastrum. Fur-thermore, Viintinet al.(2006) found similar relationships between the Eurasiatic and American species based on In-ternal Transcribed Spacer (ITS) polymorphisms. Our ge-netic-distance estimates within each cluster showed the extensive genetic variation within the species, with T. polymorphumexhibiting lower levels of genetic variability as compared withT. argentinense. We found no variability in the allogamous speciesT. repens, probably due to the low number of genotypes analyzed.
The information generated in this study established an easy, fast and reliable marker system which could be trans-ferred to other laboratories. All the ISSR markers could clearly discriminate between T. argentinense and T. polymorphum, indicating that they are in fact different spe-cies. These results indicate that the ISSR markers used in our study could be used in future research to evaluate the vari-ability present in each of the sixTrifoliumspecies studied.
Acknowledgments
The authors wish to acknowledge the INIA techni-cians M. Zarza, R. Mérola, A. Viana and M.B. Bonilla for their support in the glasshouse, field and laboratory work for this project. We wish to thank the Directors of INIA Tacuarembó (Dr. G. Ferreira) and INIA Las Brujas (Dr. A. Rabuffetti). We also acknowledge the useful comments that the editors of Genetics and Molecular Biology pro-vided on the manuscript. This work was supported by INIA-MEC/CE N°8151, USDA-TSTAR and SECIF funds.
References
Antonius-Klemola K (1999) Molecular markers in Rubus
(Rosaceae) research and breeding. J Hort Sci Biotech 74:149-160.
Barcaccia G, Albertini E and Falcinelli M (1999) AFLP finger-printing inPelargonium peltatum: Its development and po-tential in cultivar identification. J Hort Sci Biotech 74:243-250.
Barreto Dias PM, Dall’Agnol M and Schifino-Wittmann MT (2004) Genetic diversity in the Brazilian species ofAdesmia
DC (Leguminosae) as assessed by RAPD. J Plant Gen Res 2:43-50.
Burkart A (1987) Leguminosae. In: Troncoso NS and Bacigalupo NM (eds) Flora Ilustrada de Entre Ríos (Argentina). INTA, Buenos Aires, v. 6, pp 442-763.
Campos de Quiroz H and Ortega Klose F (2001) Genetic variabil-ity among elite red clover (Trifolium pratenseL.) parents used in Chile as revealed by RAPD markers. Euphytica 122:61-67.
Dalla Rizza M, Real D, Quesenberry KH and Albertini E (2004) Plant reproductive system determination under field condi-tions based on codominant markers. J Genet Breed 58:47-54.
Doleel J and Göhde W (1995) Sex determination in the dioecious plants Melandrium album and M. rubrum using high-resolution flow cytometry. Cytometry 19:103-106. Doleel J, Barto J, Voglmayr H and Greilhuber J (2003) Nuclear
DNA content and genome size of trout and human. Cyto-metry 51:127-128.
Ellison NE, Liston A, Steiner JJ, Williams WM and Taylor NL (2006) Molecular phylogenetics of the clover genus (Trifolium-Leguminosae). Mol Phylogenet Evol 39:688-705.
Everitt BS, Landau S and Leese M (2001) Cluster Analysis. 4th edition. Edward Arnold, London, 237 pp.
Fernández ME, Figueiras AM and Benito C (2002) The use of ISSR and RAPD markers for detecting DNA polymorphism, genotype identification and genetic diversity among barley cultivars with known origin. Theor Appl Genet 104:845-851.
Ghislain M, Zhang D, Fajardo D, Huamán Z and Hijmans RJ (1999) Marker-assisted sampling of the cultivated Andean potato Solanum phurejacollection using RAPD markers. Genet Res Crop Evol 46:547-555.
Gillet JM, Collins M and Taylor NJ (2001) The World of Clovers. Iowa State University Press, Ames, 457 pp.
Greene SL, Gritsenko M and Vandemark G (2004) Relating morphologic and RAPD marker variation to collection site environment in wild populations of red clover (Trifolium pratenseL.). Genet Res Crop Evol 51:643-653.
Gustine DL, Voigt PW, Brummer EC and Papadopoulos YA (2002) Genetic variation of RAPD markers for North Amer-ican white clover collections and cultivars. Crop Sci 42:343-347.
Isobe S, Sawai A, Yamaguchi H, Gau M and Uchiyama K (2002) Breeding potential of the backcross progenies of a hybrid betweenTrifolium mediumxT. pratensetoT. pratense.Can J Plant Sci 82:395-399.
Izaguirre P (1995) Especies Indígenas y Subespontáneas del GéneroTrifoliumL. (Leguminosae) en el Uruguay. Serie Técnica n. 58. Instituto Nacional de Investigación Agro-pecuaria, Uruguay, 22 pp.
Izaguirre P and Beyhaut R (1998) Las Leguminosas en Uruguay y Regiones Cecinas. Parte 1. Editorial Hemisferio Sur, Monte-video, 548 pp.
Jain A, Apparanda C and Bhalla PL (1999) Evaluation of genetic diversity and genome fingerprinting of Pandorea
(Bignoniaceae) by RAPD and inter-SSR PCR. Genome 42:714-719.
Kongkiatngam P, Waterway MJ, Coulman BE and Fortin MG (1996) Genetic variation among cultivars of red clover (Trifolium pratenseL.) detected by RAPD markers ampli-fied from bulk genomic DNA. Euphytica 89:355-361. Lanham PG and Brennan RM (1999) Genetic characterization of
gooseberry (Ribes grossularia subgenus Grossularia) germplasm using RAPD, ISSR and AFLP markers. J Hort Sci Biotech 74:361-366.
Maniatis T, Frisch EF and Sambrook J (1982) Molecular Cloning: A Laboratory Manual. Cold Spring Harbor Laboratory, Cold Spring, New York.
Mowforth MAG (1986) Variation in nuclear DNA amounts in flowering plants: An ecological analysis. Ph.D. Thesis, Uni-versity of Sheffield, England.
Real D, Dalla Rizza M, Quesenberry KH and Echenique M (2004) Reproductive and molecular evidence for allogamy in
Lotononis bainesiiBaker. Crop Sci 44:394-400.
Real D, Dalla Rizza M, Reyno R and Quesenberry KH (2007) Breeding system of the aerial flowers in an amphicarpic clo-ver species:Trifolium polymorphum.Crop Sci 47:1401-1406. Schifino-Wittmann MT (1985) Estudios citogenéticos emTrifolium riograndenseBurkart,T. polymorphumPoir. eT. repensL.: Indução de poliploidia, número cromossômico, cariotipo, comportamento meiótico. Ph.D. Thesis, Universidade Federal de Rio Grande do Sul, Rio Grande do Sul, Brazil.
Schifino-Wittmann MT (2000) The cytogenetics and evolution of forage legumes from Rio Grande do sul: A review. Genet Mol Biol 23:989-995.
Shimodaira H (2004) Approximately unbiased tests of regions us-ing multistep-multiscale bootstrap resamplus-ing. Annals of Statistics 32:2616-2641.
Sica M, Gamba G, Montieri S, Gaudio L and Aceto S (2005) ISSR markers show differentiation among Italian populations of
Asparagus acutifolius L. J. BMC Genetics 6:17. doi:10.1186/1471-2156-6-17.
Suzuki R and Shimodaira H (2005) PVCLUST, An R package for hierarchical clustering with p-values. http://www.is.titech. ac.jp/~shimo/prog/pvclust/ (May 8, 2007).
Tsumura Y, Ohba K and Strauss SH (1996) Diversity and inheri-tance of inter-simple sequence repeat polymorphisms in Douglas-fir (Pseudotsuga menziesii) and sugi (Cryptomeria japonica). Theor Appl Genet 92:40-45.
Ulloa O, Ortega F and Campos H (2003) Analysis of genetic di-versity in red clover (Trifolium pratenseL.) breeding popu-lations as revealed by RAPD genetic markers. Genome 46:529-535.
Viintin L, Javornik B and Bohanec B (2006) Genetic character-ization of selected Trifolium species as revealed by nuclear DNA content and ITS rDNA region analysis. Plant Sci 170:859-866.
Wolfe AD and Liston A (1998) Contributions of PCR-based methods to plant systematics and evolutionary biology. In: Soltis DE, Soltis PS and Doyle JJ (eds) Plant Molecular Sys-tematics II. Kluwer, Boston, pp 43-86.
Zohary M and Heller D (1984) The genusTrifolium. The Israel Academy of Sciences and Humanities, Jerusalem, 606 pp.